
Key Takeaways:
- Dividend Signal: Grainger stock reflects capital discipline as the board approved a $2 quarterly dividend, supported by $18 billion revenue scale and steady cash generation.
- Execution Update: Grainger stock shows operational consistency as Q3 revenue reached $5 billion and operating margins held near 16% despite moderating industrial demand.
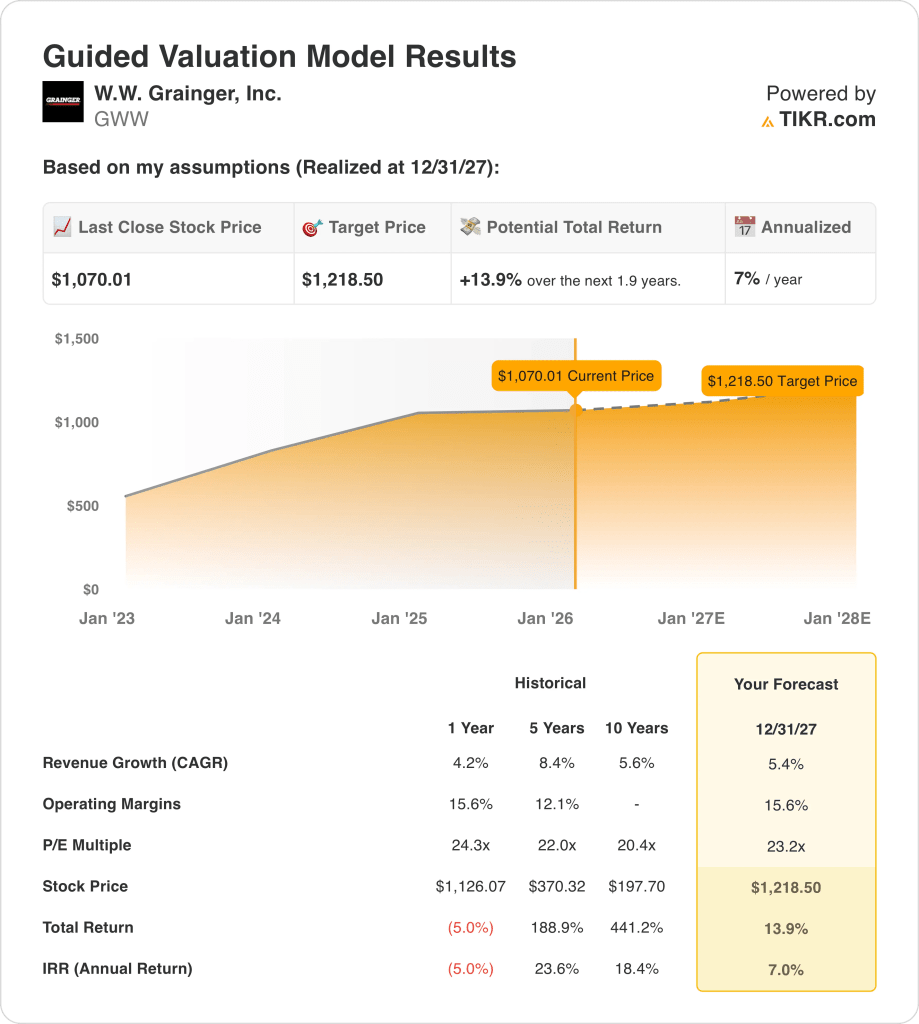
- Price Outlook: Based on stable margins and mid-cycle growth assumptions, Grainger stock could reach $1,218 by 2027 under a normalized valuation framework.
- Upside Math: That target implies 14% total upside from the current $1,070 price, translating to a 7% annualized return over 2 years.
W.W. Grainger (GWW) distributes maintenance and safety products across industrial customers, with scale leadership supported by 2 segments and broad ecommerce reach.
Just this Thursday, a $2 quarterly dividend announcement which reinforces Grainger’s cash discipline after 2025 earnings delivered steady margin performance.
Meanwhile, Grainger generated $18 billion in LTM revenue, reflecting resilient demand from industrial and institutional customers despite slower macro growth.
Net income reached about $3 billion while operating margins near 16% highlight efficiency advantages from pricing discipline and logistics scale.
With a $53 billion market value, Grainger trades at premium multiples against a $1,070 share price worth examining.
What the Model Says for GWW Stock
We analyzed Grainger stock using assumptions tied to its scale distribution model, consistent cash returns, and steady industrial positioning.
Based on 5.4% revenue growth, 15.6% operating margins, and a 23.2x exit multiple, the model points to $1,218.50.
That implies 13.9% total upside, or a 7.0% annualized return, over roughly 1.9 years.
Our Valuation Assumptions
TIKR’s Valuation Model lets you plug in your own assumptions for a company’s revenue growth, operating margins, and P/E multiple, and calculates the stock’s expected returns.
Here’s what we used for GWW stock:
1. Revenue Growth: 5.4%
Grainger generated about $18 billion in LTM revenue as industrial demand normalized after earlier supply-driven volatility.
Recent quarters show stable growth from pricing discipline, ecommerce penetration, and steady demand across manufacturing, healthcare, and government customers.
Softer industrial production and inventory normalization pressure growth, partly offset by digital assortment expansion and high-touch share gains.
Consensus estimates assume 5.4% revenue growth, reflecting steady demand and measured share gains without aggressive volume assumptions.
2. Operating Margins: 15.6%
Operating margins near 15% reflect Grainger’s scale advantages, disciplined pricing, and cost structure proven across industrial cycles.
Margins stayed resilient despite freight normalization and wage pressure, supported by mix improvement and productivity across branch and digital networks.
Downside risks include pricing competition and input volatility, while support comes from private-label growth, automation, and sustained gross margin stability.
In line with analyst consensus projections, operating margins around 15.6% balance normalized costs with Grainger’s historically strong execution discipline.
3. Exit P/E Multiple: 23.2x
Grainger has historically traded at earnings multiples between roughly 20x and 25x during periods of steady growth and high return on invested capital.
Current valuation reflects investor confidence in cash generation, tempered by cautious sentiment around industrial demand and slower macro growth.
Multiple risk stems from earnings deceleration, while upside requires consistent execution and stable margins rather than accelerating growth.
Based on street consensus estimates, a 23.2x exit multiple reflects durable fundamentals without assuming valuation expansion beyond historical norms.
What Happens If Things Go Better or Worse?
W.W. Grainger’s outcomes hinge on industrial demand stability, pricing discipline, and cost control through 2029.
- Low Case: If industrial demand softens and pricing tightens, revenue grows around 4.9% with margins near 10.5% → 2.6% annualized return.
- Mid Case: With core distribution execution holding steady, revenue growth near 5.5% and margins improving toward 11.3% → 8.4% annualized return.
- High Case: If e-commerce mix expands and cost leverage improves, revenue reaches about 6.0% and margins approach 11.8% → 13.7% annualized return.

How Much Upside Does It Have From Here?
With TIKR’s new Valuation Model tool, you can estimate a stock’s potential share price in under a minute.
All it takes is three simple inputs:
- Revenue Growth
- Operating Margins
- Exit P/E multiple
If you’re not sure what to enter, TIKR automatically fills in each input using analysts’ consensus estimates, giving you a quick, reliable starting point.
From there, TIKR calculates the potential share price and total returns under Bull, Base, and Bear scenarios so you can quickly see whether a stock looks undervalued or overvalued.
See a stock’s true value in under 60 seconds (Free with TIKR) >>>
Looking for New Opportunities?
- See what stocks billionaire investors are buying so you can follow the smart money.
- Analyze stocks in as little as 5 minutes with TIKR’s all-in-one, easy-to-use platform.
- The more rocks you overturn… the more opportunities you’ll uncover. Search 100K+ global stocks, global top investor holdings, and more with TIKR.
Disclaimer:
Please note that the articles on TIKR are not intended to serve as investment or financial advice from TIKR or our content team, nor are they recommendations to buy or sell any stocks. We create our content based on TIKR Terminal’s investment data and analysts’ estimates. Our analysis might not include recent company news or important updates. TIKR has no position in any stocks mentioned. Thank you for reading, and happy investing!