

Quality is one of the most overused words in investing. Every company claims to be high-quality. Every fund manager says they focus on quality. But when you press for a definition, the answers vary widely. Some investors mean profitable companies. Others mean companies with strong balance sheets. Still others mean businesses with competitive advantages or consistent earnings.
The lack of precision matters because quality is not just a label. It is a set of measurable characteristics that separate businesses capable of sustaining performance from those that will disappoint over time. High-quality companies earn superior returns on capital, maintain stable margins through economic cycles, generate cash that exceeds reported earnings, and operate with financial strength that allows them to thrive when weaker competitors struggle.
Find out what a stock’s really worth in under 60 seconds with TIKR’s new Valuation Model (It’s free)>>>
Screening for quality requires defining what quality means to you and then translating that definition into specific financial criteria. A screen that returns hundreds of stocks has not filtered enough. A screen that returns nothing has filtered too aggressively. The goal is a focused list of businesses that meet a high standard, providing candidates worthy of deeper research rather than a random collection of names.
This guide explains how to define quality in measurable terms, which metrics matter most, how to combine them into effective screens, and how to use TIKR to identify businesses that meet institutional quality standards.
Why Quality Matters for Long-Term Returns
High-quality businesses outperform over time because they possess characteristics that compound value rather than destroy it. A company earning 18% returns on capital will grow intrinsic value far faster than one earning 8%, assuming both reinvest their earnings. That gap widens every year as returns compound.
Quality also provides resilience. When recessions hit or industries face disruption, high-quality companies have the margins, cash flow, and balance sheet strength to survive and often to gain market share from weaker competitors. Lower-quality businesses face a different reality. Thin margins disappear entirely during downturns. Weak balance sheets force dilutive capital raises or restructurings. The survivors emerge damaged, while quality companies emerge stronger.
The academic evidence supports what intuition suggests. Stocks ranking high on quality metrics like profitability, earnings stability, and low leverage have historically outperformed the market with lower volatility. This quality factor persists across geographies and time periods, suggesting it reflects a fundamental aspect of how markets price businesses rather than a temporary anomaly.
Screening for quality does not guarantee outperformance in any given year. High-quality stocks can underperform during speculative manias when investors chase unprofitable growth stories. But over full market cycles, quality tends to win because the underlying businesses generate the cash flows that ultimately drive stock prices.
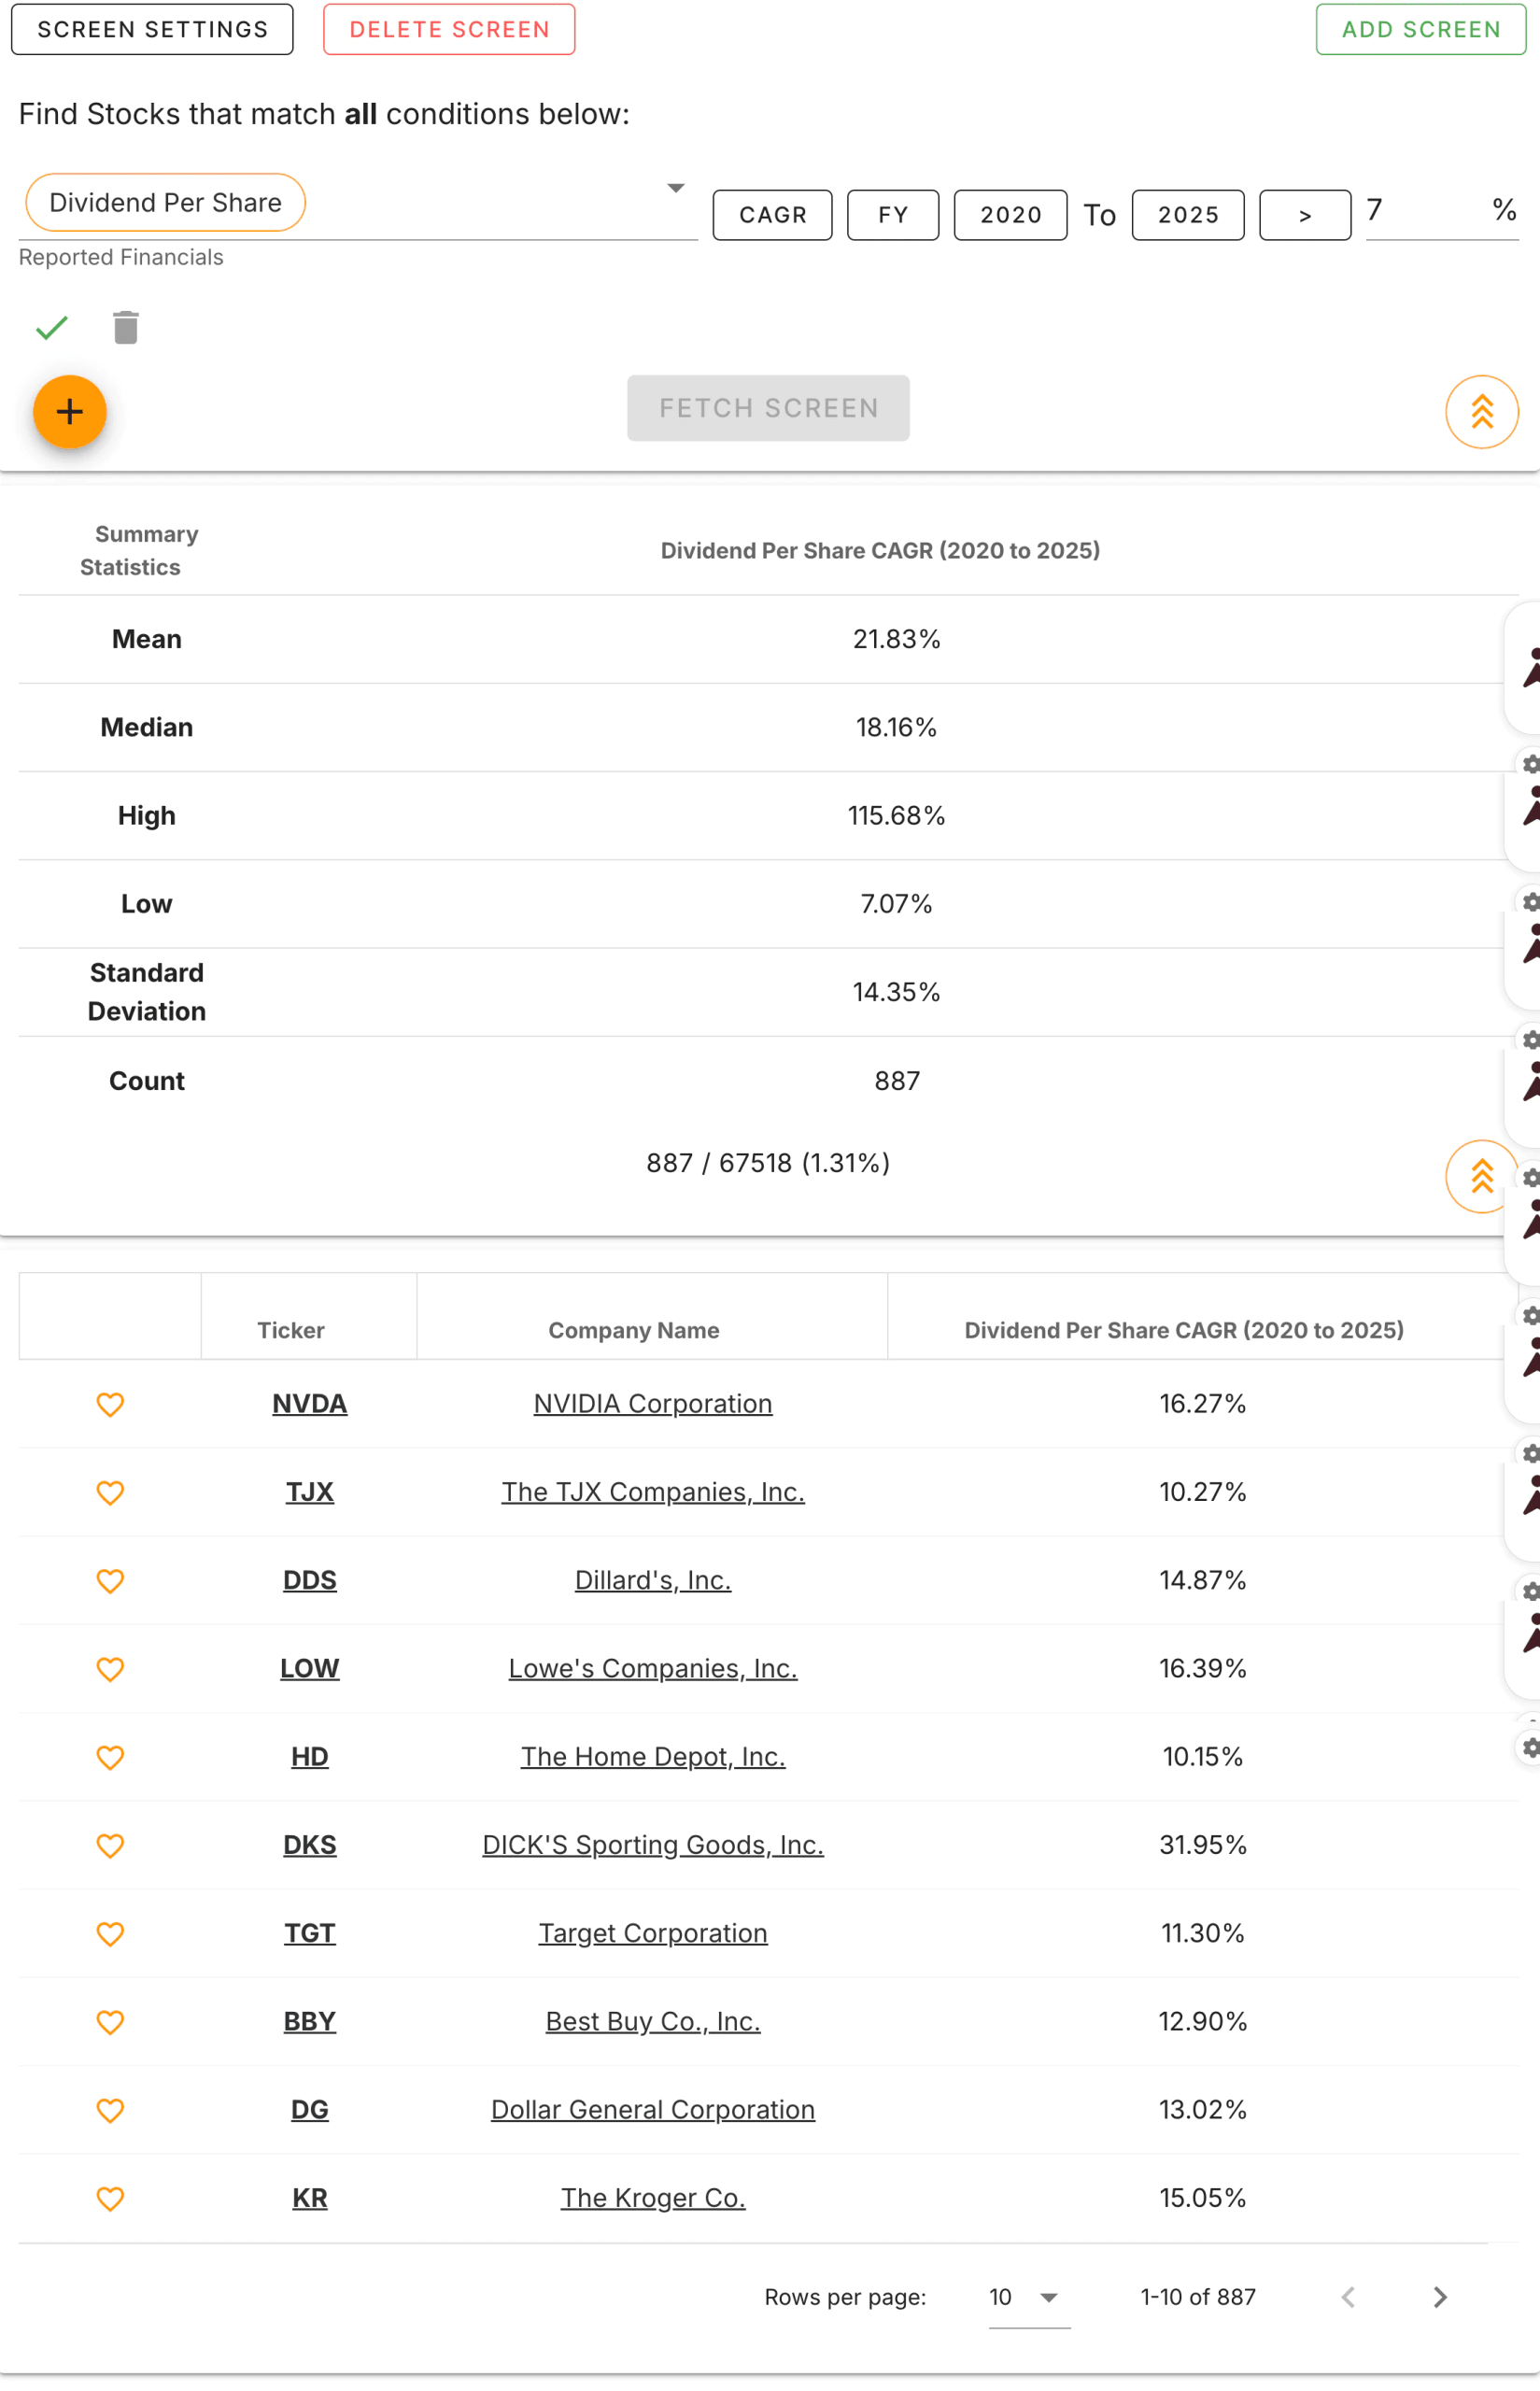
TIKR tip: TIKR’s Global Screener allows you to filter for quality characteristics across over 100,000 global stocks. Building a quality screen is the first step in narrowing the universe to businesses worth your research time.
Screen for high quality stocks in under 60 seconds (Free with TIKR) >>>
Defining Quality Through Financial Metrics
Quality manifests in the financial statements through consistent patterns. No single metric captures every dimension of quality, but a combination of profitability, stability, and financial strength provides a comprehensive picture.
Return on capital measures how efficiently a business generates profits from its investments. Companies with high ROCs typically possess competitive advantages that enable them to extract more value from similar assets than competitors. An ROC consistently above 12% to 15% indicates a business doing something right. Returns above 20% suggest exceptional economics, often stemming from durable moats.
Gross margin reveals pricing power and production efficiency. A company maintaining 40% gross margins commands prices significantly above its direct costs, indicating either differentiated products or structural cost advantages. Gross margins that hold steady over time suggest the pricing power is sustainable rather than temporary.
Operating margin shows how effectively management controls costs beyond production. A business that converts 15% or more of revenue into operating profit demonstrates discipline in allocating resources. Stable operating margins across different economic conditions indicate a business model that works regardless of the environment.
Free cash flow conversion confirms that accounting profits translate to real cash. High-quality businesses typically convert 80% or more of net income to free cash flow because they require limited ongoing capital to maintain operations. A company reporting strong earnings but weak cash flow may be capitalizing expenses, facing working capital pressures, or operating a capital-intensive model that consumes the profits it generates.
Balance sheet strength provides the foundation for everything else. A company with modest debt relative to its cash flows can weather downturns, invest in opportunities, and avoid the dilution or distress that overleveraged competitors face. Net debt to EBITDA below 2x is a reasonable threshold for most industries, though capital-intensive sectors may warrant different standards.
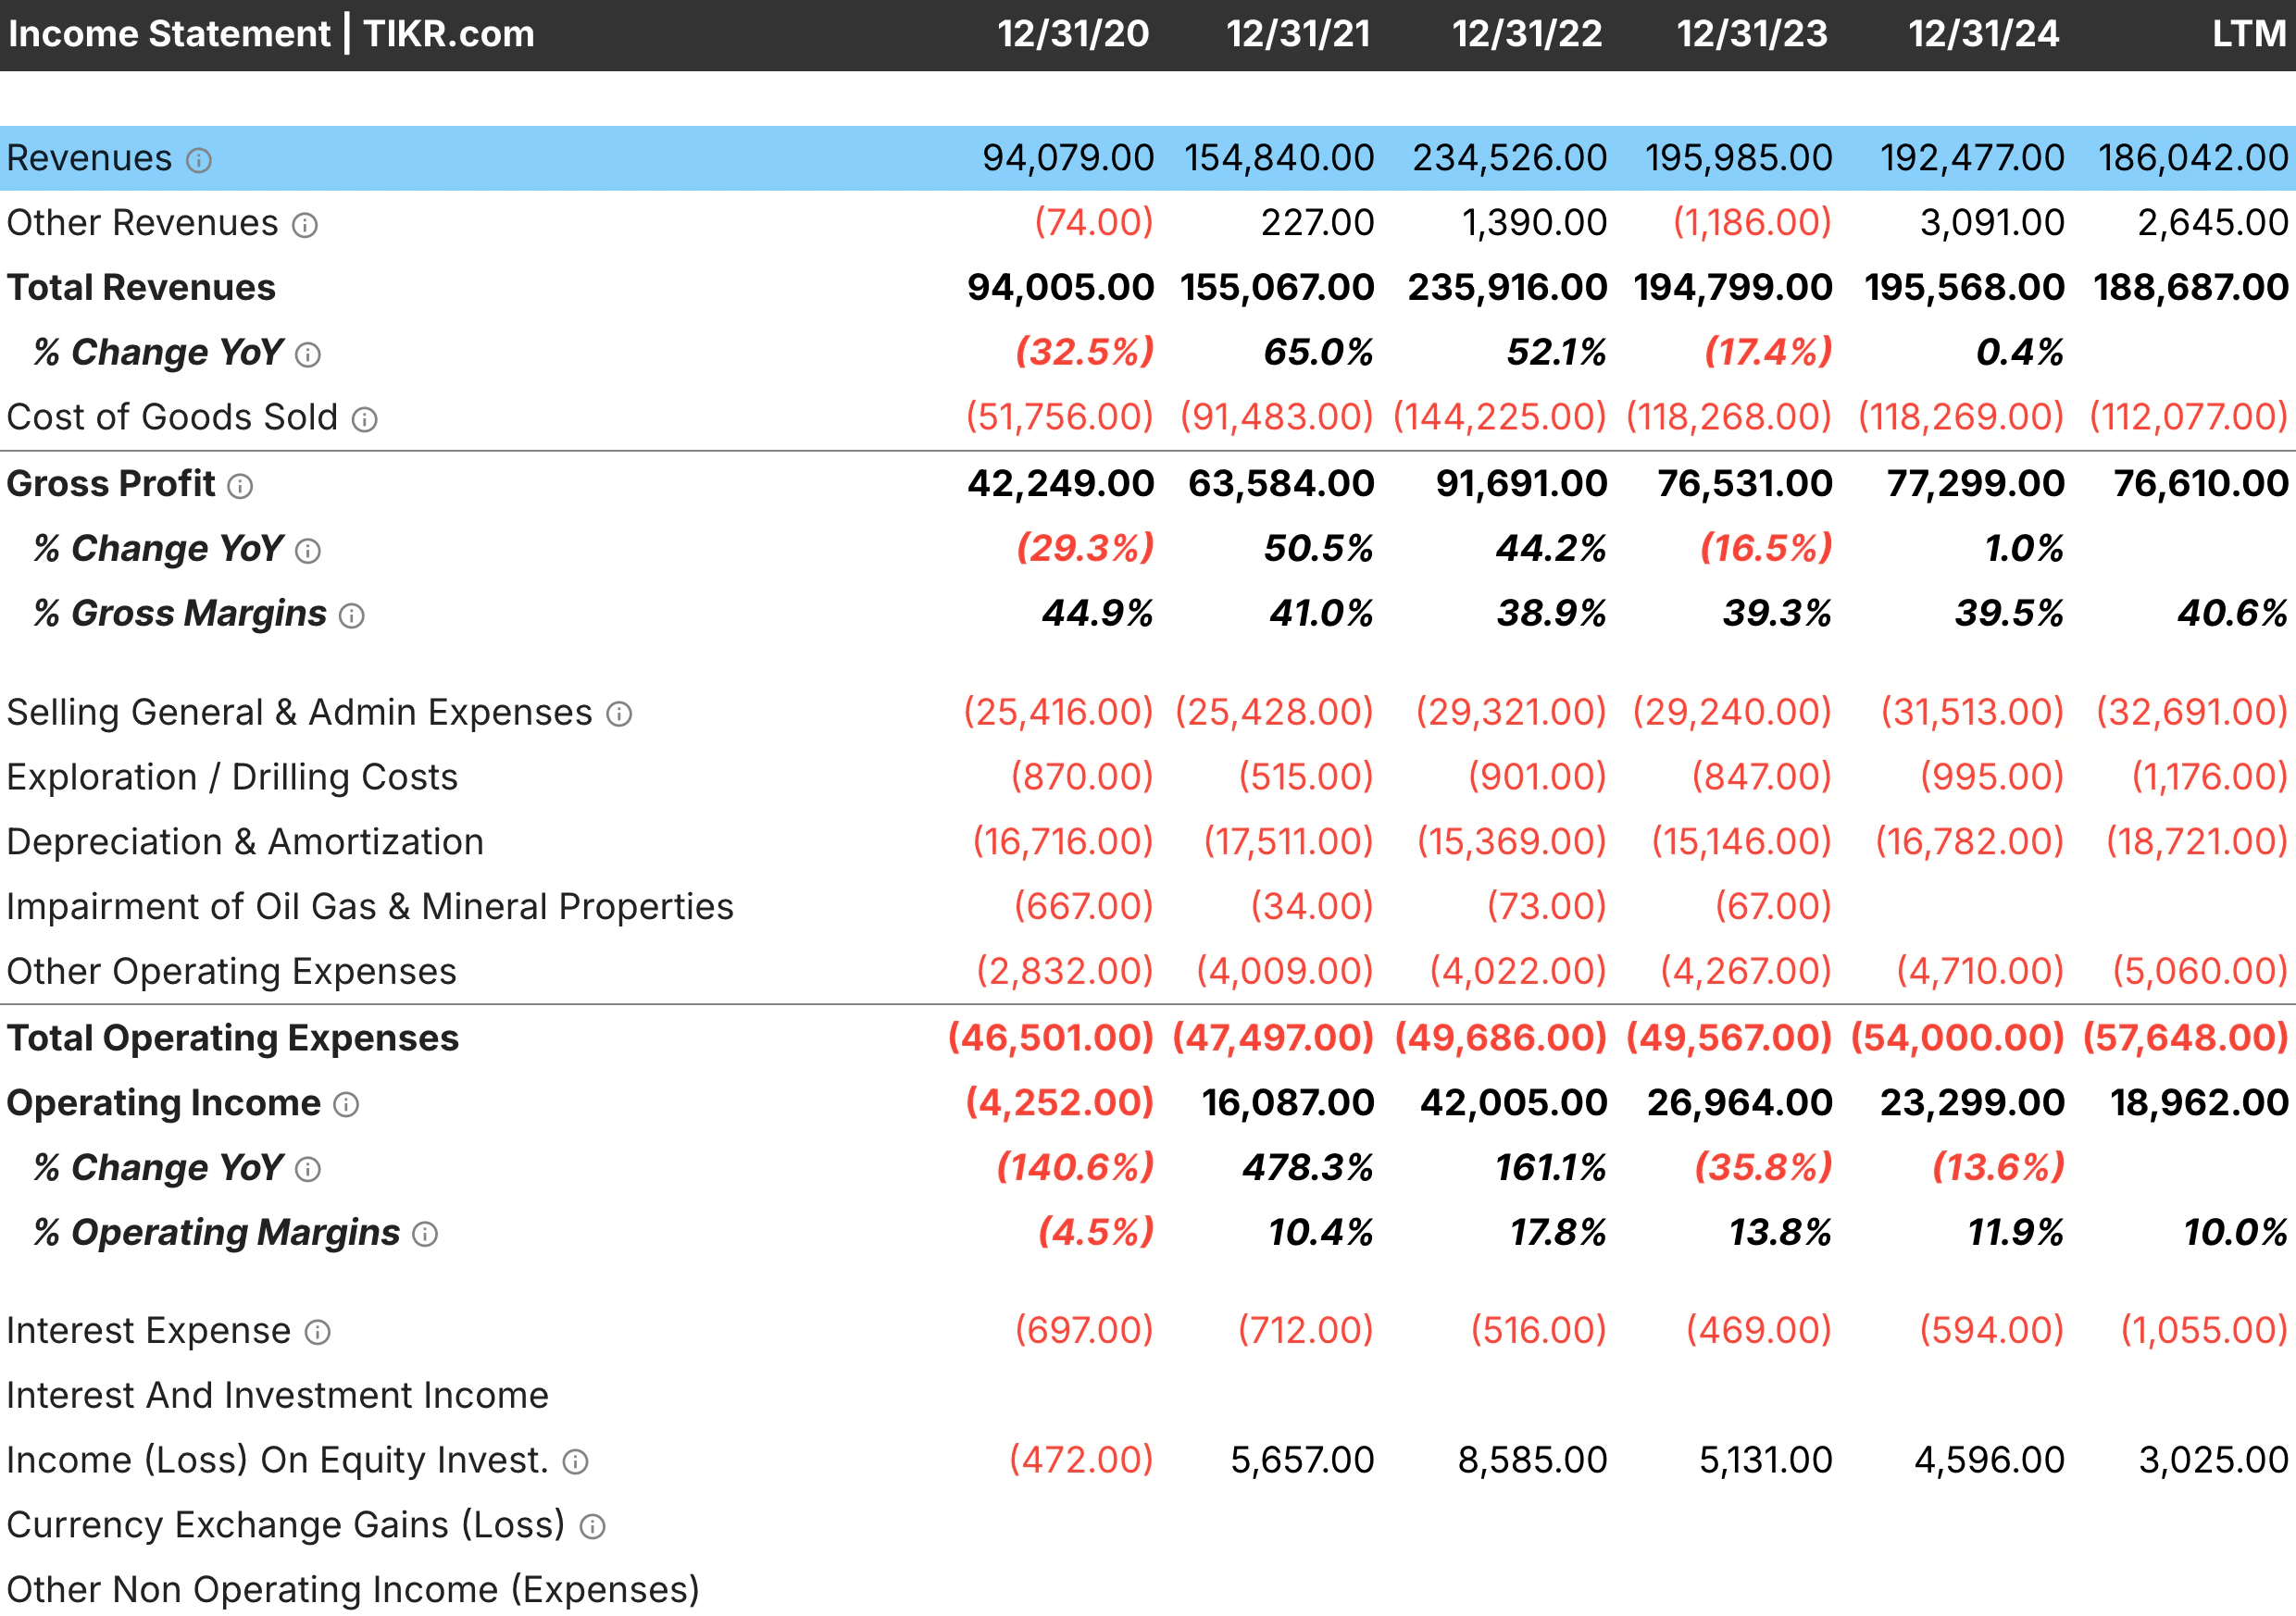
TIKR tip: TIKR’s Detailed Financials display all of these metrics over extended time periods. Review at least five years of history to distinguish consistent quality from temporary outperformance.
Value any stock in less than 60 seconds with TIKR’s new Valuation Model (It’s free) >>>
Stability and Consistency
High-quality businesses deliver predictable results. Their revenue does not swing wildly from year to year. Their margins do not collapse during recessions. Their earnings grow steadily rather than spiking and crashing. This consistency is itself a quality indicator because it suggests competitive advantages that protect performance regardless of external conditions.
Earnings stability deserves particular attention. A company that grows earnings by 10% in good years and shrinks by 5% in bad years has a very different risk profile than one that grows by 40% and contracts by 30%. The first business is predictable and easier to value. The second requires guessing which years represent normal performance. Screens can capture stability by requiring positive earnings in most or all of the past five years or by filtering for low earnings variability.
Revenue consistency matters for similar reasons. A business with steady 8% annual revenue growth is likely gaining market share or operating in a growing end market with sticky customer relationships. A business with annual revenue fluctuations of 20% is likely exposed to cyclical forces or competitive dynamics that make forecasting difficult.
Margin stability indicates pricing power that persists through cycles. If gross margins compress during recessions, the company lacks the ability to maintain prices when demand softens. If operating margins swing with capacity utilization or input costs, the business model is vulnerable. The highest-quality companies maintain their margin structure even when conditions are challenging.
Consistency compounds over time just as returns on capital do. A business that delivers 12% earnings growth over a decade creates more value than one that averages 15% growth but includes several years of decline. The steady performer allows for confident long-term holding, while the volatile one creates anxiety that leads to poorly timed sales.
TIKR tip: Use TIKR’s Estimates tab to view historical results alongside analyst expectations. Companies with track records of meeting or exceeding estimates demonstrate the predictability that characterizes quality.
Build your own screener to find the best stocks to buy today (Free with TIKR) >>>
Building an Effective Quality Screen
An effective screen balances selectivity with practicality. Too few criteria yield an unmanageable list of mediocre businesses. Too many criteria filter out even legitimately high-quality companies. The goal is a list of 30 to 100 stocks that meet a genuine quality threshold and deserve deeper analysis.
A reasonable starting point combines profitability, margins, cash flow, and balance sheet strength. Require ROC above 12% for at least the past three years to ensure profitability is sustained rather than a single-year fluke. Set minimum gross margins around 30% and operating margins around 10%, adjusting based on industry norms. Require positive free cash flow in the most recent years. Limit leverage by requiring net debt-to-EBITDA below 2.5x or 3x.
Adding stability criteria further refines the list. Require positive revenue growth over the trailing three or five years to filter out shrinking businesses. Require positive earnings in at least four of the past five years to eliminate companies with inconsistent profitability. These filters remove cyclical businesses at the wrong point in their cycle and companies facing structural decline.
Geographic and size filters help tailor the screen to your investment approach. If you focus on U.S. large caps, filter accordingly. If you want global exposure, including smaller companies, broaden the criteria. The screen should reflect where you are willing to invest rather than returning opportunities you will never pursue.
Run the screen and review the results critically. If familiar high-quality companies are missing, your criteria may be too strict. If clearly low-quality companies appear, the criteria are too loose. Adjust thresholds iteratively until the output matches your intuitive sense of what belongs on a quality list.

TIKR tip: Save your quality screens in TIKR and run them monthly. Market movements and earnings reports change which companies meet your criteria. A stock that failed the screen last quarter might pass after strong results, and vice versa.
Avoiding Quality Traps
Not every company that passes a quality screen is actually high quality. Certain patterns can make mediocre or declining businesses appear better than they are.
Peak-cycle performance inflates the metrics of cyclical companies. A commodity producer or industrial manufacturer at the top of its cycle will show excellent margins, returns, and cash flow that will deteriorate when the cycle turns. These companies can pass quality screens during good times and fail dramatically when conditions normalize. Understanding where a company sits in its industry cycle helps avoid mistaking temporary strength for structural quality.
Accounting choices affect reported metrics in ways that may not reflect economic reality. A company capitalizing expenses that competitors expense will show higher margins and returns on capital. A company with aggressive revenue recognition will show faster growth. Comparing accounting policies to industry norms helps identify outliers whose quality metrics may be artificially inflated.
Recent improvement requires scrutiny. A company that has raised its ROC from 8% to 14% over three years might be genuinely improving or might be benefiting from temporary factors. Examine what drove the improvement. Operational changes and competitive gains are durable. Favorable commodity prices, one-time cost cuts, or accounting adjustments are not.
Acquisition-driven results can obscure underlying quality. Companies that grow through acquisition often report smoother financials that mask integration challenges and overpayments for deals. Focus on organic performance when possible. If a company has made significant acquisitions, assess whether the core business would pass quality screens on its own.
TIKR tip: Review TIKR’s Detailed Financials for longer time periods to see how current metrics compare to history. A company showing quality metrics today that did not exist five years ago deserves skepticism about whether the improvement will persist.
Screen over 75,000 global stocks with TIKR (It’s free) >>>
From Screen to Research
A quality screen produces candidates, not conclusions. The screen narrows thousands of stocks to a manageable list, but each company on that list requires research before it deserves capital.
Understanding the business model is the first step. Can you explain how the company makes money and what drives its profitability? A business you do not understand is not an investment opportunity, regardless of how attractive the metrics appear. Move to the next candidate if the model is too complex or outside your expertise.
Assessing the source of quality helps determine durability. High margins might stem from proprietary technology, brand strength, switching costs, or temporary supply constraints. The first three are sustainable while the fourth is not. Identifying what creates the quality helps you evaluate whether it will persist.
Valuation determines whether quality is worth the price. A high-quality business at an extreme valuation may still be a poor investment. Compare current multiples to historical ranges and to the quality of the business. A company trading at a premium to its own history needs a reason beyond the metrics you have already screened for.
Competitive dynamics reveal whether quality is strengthening or eroding. A company with stable quality metrics might face new competitors, technological disruption, or customer concentration that threaten future performance. Reading earnings transcripts and industry research helps identify threats that do not yet appear in the financials.

TIKR tip: Use TIKR’s full platform to research screened candidates. Review financials for quality metrics, estimates for growth expectations, ownership for insider activity, and transcripts for management commentary on competitive dynamics.
Run a competitor analysis on TIKR for the top stocks in your portfolio (It’s free) >>>
The TIKR Takeaway
Screening for quality transforms stock selection from an overwhelming task into a systematic process. Instead of evaluating thousands of companies, you define what quality means in measurable terms and let the screen surface businesses that meet your standards.
The best-quality screens combine profitability metrics like ROC with metrics such as margin stability, cash flow conversion, and balance sheet strength. Adding consistency filters removes businesses with volatile results that are difficult to value and risky to own. The output is a focused list of companies that have demonstrated the characteristics associated with long-term outperformance.
TIKR makes quality screening practical by providing data, screening tools, and research capabilities in a single platform. You can build screens using dozens of financial criteria, save them for periodic updates, and research candidates without switching between sources. The result is a workflow that identifies high-quality businesses efficiently and supports the deeper analysis needed to turn screen results into investment decisions.
Quality investing works because high-quality businesses compound value over time while lower-quality ones struggle to maintain performance. Finding them requires defining quality precisely, screening systematically, and researching thoroughly. The effort pays off in a portfolio of businesses built to last.
Find undervalued stocks in less than 60 seconds with TIKR’s new Valuation Model (It’s free) >>>
Value Any Stock in Under 60 Seconds with TIKR
With TIKR’s new Valuation Model tool, you can estimate a stock’s potential share price in under a minute.
All it takes is three simple inputs:
- Revenue Growth
- Operating Margins
- Exit P/E Multiple
If you’re not sure what to enter, TIKR automatically fills in each input using analysts’ consensus estimates, giving you a quick, reliable starting point.
From there, TIKR calculates the potential share price and total returns under Bull, Base, and Bear scenarios so you can quickly see whether a stock looks undervalued or overvalued.
See a stock’s true value in under 60 seconds (Free with TIKR) >>>
Looking for New Opportunities?
- Discover which stocks billionaire investors are purchasing, so you can follow the smart money.
- Analyze stocks in as little as 5 minutes with TIKR’s all-in-one, easy-to-use platform.
- The more rocks you overturn… the more opportunities you’ll uncover. Search 100K+ global stocks, global top investor holdings, and more with TIKR.
Disclaimer:
Please note that the articles on TIKR are not intended to serve as investment or financial advice from TIKR or our content team, nor are they recommendations to buy or sell any stocks. We create our content based on TIKR Terminal’s investment data and analysts’ estimates. Our analysis might not include recent company news or important updates. TIKR has no position in any stocks mentioned. Thank you for reading, and happy investing!


