Key Stats for ISRG Stock
- Past-Month Performance: -14%
- 52-Week Range: $425 to $609
- Valuation Model Target Price: $705
- Implied Upside: 45%
Value your favorite stocks like Intuitive Surgical with 5 years of analysts’ forecasts using TIKR’s new Valuation Model (It’s free) >>>
What Happened?
Intuitive Surgical stock fell about 14% in the last 30 days, recently trading near $486 per share as investors reacted to post-earnings multiple compression, insider selling disclosures, and broader valuation pressure across large-cap growth stocks. Shares pulled back despite solid operating performance, reflecting sentiment and positioning rather than weakening fundamentals.
The stock declined primarily because investors rotated out of high-multiple names after earnings, even though results were strong, leading to valuation compression rather than earnings disappointment. Revenue rose 19% to $2.87 billion, total procedures increased 18%, and pro forma EPS reached $2.53.
CEO Dave Rosa said 2025 was “a strong year for Intuitive,” with full-year revenue climbing 21% to $10.1 billion and da Vinci procedures growing about 18% to more than 3.1 million.
Recurring revenue increased 20% to $2.3 billion in Q4 and represented 81% of total revenue, highlighting the strength of its consumables-driven model.
Institutional positioning has been mixed. DDD Partners increased its stake by 746.8% to 5,504 shares worth about $2.46 million, while Verde Servicos Internacionais boosted its position by 112.5% to roughly $15.07 million.
At the same time, Prospera Financial Services reduced its stake by 65.8%, selling 13,590 shares, and insiders sold 56,189 shares over the past 90 days totaling about $30.8 million, including SVP Mark Brosius’ sale of 4,500 shares for $2.46 million.
Despite the recent decline, institutional investors collectively own about 83.64% of Intuitive Surgical. Management guided 2026 da Vinci procedure growth of 13% to 15% and pro forma gross margin of 67% to 68%, including an expected tariff impact of about 1.2% of net revenue, reinforcing expectations for continued earnings expansion even as shares retraced.

See analysts’ growth forecasts and price targets for Intuitive Surgical (It’s free) >>>
Is Intuitive Surgical Undervalued?
Under valuation assumptions, the stock is modeled using:
- Revenue Growth (CAGR): 13.8%
- Operating Margins: 38.7%
- Exit P/E Multiple: 48.5x
Revenue growth remains supported by expanding procedure volumes across general surgery and international markets, alongside continued adoption of da Vinci 5.
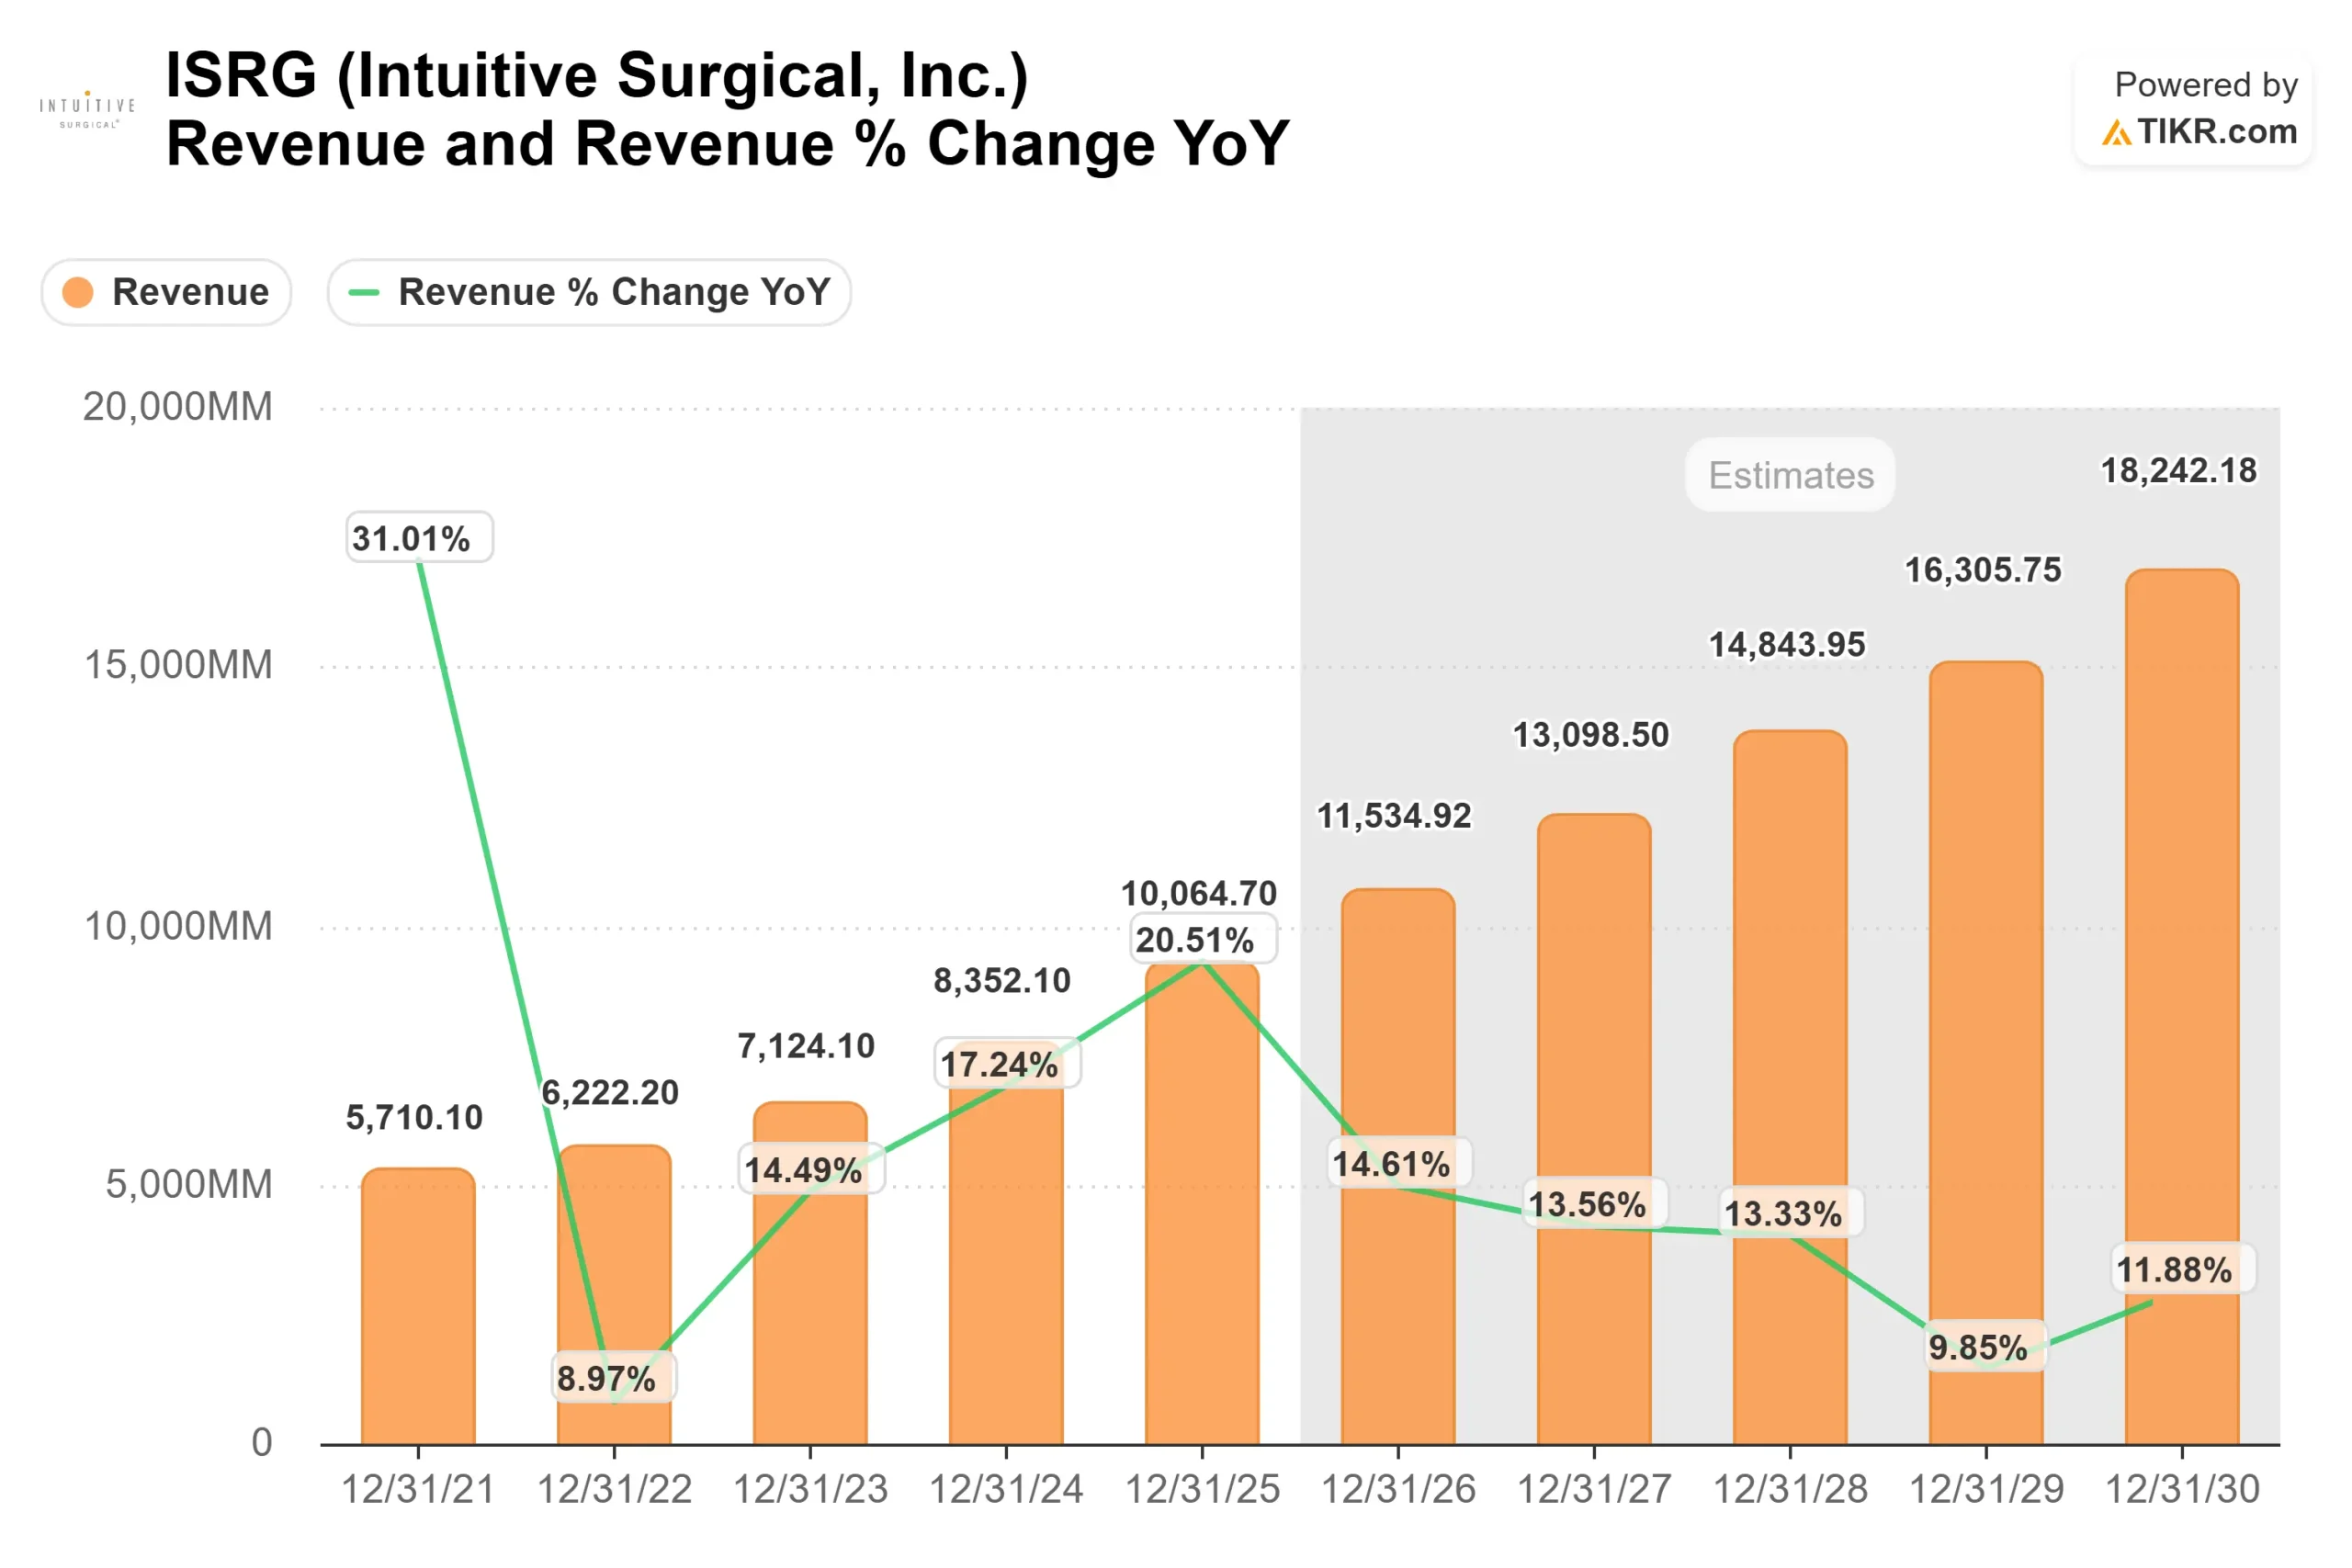
From 2025 revenue of $10,064.70 million, analyst estimates project revenue reaching $14,843.95 million by 2028, consistent with a blended CAGR near 13.8%.
Procedure growth is central because it drives recurring instrument and accessory revenue, which represented 81% of Q4 revenue.
As the installed base expands and utilization increases, incremental revenue scales efficiently and strengthens operating leverage.
Additional growth drivers include expansion into cardiac procedures following FDA clearance on da Vinci 5, continued SP platform momentum with 78% Q4 growth, Ion procedure growth of 44% in Q4, and penetration into ambulatory surgery centers using refurbished XiR systems.
International reimbursement developments, including potential additional robotic coverage in Japan beginning mid-2026, could further support procedure growth outside the U.S.
Based on these inputs, the model estimates a target price of $704.61, implying about 45% total upside from the current price of $485.84.
At current levels near $486, Intuitive Surgical appears undervalued, with future performance driven by durable procedure growth, recurring revenue expansion, international penetration, platform innovation, and sustained operating leverage rather than reliance on system placement cycles alone.
Estimate a company’s fair value instantly (Free with TIKR) >>>
Value Any Stock in Under 60 Seconds (It’s Free)
With TIKR’s new Valuation Model tool, you can estimate a stock’s potential share price in under a minute.
All it takes is three simple inputs:
- Revenue Growth
- Operating Margins
- Exit P/E Multiple
From there, TIKR calculates the potential share price and total returns under Bull, Base, and Bear scenarios so you can quickly see whether a stock looks undervalued or overvalued.
If you’re not sure what to enter, TIKR automatically fills in each input using analysts’ consensus estimates, giving you a quick, reliable starting point.
See a stock’s true value in under 60 seconds (Free with TIKR) >>>