Key Stats for Interactive Brokers Stock
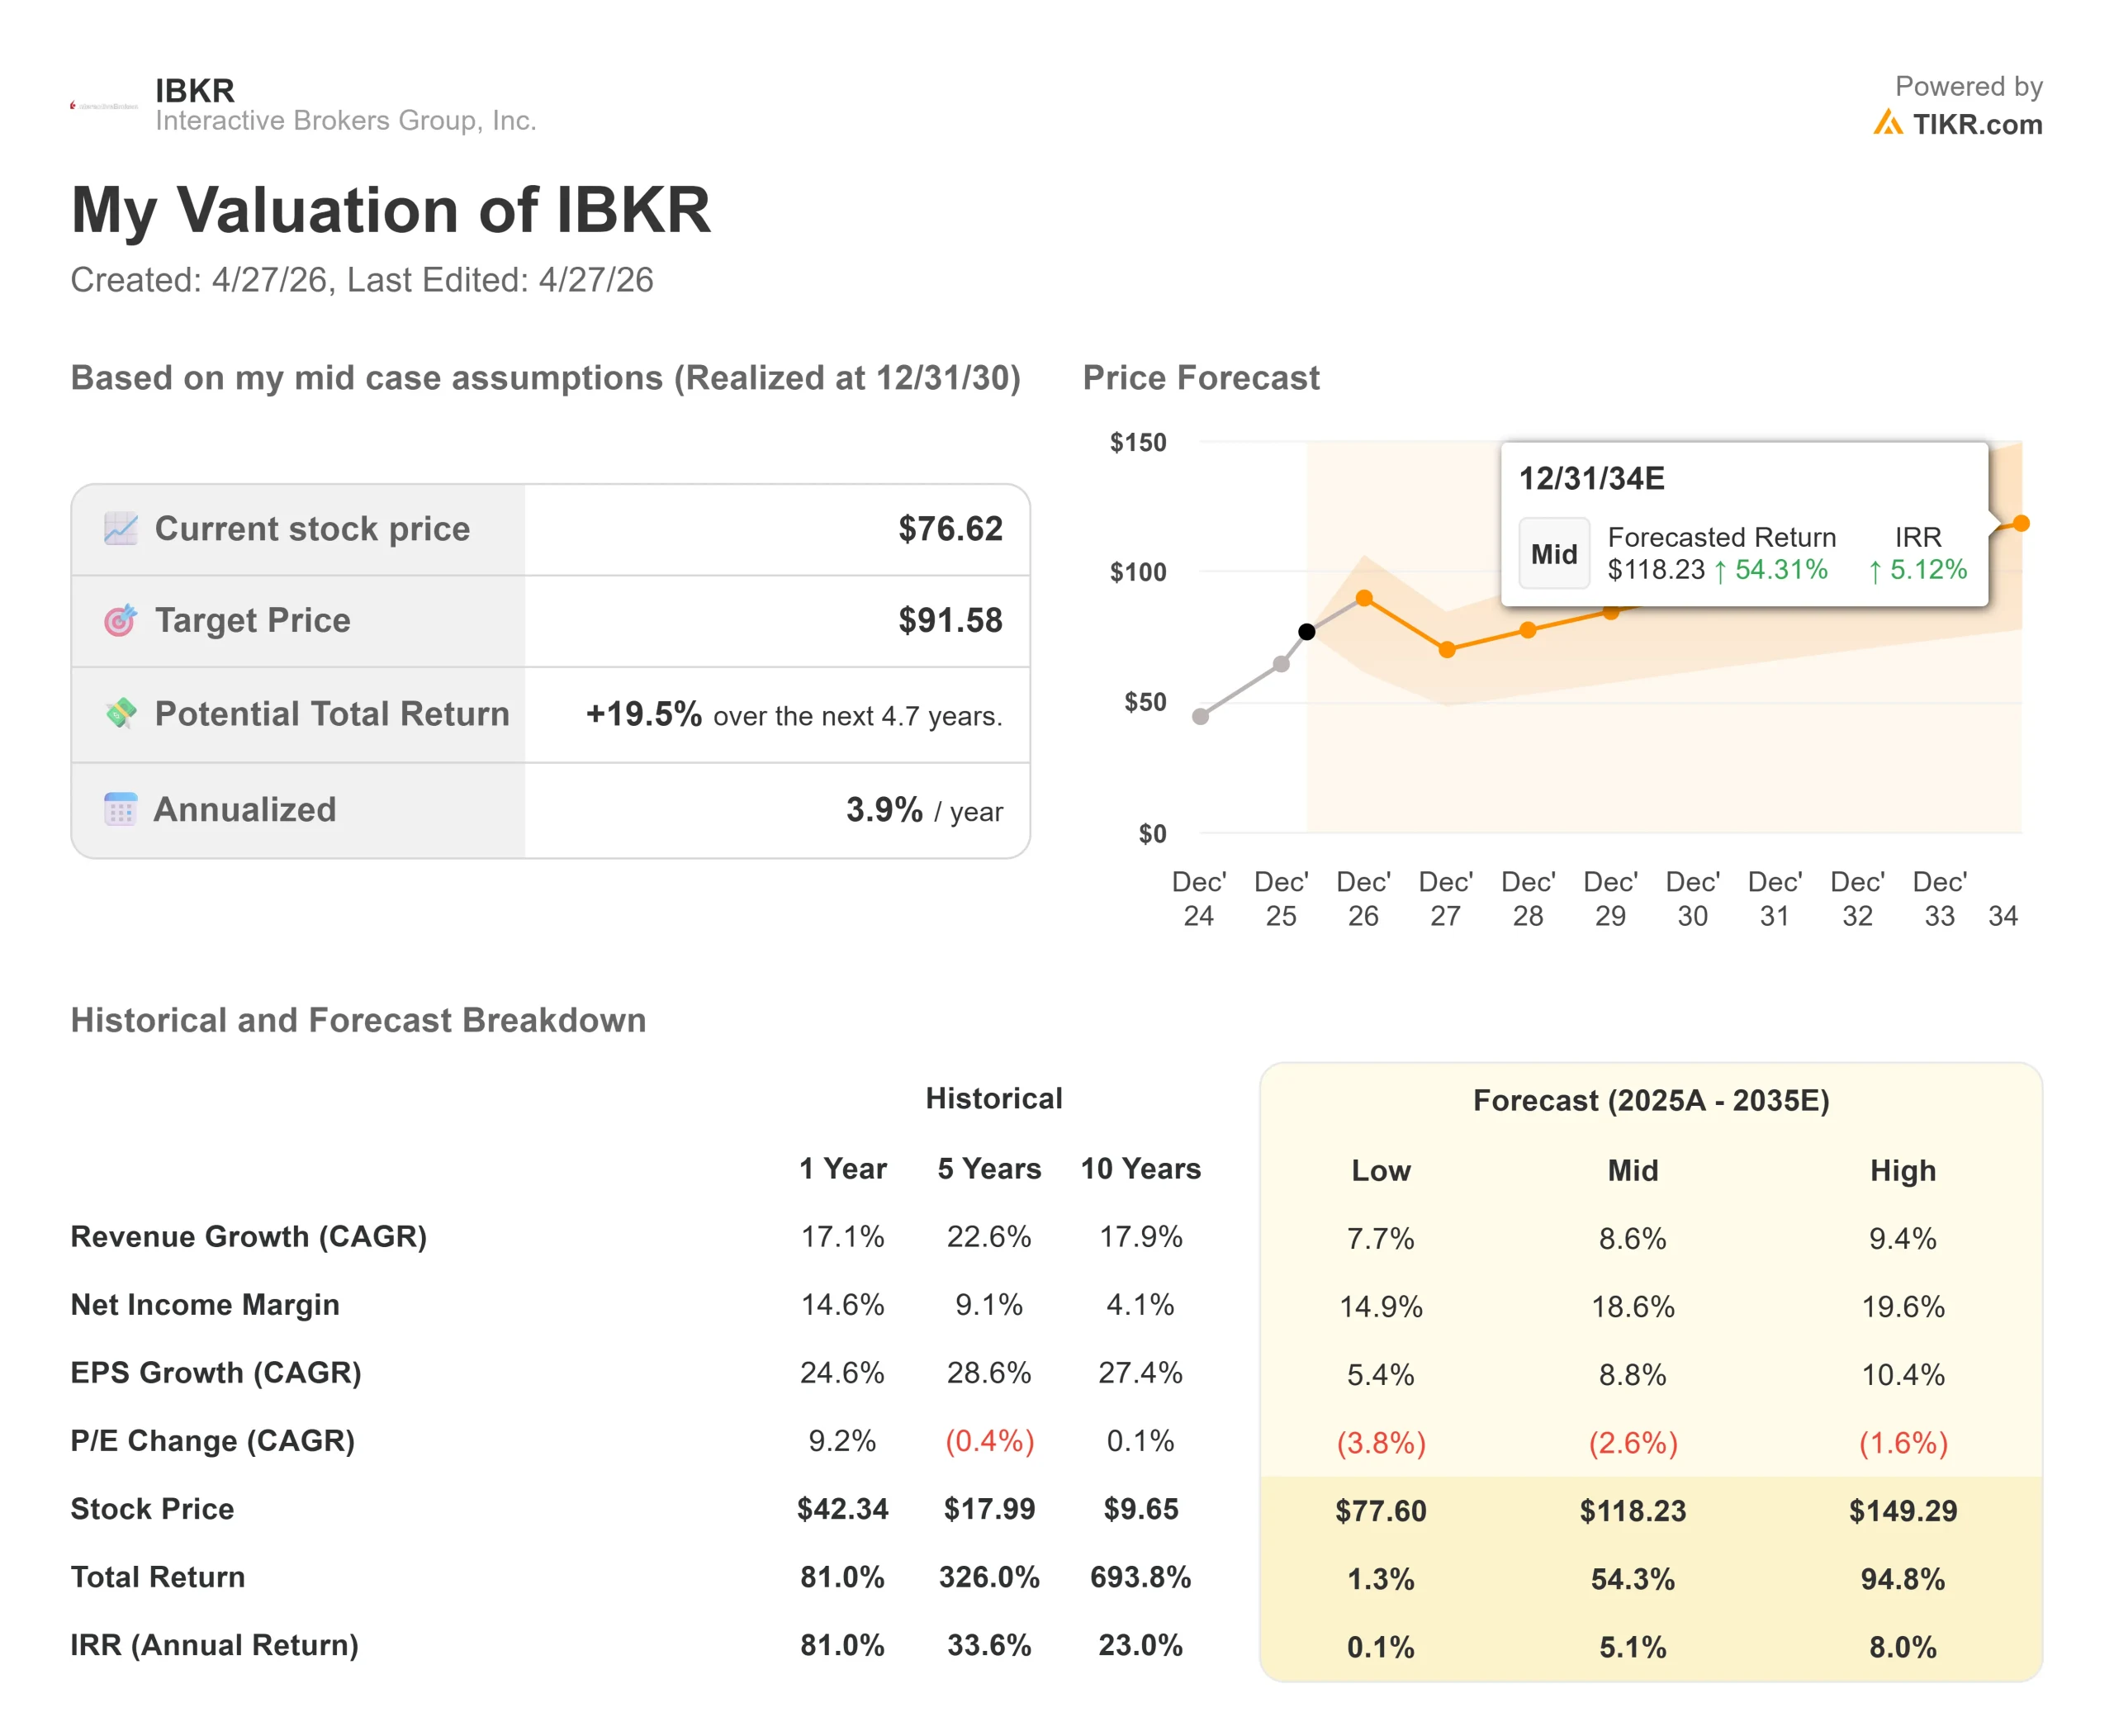
- Current Price: $76.62
- Target Price (Mid Case): ~$92
- Street Target (Mean): ~$86
- Potential Total Return (Mid Case): ~20%
- Annualized IRR (Mid Case): ~4% / year
- Q1 2026 Earnings Reaction: (1.90%) on 4/21/26
Now Live: Discover how much upside your favorite stocks could have using TIKR’s new Valuation Model (It’s free) >>>
What Happened?
Interactive Brokers (IBKR) stock fell nearly 2% on April 21 after Q1 2026 results landed essentially at consensus. The reaction reflects a real tension in the stock.
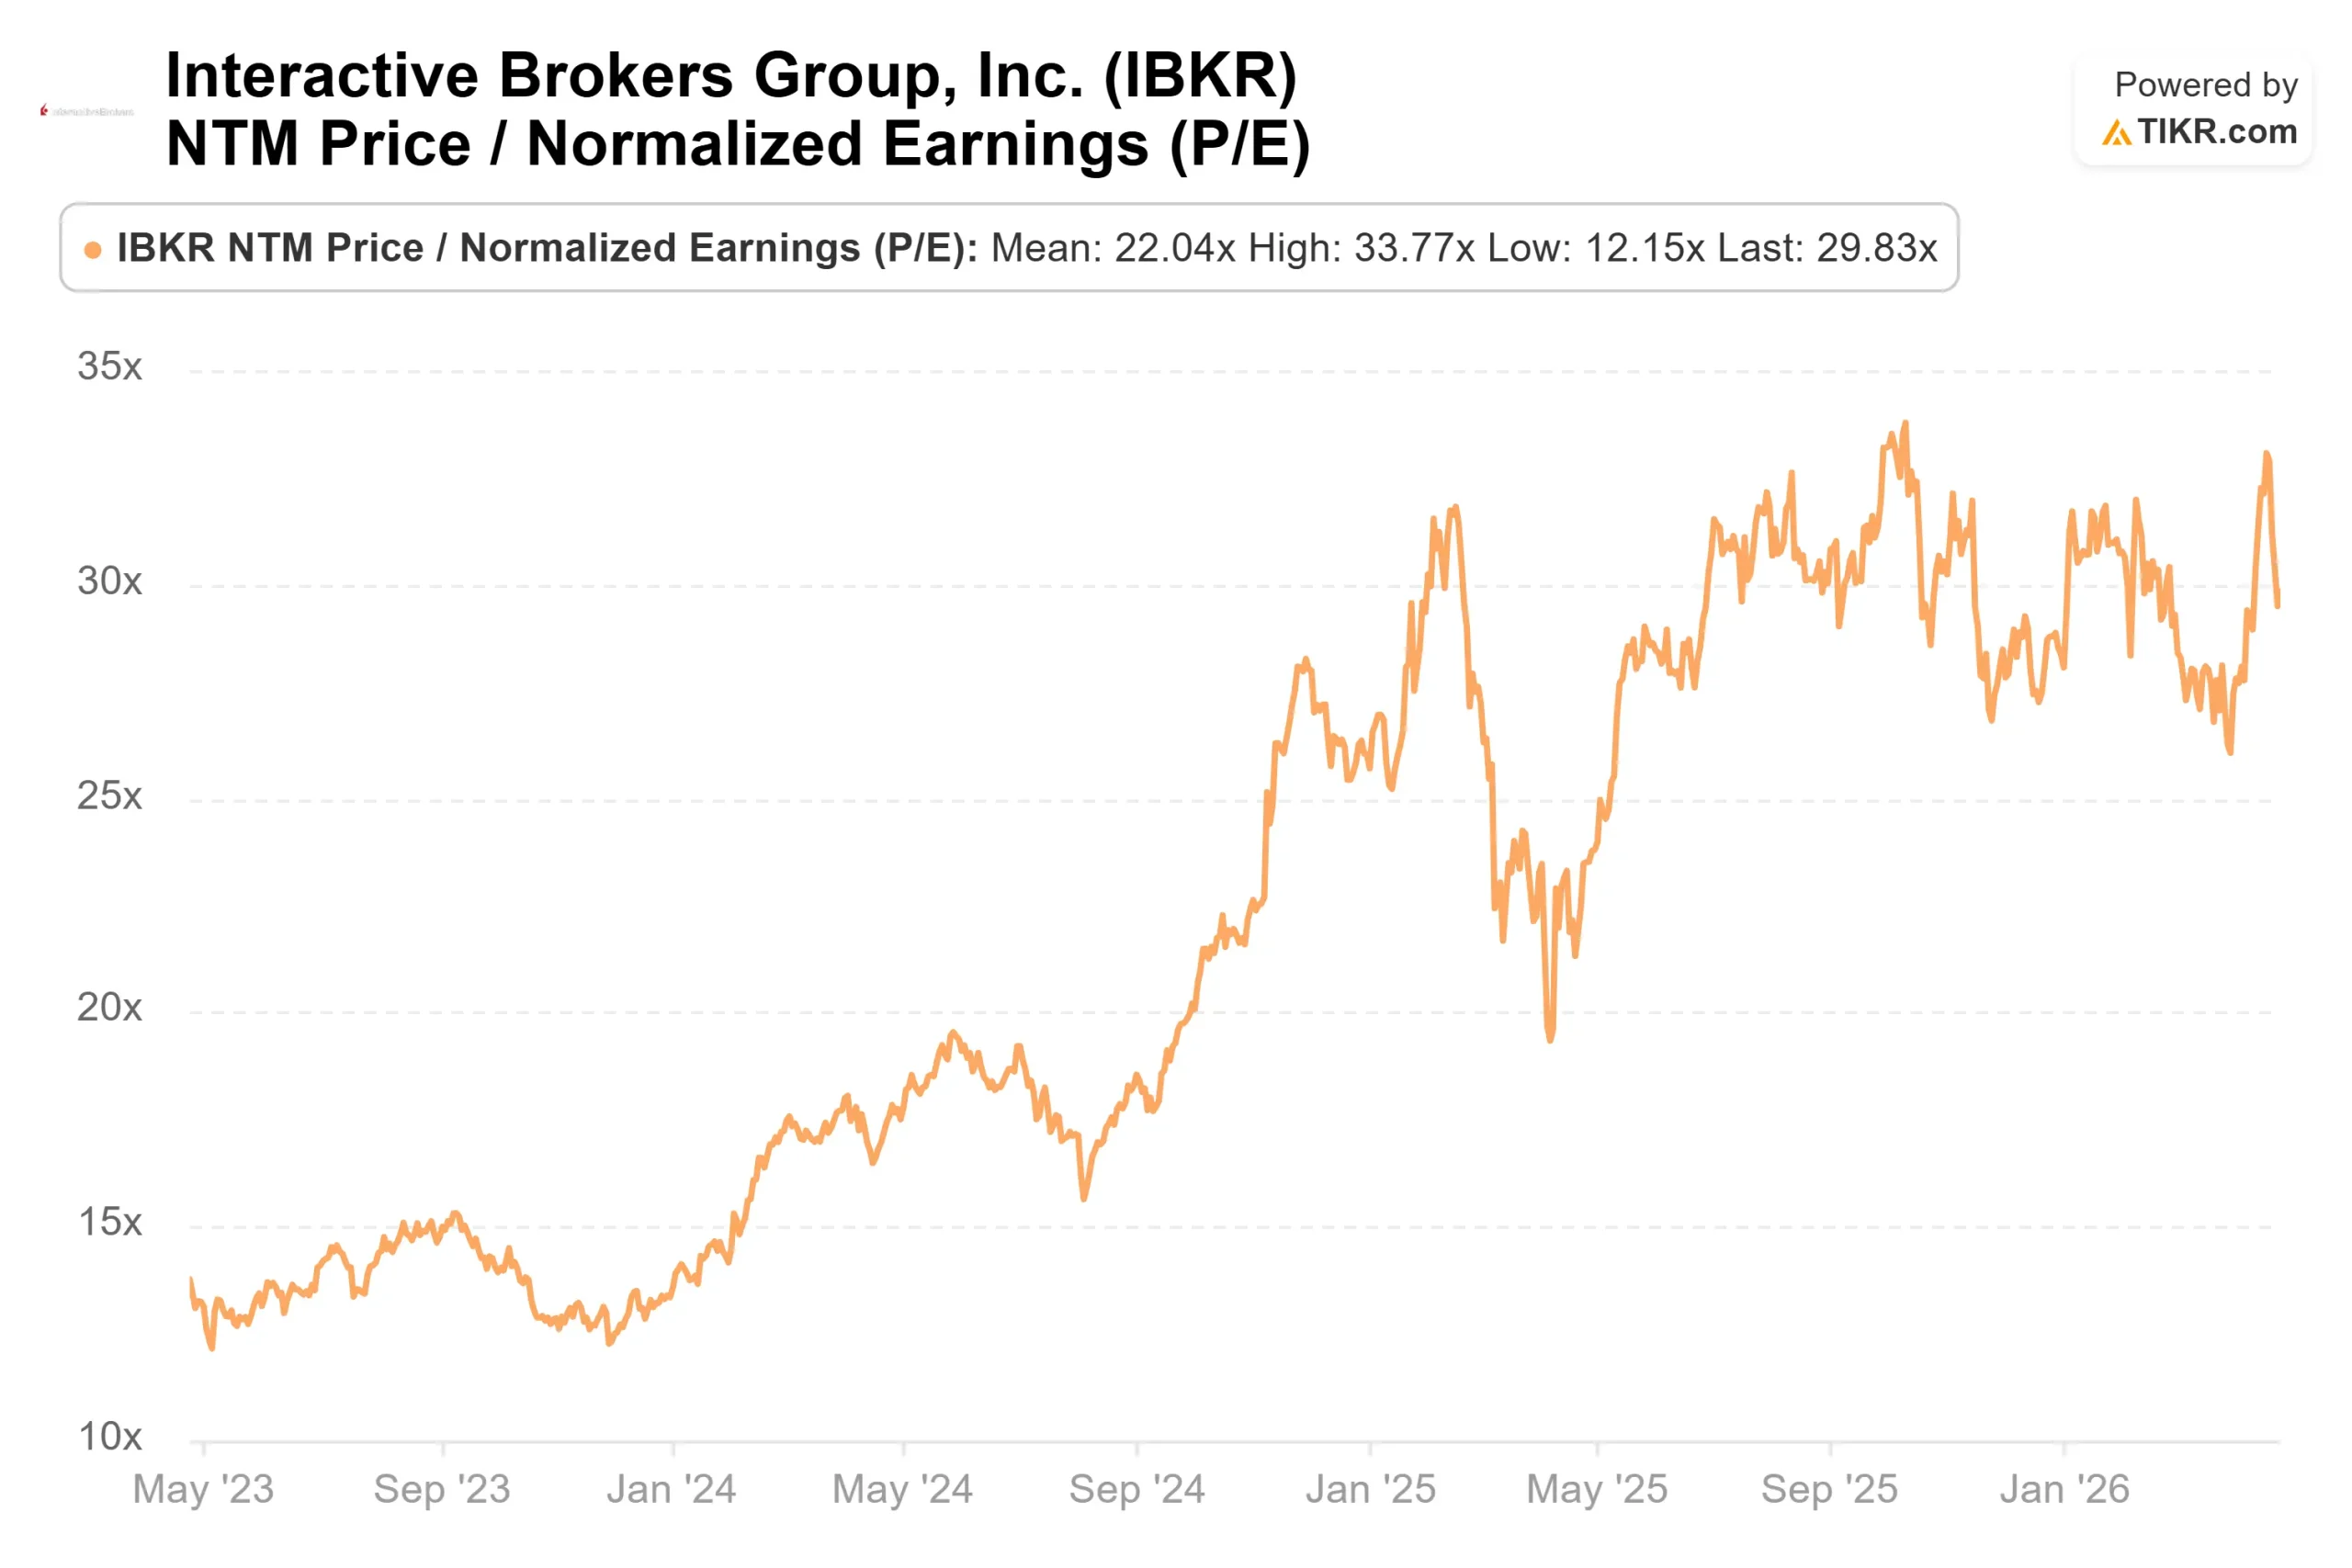
Bulls see a platform with record margins and multiple structural tailwinds still in early innings. Bears see 30x forward earnings on a business where upside surprises have become harder to deliver.
The numbers themselves were strong. Commission revenue crossed $600 million for the first time, up 19% year over year. Net interest income reached $904 million, up 17%. The pretax margin held at 77%, the sixth consecutive quarter above 70%. Revenue of $1,680 million came within $1 million of the consensus estimate of $1,680.80 million, and adjusted EPS of $0.60 matched expectations exactly, per TIKR’s Beats & Misses data. This was not a miss.
Three specific catalysts from the Q1 call have yet to show up in trailing metrics: the SEC’s elimination of the Pattern Day Trader rule, the near-tripling of overnight trading volumes, and growing institutional interest in IBKR’s ForecastEx prediction markets platform. Each was addressed directly by management on the Q1 2026 earnings call.

See historical and forward estimates for Interactive Brokers stock (It’s free!) >>>
Is Interactive Brokers Undervalued Today?
At around 30x NTM earnings, IBKR carries a real premium to peers. Charles Schwab trades at around 14x and Robinhood at around 35x, per TIKR’s Competitors page. IBKR sits between them by multiple, but leads both in margin quality: a 93% LTM gross margin and a 23.6% return on equity. The 10-analyst Street consensus sits at a mean target of around $86, implying roughly 12% upside from current levels, with 6 Buys, 2 Outperforms, 1 Hold, and 1 Underperform.
The three forward catalysts are what the Street mean does not yet fully price in.
The SEC eliminated the Pattern Day Trader rule on April 14, 2026, removing the $25,000 minimum equity requirement that had kept millions of smaller retail traders from day trading freely. CEO Milan Galik welcomed the change on the call, noting that the majority of IBKR’s accounts are individual accounts, many of them smaller, and that they “will be able to trade frequently” under the new framework. More frequent trading from this segment means more commission revenue and more margin activity, the two lines that just hit records.
On overnight trading, management disclosed that volumes nearly tripled year over year in Q1, reaching 8.1 million trades from 2.8 million a year prior. That growth rate is not embedded in consensus estimates and could become a meaningful free cash flow driver as IBKR’s global client base expands.
On ForecastEx, IBKR’s prediction markets exchange, Chairman Thomas Peterffy told analysts that institutions “who have sworn months ago that they will never enter the prediction market” are now inquiring and considering membership. Bernstein analysts projected that prediction market volumes could reach roughly $240 billion in 2026 and approach $1 trillion by 2030. As the exchange operator, IBKR is positioned differently from pure participants.
The rate sensitivity risk is legitimate and worth stating plainly. CFO Paul Brody confirmed on the call that each 25-basis-point Fed rate cut reduces annual net interest income by approximately $82 million. With quarterly net interest income at $904 million, a faster-than-expected cutting cycle would pressure the earnings base supporting the current multiple. That is the real bear case, and it is not trivial.
What limits the bear case is that commission and margin loan growth are largely rate-independent. Futures volumes hit a quarterly record in Q1, up 20%. Margin loans stood at $86.6 billion at quarter-end, per Peterffy’s disclosure. The firm carries no long-term debt, grew firm equity by 22% to $21.3 billion, and raised its dividend from $0.32 to $0.35 per year, all as disclosed in the Q1 earnings release.
See how Interactive Brokers performs against its peers in TIKR (It’s free!) >>>
TIKR Advanced Model Analysis
- Current Price: $76.62
- Target Price (Mid Case): ~$92
- Potential Total Return: ~20%
- Annualized IRR: ~4% / year
See analysts’ growth forecasts and price targets for Interactive Brokers stock (It’s free!) >>>
The TIKR mid case through 12/31/30 assumes a revenue CAGR of around 9% and net income margins of around 19%. The primary revenue drivers are account growth accelerated by the PDT rule change and rising margin loan balances. The margin driver is operating leverage on IBKR’s automated platform, which management confirmed is expanding through AI across onboarding, compliance, and client service.
The resulting ~4% annualized IRR is modest relative to the stock’s current multiple. The upside case requires the three structural catalysts to materialize at scale; the downside is rate compression outpacing commission growth, with the multiple contracting accordingly. Investors looking for a cheap stock will not find it here. Investors looking for a high-quality platform with durable margins and compounding structural tailwinds may find the dip worth examining.
Conclusion
The key metric to watch at Q2 2026 earnings (expected around July 2026) is commission revenue growth. The PDT rule takes effect June 4, 2026, meaning Q2 will be the first quarter capturing its full impact on retail trading frequency. If year-over-year commission growth accelerates beyond Q1’s 19%, the structural thesis gets its first real confirmation. If it doesn’t move, the benefit may be smaller than management’s tone suggested.
IBKR is a quality platform with record margins, no long-term debt, and three growth catalysts in early stages. The mid-case TIKR model points to around 20% total return through 12/31/30. Whether that rises depends on what the next two quarters show.
See what stocks billionaire investors are buying so you can follow the smart money with TIKR.
Should You Invest in Interactive Brokers?
The only way to really know is to look at the numbers yourself. TIKR gives you free access to the same institutional-quality financial data that professional analysts use to answer exactly that question.
Pull up Interactive Brokers, and you’ll see years of historical financials, what Wall Street analysts expect for revenue and earnings in the quarters ahead, how valuation multiples have moved over time, and whether price targets are trending up or down.
You can build a free watchlist to track Interactive Brokers alongside every other stock on your radar. No credit card required. Just the data you need to decide for yourself.
Analyze Interactive Brokers on TIKR Free →
Looking for New Opportunities?
- See what stocks billionaire investors are buying so you can follow the smart money.
- Analyze stocks in as little as 5 minutes with TIKR’s all-in-one, easy-to-use platform.
- The more rocks you overturn… the more opportunities you’ll uncover. Search 100K+ global stocks, global top investor holdings, and more with TIKR.
Disclaimer:
Please note that the articles on TIKR are not intended to serve as investment or financial advice from TIKR or our content team, nor are they recommendations to buy or sell any stocks. We create our content based on TIKR Terminal’s investment data and analysts’ estimates. Our analysis might not include recent company news or important updates. TIKR has no position in any stocks mentioned. Thank you for reading, and happy investing!