Key Stats for AMD & INTC Stock
- AMD Revenue (2025): about $35 billion
- Intel Revenue (2025): about $53 billion
- AMD Forward P/E: about 52x
- Intel Forward P/E: about 127x (reflecting low current earnings rather than underlying valuation)
- AMD EV/EBITDA: about 49x
- Intel EV/EBITDA: about 22x
- AMD Valuation Model Upside: about 84%
- Intel Valuation Model Upside: about 116%
Analyze your favorite stocks like AMD & Intel with TIKR (It’s free) >>>
The Core Difference: Design vs. Manufacturing
The competitive dynamic between AMD and Intel comes down to how each company is built.
Advanced Micro Devices designs CPUs and GPUs used in data centers, PCs, and gaming, but outsources manufacturing to Taiwan Semiconductor Manufacturing Company. That model allows AMD to stay asset-light, avoid heavy capital spending, and quickly adopt the most advanced manufacturing processes available.
Intel, by contrast, designs and manufactures its own chips. This vertical integration once gave Intel a major edge in performance and scale. Today, it is a source of pressure.
Intel is now investing heavily to rebuild its manufacturing leadership and compete directly with global foundries. That requires significant capital spending, which is weighing on margins and pushing out the timeline for a full recovery.
The difference is not just operational. It shapes how each company grows.
AMD can focus on product execution and market share gains without carrying the burden of manufacturing costs. Intel must improve its products while also fixing its cost structure and scaling a capital-intensive foundry business.
So the setup looks like this:
- AMD is leveraging a flexible model to extend its lead through faster product cycles and consistent execution
- Intel is attempting to rebuild its advantage while playing catch-up
Execution Is Driving the Gap
Over the past several years, AMD has grown revenue from about $16 billion to around $35 billion, driven by steady share gains in servers and high-performance computing. Gross margins have held near 52%, which shows the company is scaling while maintaining pricing power.

Intel has moved in the opposite direction. Revenue has declined from roughly $79 billion to about $53 billion, reflecting share losses across PCs and data centers. Gross margins have dropped from about 55% to around 37%, as the company absorbs higher costs tied to its manufacturing rebuild and competitive pressure.
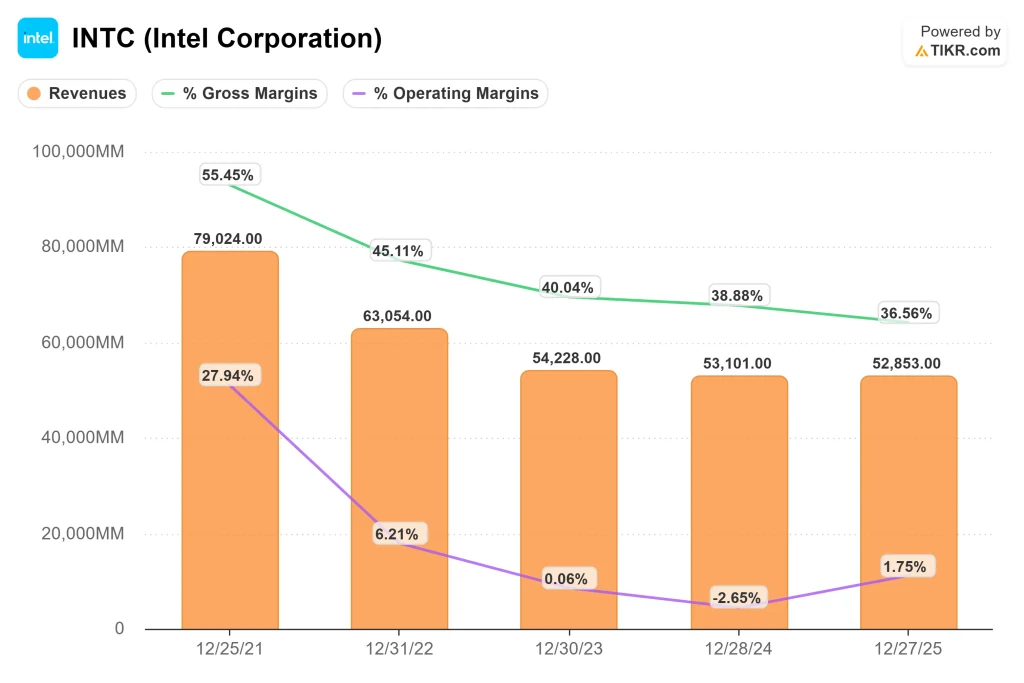
This is not just a normal cycle.
AMD is gaining share while maintaining profitability. Intel is seeing both growth and margins compress at the same time, which points to a deeper structural reset.
That divergence is what matters.
AMD is scaling with momentum and improving economics.
Intel is still rebuilding its cost structure and working to stabilize its core business.
Spending More Doesn’t Mean Executing Better
Intel spends significantly more on research and development in absolute terms, reflecting the cost of supporting both chip design and advanced manufacturing.
While Intel spends more in absolute dollars, a meaningful portion of that investment is tied to manufacturing infrastructure. AMD’s R&D is more concentrated on chip design, which allows a higher percentage of its spending to directly support product performance and competitive positioning in high-growth segments like data centers and AI.
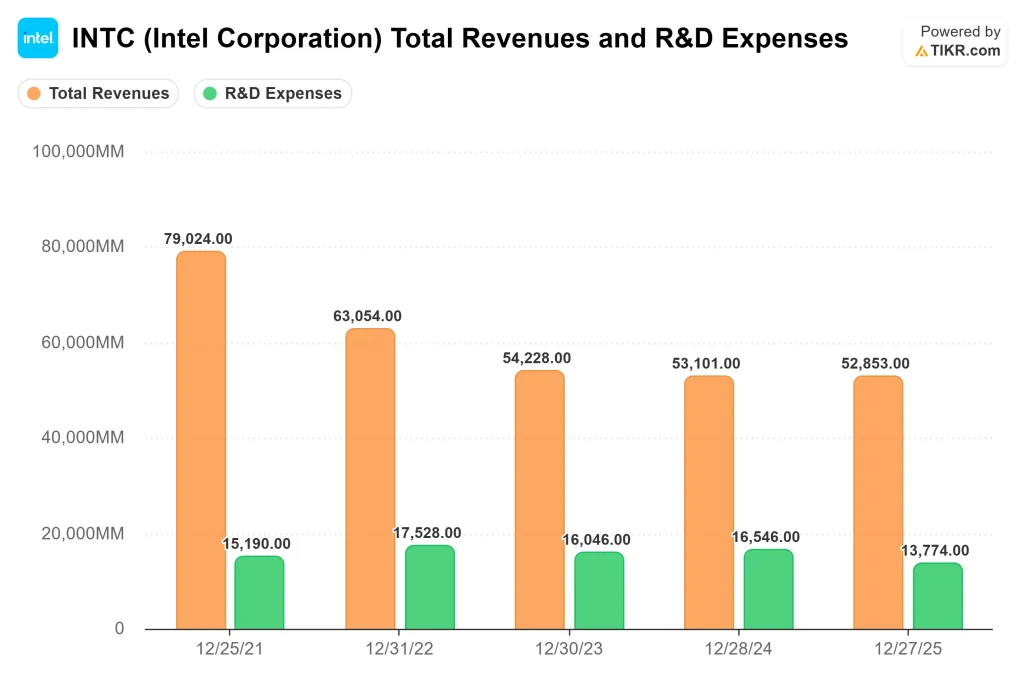
Despite that scale, the returns have been inconsistent in recent years. Revenue has declined while margins have compressed, which suggests that higher spending alone has not translated into stronger competitive positioning.
This highlights not just a difference in spending, but a difference in capital efficiency, which ultimately drives long-term returns.
AMD takes a different approach.

By outsourcing manufacturing, AMD can focus its R&D investment on chip design and architecture. That allows the company to operate with a smaller budget while still delivering competitive products and gaining share in key markets.
The difference is not just how much each company spends, but how effectively that capital is deployed.
Intel’s spending is necessary, but it introduces execution risk because returns depend on rebuilding both technology leadership and cost structure at the same time.
AMD’s approach is more direct. Its R&D is translating into competitive products today, which is why the company has been able to convert investment into share gains and margin stability.
Valuation Reflects Execution, Not Just Growth
AMD trades at about 52x forward earnings, reflecting both strong growth and high confidence in continued execution. That multiple is supported by a business already delivering consistent results across high-value segments like data centers and AI.

Intel’s forward P/E sits around 127x, which appears elevated but is largely a reflection of depressed earnings rather than true valuation. In other words, the multiple says more about where Intel is in its cycle than how the market is pricing the business.

EV/EBITDA provides a clearer comparison:
- AMD: about 49x
- Intel: about 22x
This is where the market’s expectations show up.
Investors are paying up for AMD because its growth is already visible and supported by solid margins. Intel trades at a lower multiple because its earnings recovery is still uncertain and tied to a multi-year turnaround.
The difference comes down to confidence.
AMD is valued on what it is already delivering.
Intel is valued on what it needs to prove.
Value Advanced Micro Devices or Intel instantly (Free with TIKR) >>>
Recovery vs. Momentum
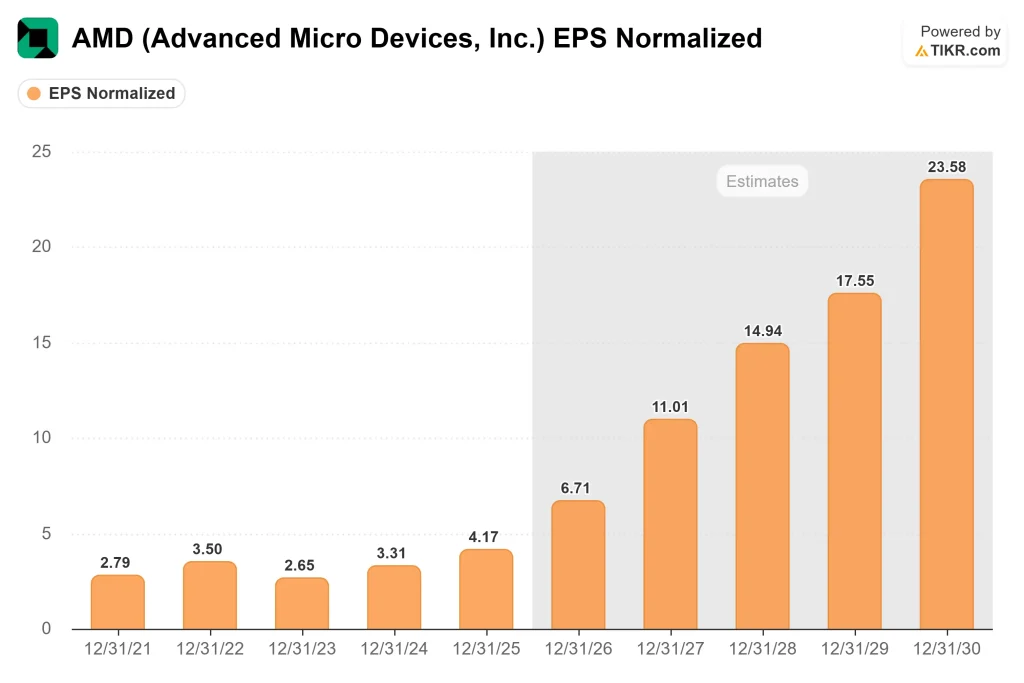
Consensus estimates point to two very different earnings profiles.
AMD’s normalized EPS is expected to grow from about $4 in 2025 to around $11 by 2027, driven by continued share gains in data centers and sustained demand for AI infrastructure. Importantly, that growth builds on a business that is already operating with healthy margins, so incremental revenue is translating into real earnings expansion.
Intel’s path is more dependent on recovery. Earnings are expected to rise from about $0.40 in 2025 to around $1.50 in 2027, and closer to $2 by 2028, as margins gradually improve. In other words, a large portion of Intel’s earnings growth is coming from fixing what is currently under-earning, rather than from strong underlying growth.

That distinction is critical for how the market values each company.
AMD’s earnings growth is driven by momentum and execution, which tends to be more durable.
Intel’s earnings growth is driven by normalization, which depends on whether the turnaround actually delivers.
The growth rates may appear similar at a glance, but they carry very different levels of risk and visibility.
See analysts’ growth forecasts and price targets for AMD or Intel (It’s free) >>>
Why Normalized Earnings Matter for Intel
Intel’s current earnings understate the company’s long-term earning power.
Margins are compressed as the company absorbs heavy spending tied to its manufacturing rebuild, including higher capital intensity and start-up costs for new fabs. These investments are necessary to restore competitiveness, but they are temporarily weighing on profitability.
As a result, today’s earnings reflect a business in transition, not a steady-state level of profitability.
This is why relying on near-term P/E can be misleading.
The more relevant question is what Intel’s earnings could look like once utilization improves, costs normalize, and margins move closer to historical levels. Even modest recovery in operating margins can drive a disproportionate increase in earnings, given the company’s scale.
That is where the upside comes from.
Intel is not being valued on what it earns today, but on how much of its historical profitability it can regain over time.
This is why normalized earnings, rather than near-term results, provide a clearer framework for evaluating Intel’s long-term value.
See what analysts think about Intel stock right now (Free with TIKR) >>>
Upside Comes from Different Drivers
TIKR’s valuation models point to two very different ways each stock could generate returns.
Intel’s model suggests a target price of about $178, implying roughly 116% upside. That outcome depends on margins recovering as manufacturing investments begin to scale and costs normalize. In this case, most of the return comes from earnings expansion rather than strong revenue growth.

AMD’s model points to a target price near $638, or about 84% upside, driven by continued revenue growth in data centers and AI, along with gradual margin expansion as the business scales.

The difference is not just in the upside. It is in how that upside is achieved.
AMD’s return profile is tied to extending an existing growth engine, where execution has already been proven.
Intel’s return profile is tied to restoring profitability, where success depends on whether the turnaround delivers as expected.
That distinction shapes the risk.
AMD needs to sustain execution to justify its premium valuation, while Intel needs to prove its recovery to unlock its upside potential.
Intel needs meaningful improvement to close the gap between current earnings and its long-term potential.
Build your own Valuation Model to value any stock (It’s free!) >>>
Final Takeaway
AMD is the clear execution leader today. It is growing, gaining share, and maintaining strong margins, which gives investors a high degree of visibility into future earnings. That consistency is why the stock trades at a premium.
Intel is in a different position. The company is still rebuilding its cost structure and manufacturing base, which creates more uncertainty in the near term, but also opens the door for meaningful upside if margins recover.
For investors, the trade-off is not just about growth. It is about what is already priced in.
AMD offers a more predictable path, but much of that strength is already reflected in its valuation, leaving less room for disappointment.
Intel offers more upside potential, but that upside depends on execution, and the timeline remains uncertain.
The next phase of the chip war will not be decided by who pulled ahead in the last cycle.
It will be decided by who converts strategy into earnings from here.
The real question is not which company is better today, but which one can close the gap between expectations and reality more effectively over the next few years.
How Much Upside Do AMD and Intel Stocks Have From Here?
Investors can estimate Advanced Micro Devices and Intel potential share price, or what any stock could be worth, in under a minute using TIKR’s New Valuation Model tool.
All it takes is three simple inputs:
- Revenue Growth
- Operating Margins
- Exit P/E Multiple
From there, TIKR calculates the potential share price and total returns under Bull, Base, and Bear scenarios so you can quickly see whether a stock looks undervalued or overvalued.
If you’re not sure what to enter, TIKR automatically fills in each input using analysts’ consensus estimates, giving you a quick, reliable starting point.
Value AMD or Intel in under 60 seconds with TIKR (It’s free) >>>