
Key Stats
- Current price: $121
- Q4 revenue: $10.9B, +5.9% YoY
- Q4 EPS: $1.93, +122% YoY
- Q4 same-store sales growth: +4.3%
- FY2026 net sales growth guidance: 3.7%–4.2%
- FY2026 same-store sales guidance: 2.2%–2.7%
- FY2026 EPS guidance: $7.10–$7.35
- TIKR model price target: ~$202 (mid case)
- Implied upside over ~5 years: ~67%
Dollar General Stock Q4 Earnings Breakdown

Dollar General stock (DG) delivered Q4 net sales of $10.9B, up 5.9% from $10.3B in the prior-year fourth quarter, with EPS of $1.93 representing a 122% increase year over year.
The prior-year Q4 EPS included approximately $0.81 per share of impairment charges, which suppresses the headline rate; on an underlying basis, EPS growth was approximately 15%.
Same-store sales rose 4.3%, driven by growth in both customer traffic and basket size, marking the fourth consecutive quarter of broad-based category growth across consumables, seasonal, home, and apparel.
Nonconsumable sales outpaced consumables for the fourth straight quarter, significant given its implications for gross margin mix over time.
The $1 Value Valley offering posted a comp sales increase of 17.6% in Q4, according to CEO Todd Vasos on the Q4 earnings call, outperforming the chain average for consecutive quarters.
Delivery contributed approximately 80 basis points to the 4.3% comp, with orders fulfilled across approximately 18,000 stores and more than 80% delivered within one hour, according to Vasos; the DG Media Network generated approximately $170M in retail media volume in fiscal 2025, according to Lau.
For fiscal 2026, management guided net sales growth of 3.7%–4.2%, same-store sales growth of 2.2%–2.7%, and EPS of $7.10–$7.35.
The EPS guidance embeds an approximate $0.13 headwind from the expiration of the Work Opportunity Tax Credit at year-end 2025, according to CFO Donny Lau on the Q4 earnings call.
Q1 2026 comp sales are expected in the low 2% range, weighed down by approximately two weeks of February storm disruptions that temporarily closed stores.
Dollar General Stock Financials
The Q4 income statement shows Dollar General stock in clear margin recovery, with operating profitability expanding off the compressed levels seen throughout fiscal 2024.

Gross margin came in at 30.4%, up from 29.6% in the prior-year fourth quarter, driven by a 62 basis point shrink improvement, higher inventory markups, and lower damages, partially offset by a 32 basis point LIFO headwind, according to Lau.
Across eight quarters, gross margin troughed at 28.8% in November 2024, recovered to 31.3% by August 2025, dipped to 29.9% in October 2025, and returned to 30.4% in January 2026.
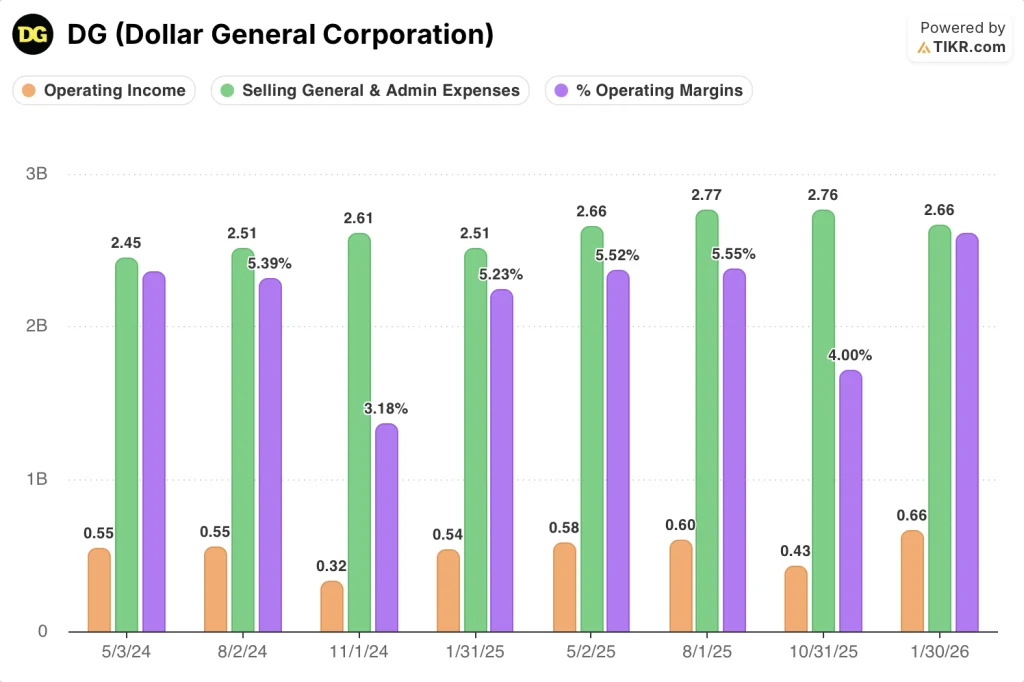
Operating margin reached 6.1% in Q4, up from 5.2% in the prior-year fourth quarter, which carried approximately $232 million in impairment charges, according to Lau.
Operating income was $660M in January 2026 per the income statement, compared to $430M in October 2025 and $540M in the prior-year January quarter.
SG&A fell 165 basis points to 24.9% of sales in Q4, reflecting the lapping of prior-year impairment charges and a lower retail salaries ratio, according to Lau.
For the full year, gross margin expanded 107 basis points, driven by an 80 basis point shrink reduction, exceeding goals in the long-term financial framework, according to Lau on the Q4 earnings call.
What Does the Valuation Model Say?
The TIKR model assigns Dollar General stock a mid-case price target of approximately $202, implying roughly 67% total return from the current price of $121 over the next 5 years, or about 11.4% annualized.
The mid-case assumes a revenue CAGR of 4%, net income margin of 4%, and EPS growth of 8% annually, all well above Dollar General’s trailing five-year EPS CAGR of negative 8.4%.
The Q4 print strengthens the risk/reward case: 107 basis points of full-year gross margin expansion and operating margins back above 6% confirm the recovery embedded in the model is already underway.
Dollar General stock is a modestly stronger investment case following this report, though the degree of improvement is capped by FY2026 guidance calling for comp growth of 2.2%–2.7%, well below the Q4 exit rate.

The central tension in Dollar General stock is whether the margin recovery delivered ahead of schedule in FY2025 is durable enough to sustain the thesis as comp growth decelerates toward roughly half the Q4 pace.
What Has to Go Right
- Gross margin continues expanding in FY2026: management expects shrink and damages combined to contribute approximately 50 basis points of incremental improvement over the next 3 to 4 years, ahead of initial framework targets
- The DG Media Network scales from $170M in FY2025 toward its 50 basis point gross margin contribution target embedded in the long-term framework
- Nonconsumable penetration reaches the targeted 20% by 2029, supported by 15 new brand launches in FY2026 and the rollout of shoppable social commerce
- Delivery, contributing 80 basis points to Q4 comp, continues growing as a standalone profit pool while expanding the media network audience base
What Could Still Go Wrong
- FY2026 EPS guidance of $7.10–$7.35 already embeds a $0.13 Work Opportunity Tax Credit headwind, and tariff escalation or consumer spending weakness could compress the range further
- Q1 comp is guided to the low 2% range, and SG&A deleverage is expected until comp runs slightly above 3%, according to Lau on the Q4 earnings call, leaving limited margin buffer on a soft top line
- The trailing five-year EPS CAGR of negative 8.4% reflects a structural multiple compression problem; the TIKR model prices in P/E contraction of 2.4% annually even in the mid case
- Shrink improvement laps get harder in FY2026 after an 80 basis point gain in FY2025, and any reversal in store-level execution would disproportionately weigh on gross margin given shrink’s central role in the recovery narrative
Should You Invest in Dollar General Corporation?
The only way to really know is to look at the numbers yourself. TIKR gives you free access to the same institutional-quality financial data that professional analysts use to answer exactly that question.
Pull up DG stock and you’ll see years of historical financials, what Wall Street analysts expect for revenue and earnings in the quarters ahead, how valuation multiples have moved over time, and whether price targets are trending up or down.
You can build a free watchlist to track Dollar General Corporation alongside every other stock on your radar. No credit card required. Just the data you need to decide for yourself.
Access Professional Tools to Analyze DG stock on TIKR for Free →