Key Stats for Norfolk Southern Stock
- Current Price: $319.71
- Target Price (Mid): ~$347
- Street Mean Target: ~$327
- Potential Total Return: ~9%
- Annualized IRR: ~2% / year
Now Live: Discover how much upside your favorite stocks could have using TIKR’s new Valuation Model (It’s free) >>>
What Happened?
Norfolk Southern (NSC) entered earnings week with momentum. Shares were trading near a 52-week high of $323.37, with investors watching two catalysts set to land within days: Q1 2026 results on April 24 and the Union Pacific merger refiling due April 30.
Bulls argued the railroad’s cost discipline was building an earnings floor the market hadn’t priced. Bears pointed to a rising operating ratio, a fuel cost shock, and merger-related intermodal losses.
The central question was whether management could hold the cost structure together through all of it.
They did.
Norfolk Southern reported adjusted EPS of $2.65, beating the $2.49 consensus by 6.28%, according to TIKR’s Beats & Misses data. Actual revenue came in at $2.998 billion, essentially flat year-over-year. The stock closed at $319.71 on earnings day.
The operating context behind those numbers matters.
CFO Jason Zampi confirmed on the earnings call that total adjusted expenses rose just 1% year-over-year, despite an estimated 5% inflation headwind, roughly $13 to $15 million in storm costs, and a fuel surge that left March alone $40 million above expectations, with the per-gallon price up 45% over the prior year. Holding costs to 1% in that environment represents real execution.
The merger is now the defining variable.
CEO Mark George confirmed the revised STB application would be filed by April 30, saying on the call: “The new application is going to confirm what we said in the original application on the logic of doing this deal and the benefits that single-line transcontinental railroad will bring to the country and to our shippers.”
The STB’s January rejection was made without prejudice, leaving the applicants free to refile a revised application addressing the identified deficiencies. Once filed, the formal review clock starts.

See historical and forward estimates for Norfolk Southern stock (It’s free!) >>>
Is Norfolk Southern Undervalued Today?
At $319, the NSC investment case rests on two arguments running in parallel.
The standalone railroad is executing well. Norfolk Southern moved 1.1% more gross ton-miles in Q1 2026, with shipments modestly lower, a sign of better asset utilization rather than volume growth. COO John Orr reported a Q1 fuel efficiency record, part of a multi-year program that has now delivered over $500 million in cumulative savings.
LTM levered free cash flow stands at approximately $1.3 billion, per TIKR data, giving the company enough runway to absorb fuel volatility without cutting the dividend. On safety, the FRA accident ratio improved 37% year-over-year in Q1.
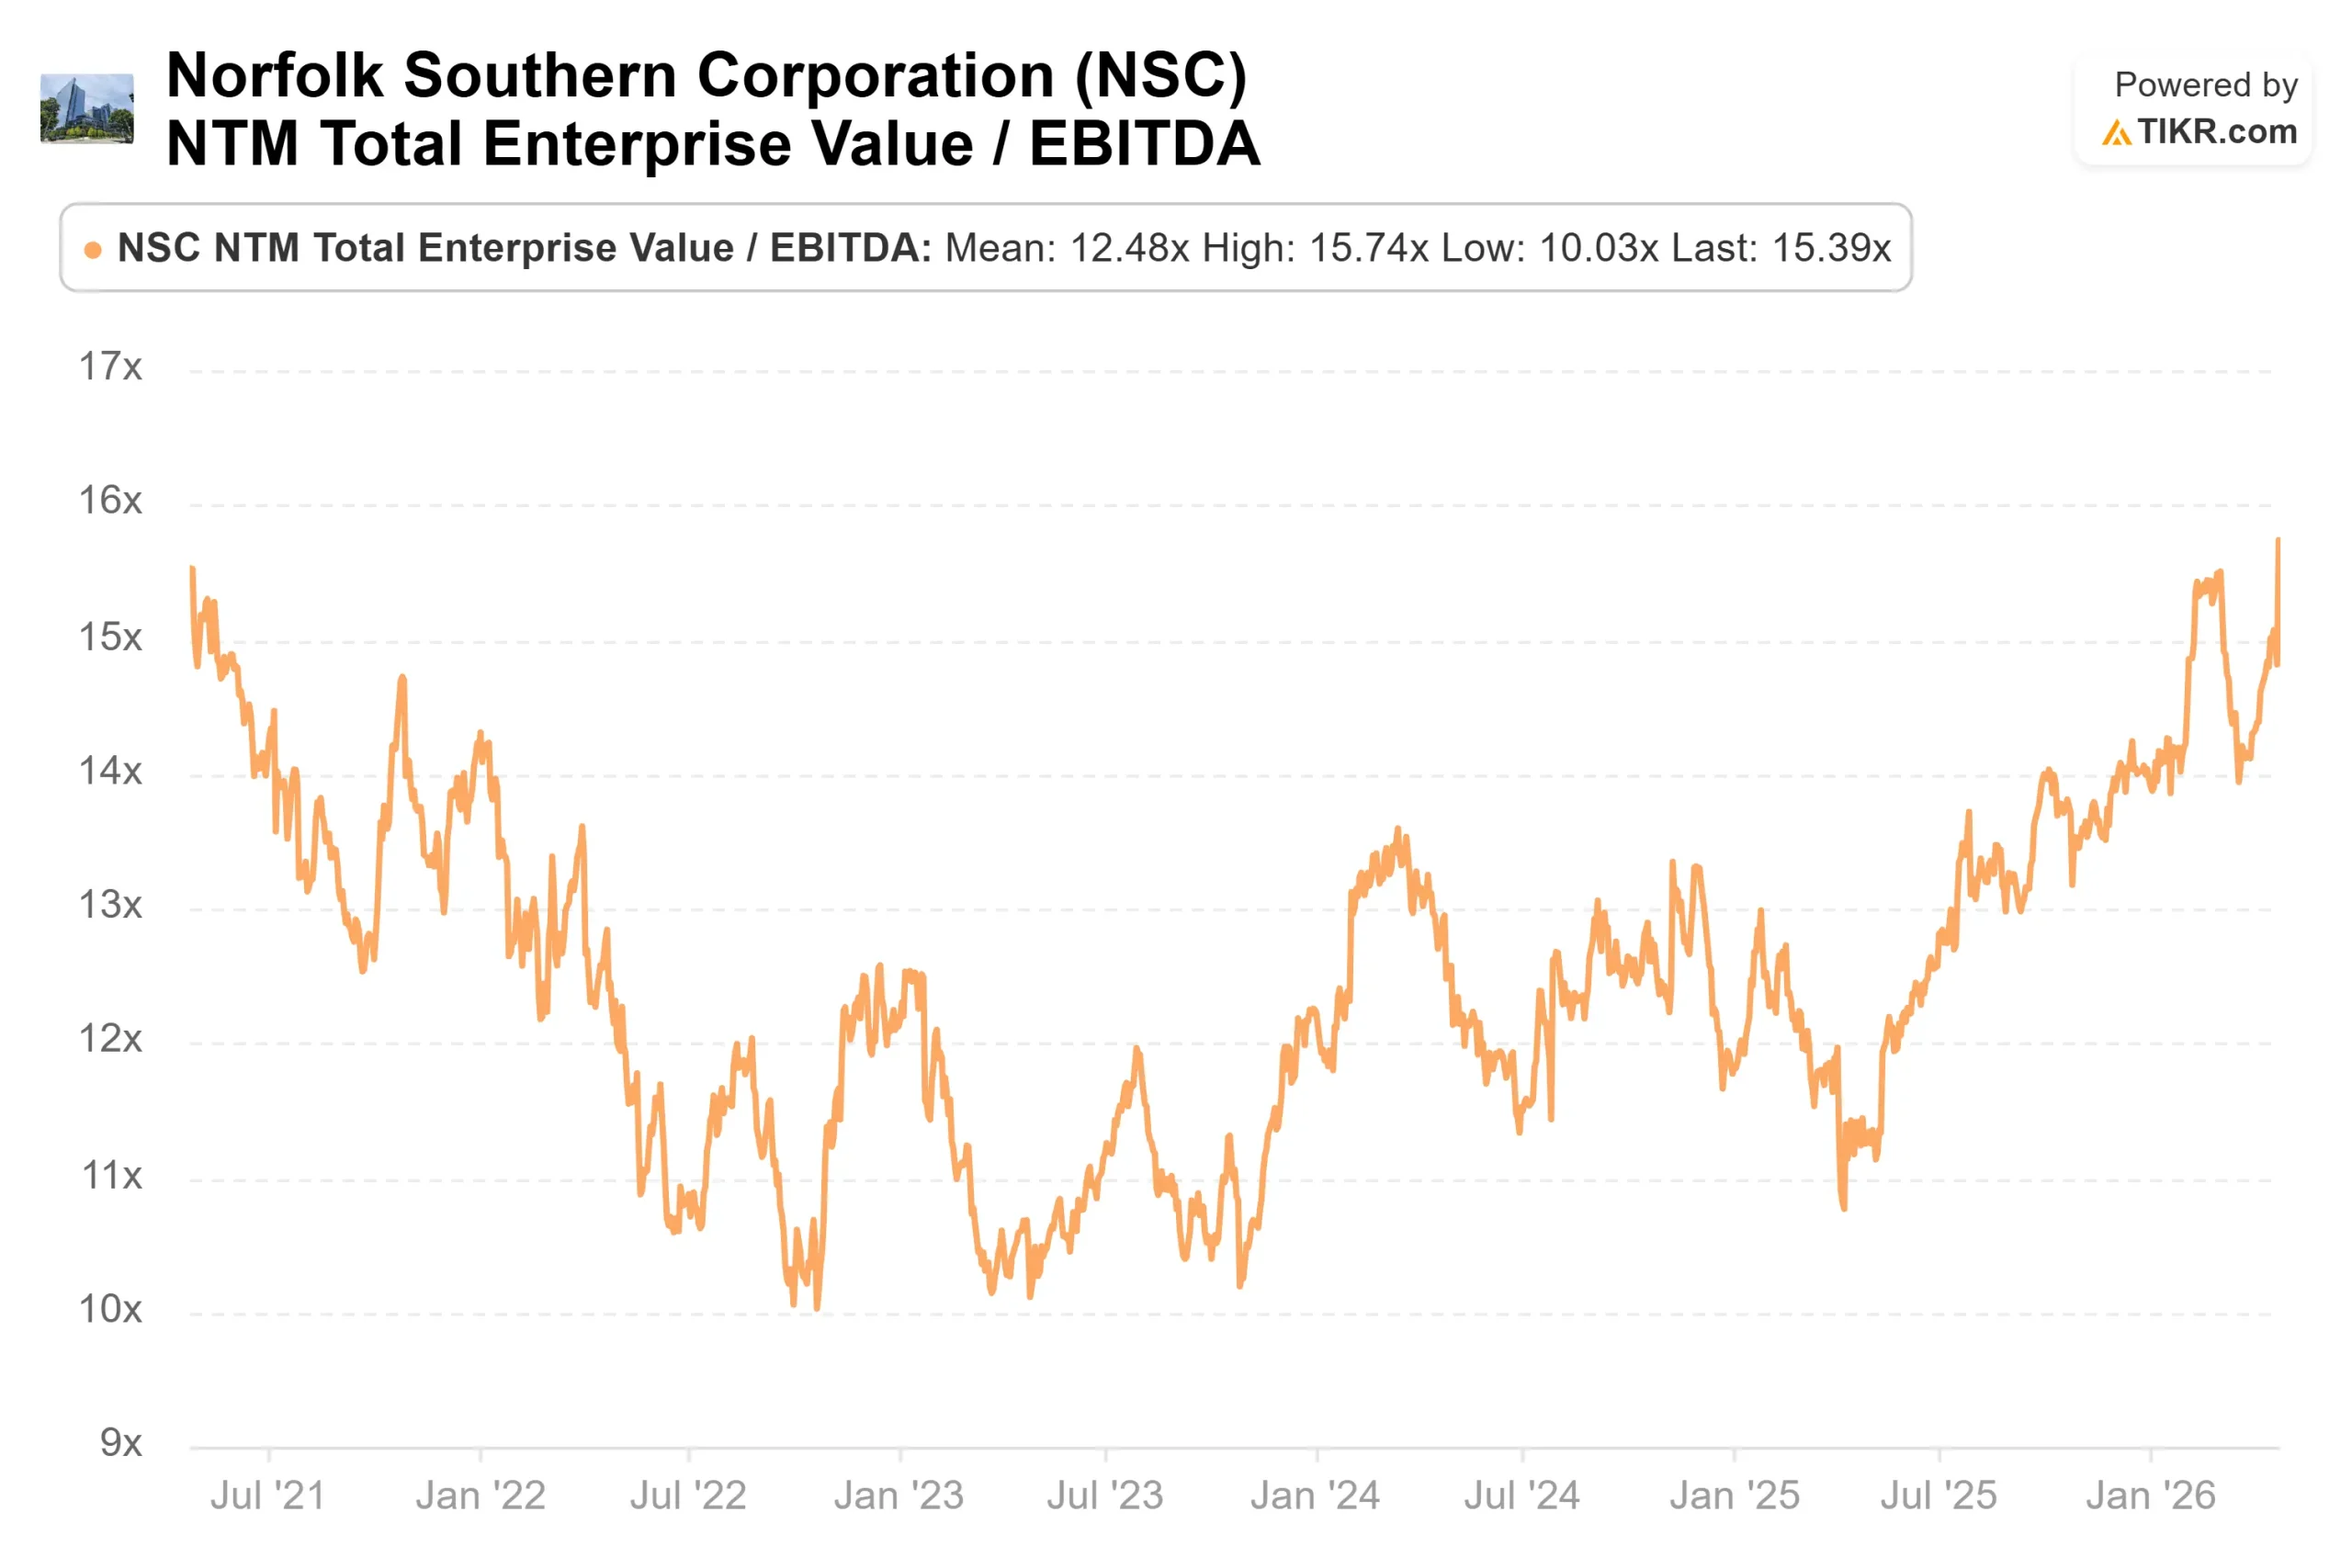
The valuation multiples reflect that improvement. NSC currently trades at an NTM EV/EBITDA of 15.39x, up from 11.89x a year ago. That expansion captures both better execution and merger premium. Whether it is justified depends on what happens at the STB.
Most analysts are waiting to find out. TIKR’s Street Targets data as of 4/24/26 shows 4 Buys, 1 Outperform, 16 Holds, and 1 Sell across 22 analysts. The Street’s mean target is $327. Post-earnings, Evercore ISI raised its price target to $325 from $295 while maintaining an Outperform rating.
The real risk is intermodal attrition. Q1 intermodal volumes fell 4%, driven by what Chief Commercial Officer Ed Elkins described as “merger-related losses from prior quarters” and increased competitor activity following the merger announcement.
Those losses are structural and will persist through the regulatory window. The partial offset is that higher fuel prices are making intermodal more competitive against trucking, a dynamic Elkins flagged directly on the call. On the growth side, 12 industrial development projects came online in Q1, worth roughly 70,000 loads at full ramp per Elkins, with more expected through year-end.
See how Norfolk Southern performs against its peers in TIKR (It’s free!) >>>
TIKR Advanced Model Analysis
- Current Price: $319.71
- Target Price (Mid): ~$347
- Potential Total Return: ~9%
- Annualized IRR: ~2% / year

See analysts’ growth forecasts and price targets for Norfolk Southern stock (It’s free!) >>>
TIKR’s mid-case model prices NSC at around $347 by December 31, 2030, implying a total return of around 9% and an annualized IRR of around 2%. The two primary revenue drivers are merchandise volume recovery as industrial production normalizes and coal volume support from utility demand and global LNG supply disruption tied to the Iran conflict. The margin driver is continued PSR 2.0 (Precision Scheduled Railroading, the operating system behind the company’s multi-year cost savings) compounding through 2030. The primary risk is the persistence of fuel costs. Management declined to update full-year cost guidance on the Q1 call precisely because of that uncertainty.
A standalone return of around 9% over four and a half years is modest from a stock near 52-week highs. If the merger closes, the picture improves materially. If it doesn’t and the multiple compresses toward pre-announcement levels, the LTM EPS base of around $12 doesn’t support the current price without meaningful volume recovery. That isn’t the base case, but it explains why 16 of 22 analysts are holding rather than buying.
Conclusion
The single metric to watch at Q2 2026 earnings is the adjusted operating ratio. Management guided for roughly 200 basis points of sequential improvement from Q1’s 68.7%, implying a Q2 OR in the high 66s. If elevated fuel persists and that target slips, the cost story that held in Q1 breaks. Watch for that number on or around July 24, 2026.
Norfolk Southern is executing well enough to hold the investment case on a standalone basis. At $319, the return profile stays thin unless the merger advances on schedule.
See what stocks billionaire investors are buying so you can follow the smart money with TIKR.
Should You Invest in Norfolk Southern?
The only way to really know is to look at the numbers yourself. TIKR gives you free access to the same institutional-quality financial data that professional analysts use to answer exactly that question.
Pull up Norfolk Southern, and you’ll see years of historical financials, what Wall Street analysts expect for revenue and earnings in the quarters ahead, how valuation multiples have moved over time, and whether price targets are trending up or down.
You can build a free watchlist to track Norfolk Southern alongside every other stock on your radar. No credit card required. Just the data you need to decide for yourself.
Analyze Norfolk Southern on TIKR Free →
Looking for New Opportunities?
- See what stocks billionaire investors are buying so you can follow the smart money.
- Analyze stocks in as little as 5 minutes with TIKR’s all-in-one, easy-to-use platform.
- The more rocks you overturn… the more opportunities you’ll uncover. Search 100K+ global stocks, global top investor holdings, and more with TIKR.
Disclaimer:
Please note that the articles on TIKR are not intended to serve as investment or financial advice from TIKR or our content team, nor are they recommendations to buy or sell any stocks. We create our content based on TIKR Terminal’s investment data and analysts’ estimates. Our analysis might not include recent company news or important updates. TIKR has no position in any stocks mentioned. Thank you for reading, and happy investing!