Key Stats for Halliburton Stock
- Current Price: $40.36
- Target Price (Mid): ~$59
- Street Target: ~$41
- Potential Total Return: ~46%
- Annualized IRR: ~5% / year
- Earnings Reaction: +2.52% (April 21, 2026)
Now Live: Discover how much upside your favorite stocks could have using TIKR’s new Valuation Model (It’s free) >>>
What Happened?
Halliburton (HAL) chart has been one of the sharpest recoveries in energy this year. The stock hit a 52-week low of $19.22, climbed to $40.36, and has more than doubled in the process. The most recent catalyst was the April 21 Q1 2026 earnings report: adjusted EPS of $0.55 beat consensus of $0.50 by 10%, revenue of $5.4 billion topped estimates, and the stock added 2.52% on the day.
Bulls see a company positioned at the exact intersection of a tightening North America frac market and a permanently altered energy security landscape. Bears point to a Middle East drag that is getting heavier in Q2, a Street mean target of $41.32 that implies almost no upside from today, and a TIKR model that prices the mid-case at only around 5% annualized returns through 2030.
The unresolved question is whether Halliburton’s technology edge has permanently raised its margin ceiling or whether this is a cyclical lift that stalls once activity plateaus.
On the earnings call, Jeff Miller, Chairman, President, and CEO, framed the U.S.-Iran conflict in structural terms: “Energy security is no longer simply a talking point. It demands action by every nation to ensure a reliable supply of oil and gas.”
He added that cumulative production deficits from the conflict are trending toward one billion barrels, representing several years of meaningful incremental demand on top of structural demand growth. That is not a one-quarter setup.
Three major milestones arrived in rapid succession.
On April 13, Halliburton announced a multibillion-dollar contract with YPF for unconventional completions in Argentina’s Vaca Muerta shale, marking the first international deployment of its ZEUS electric fracturing platform outside North America.
On April 6, it signed a Strategic Collaboration Agreement with PETRONAS Suriname and Valaris for offshore development.
On April 1, it closed the acquisition of Sekal AS, a digital drilling autonomy firm, giving Halliburton the capability to close the loop on automated geosteering fully. Three major moves in three weeks are a signal, not noise.

See historical and forward estimates for Halliburton stock (It’s free!) >>>
Is Halliburton Undervalued Today?
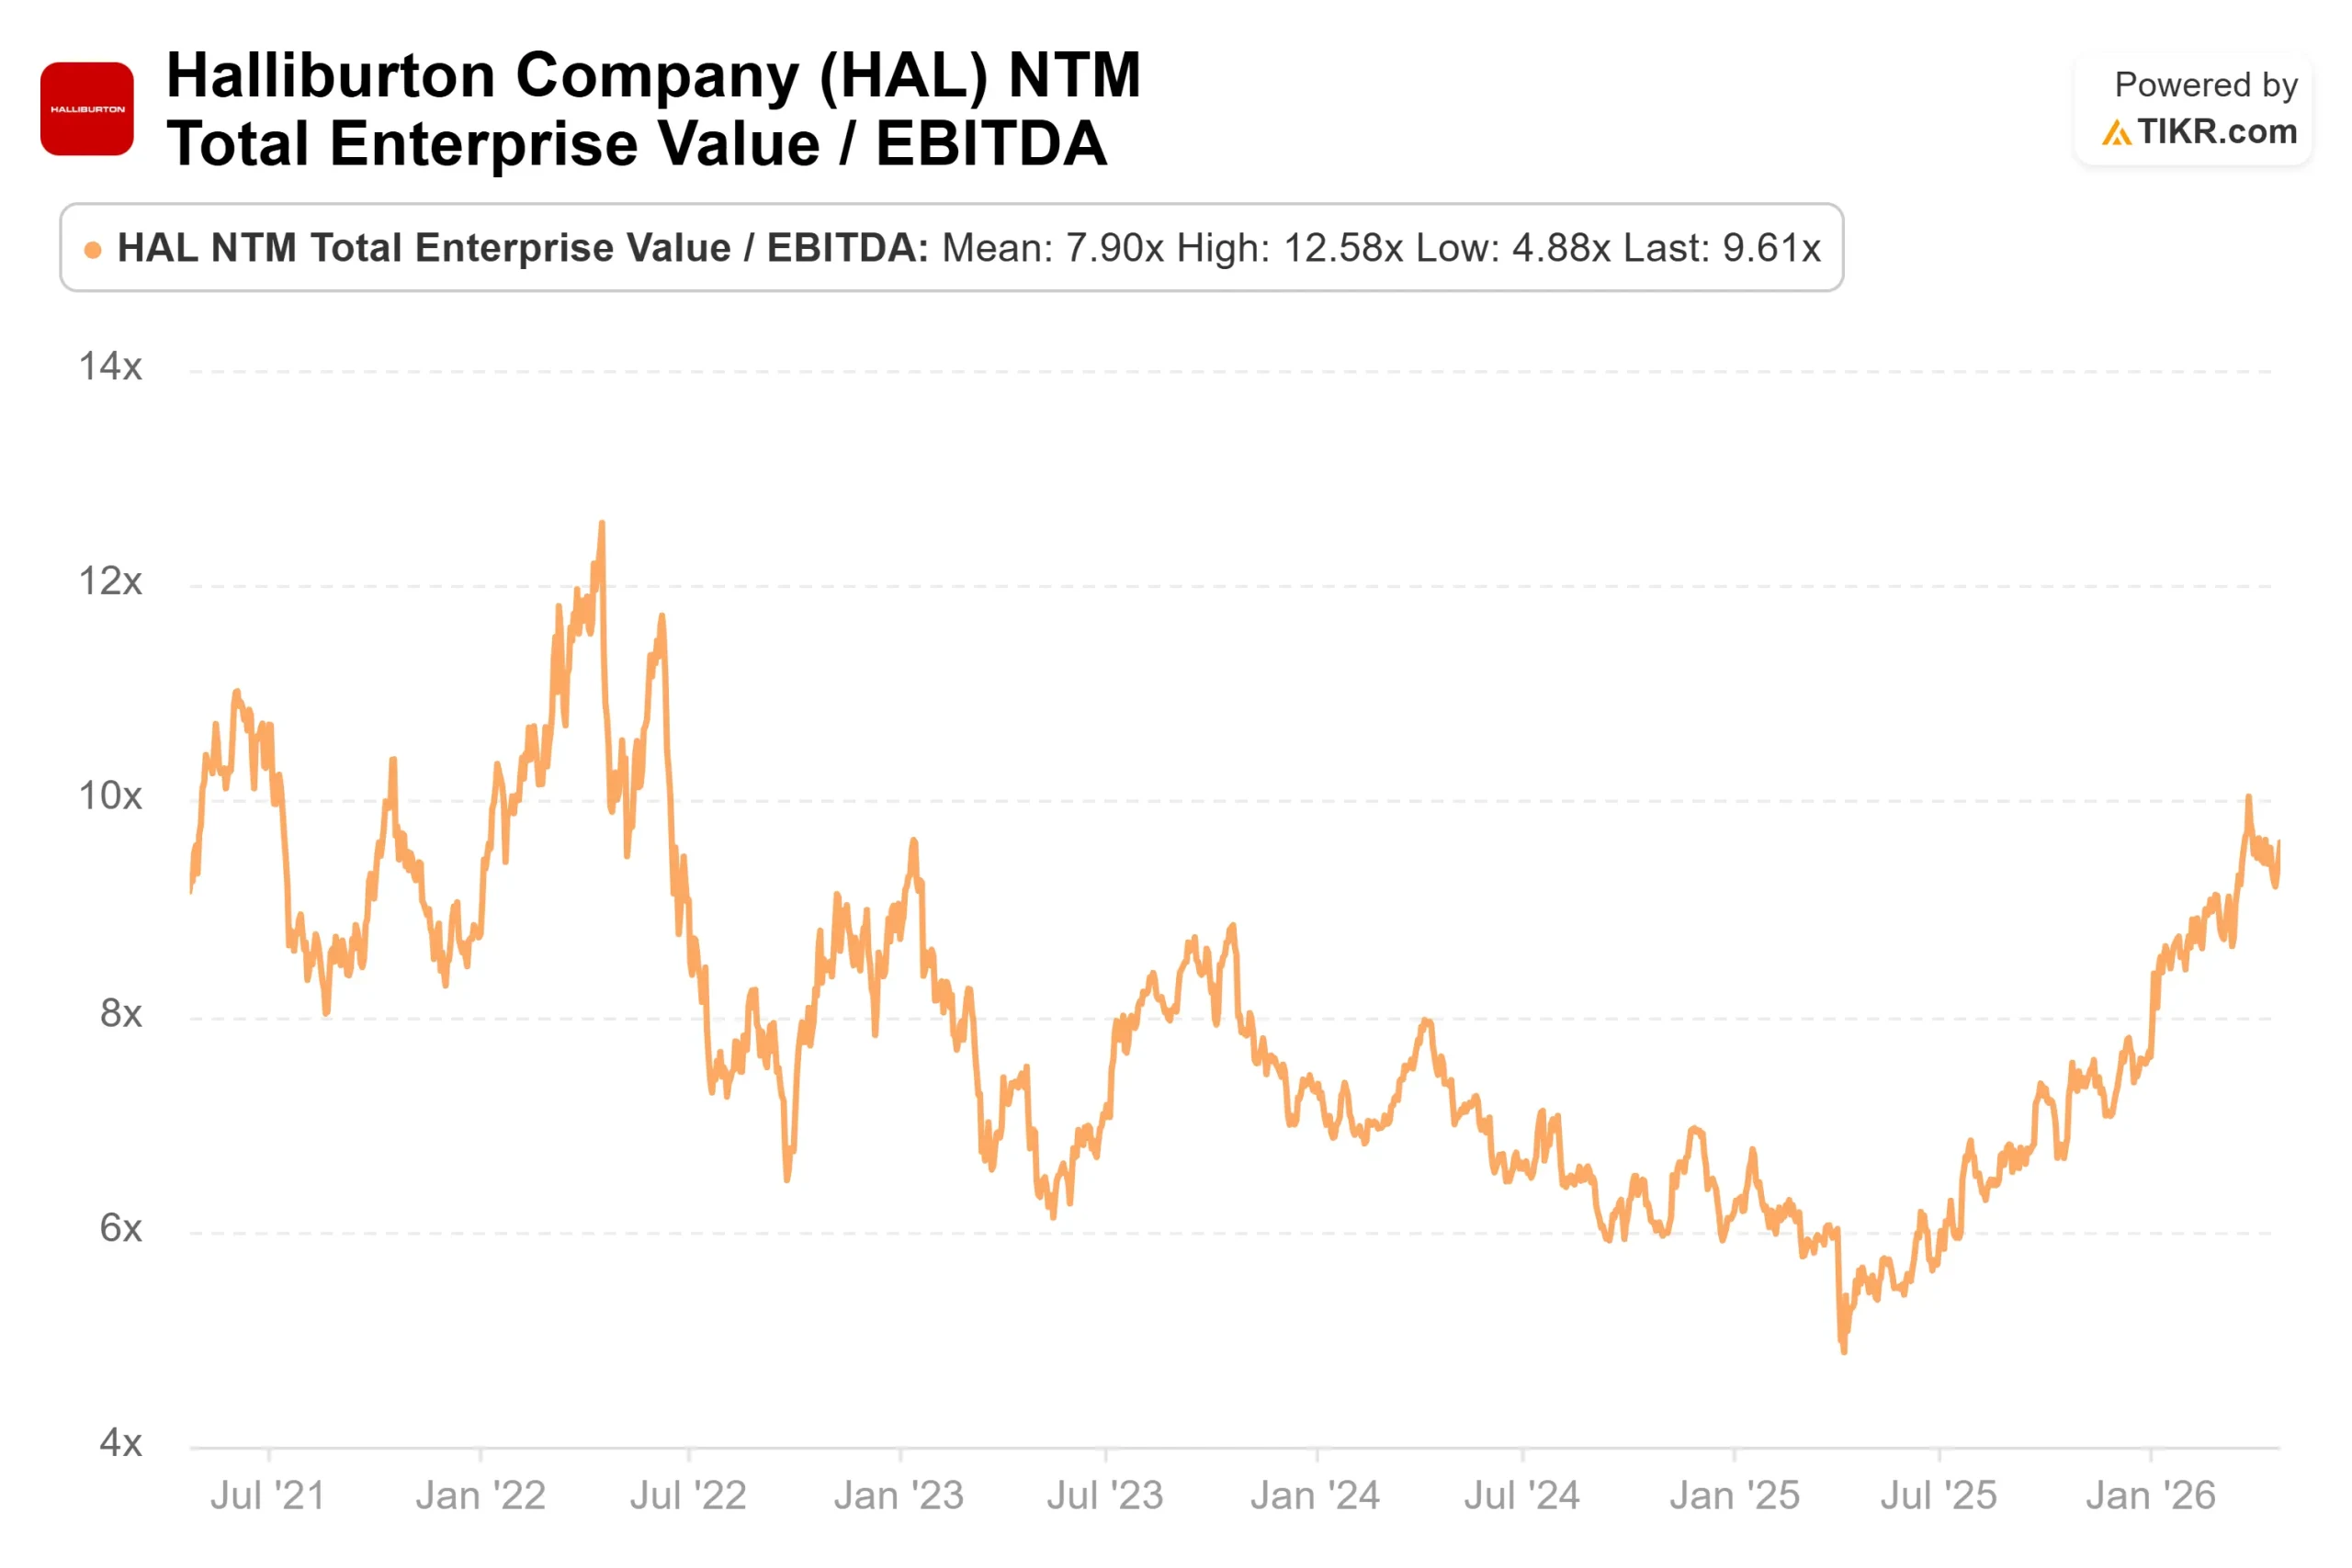
The valuation is a genuine push-and-pull. HAL trades at 9.6x NTM EV/EBITDA, modestly above the sector mean of around 8.2x among its Energy Equipment and Services peers on TIKR. For context, Baker Hughes (BKR) trades at around 14x on the same metric.
That gap historically narrows when North American frac pricing begins to shift from conversation to contract, which is exactly what management says is happening. Whether that converts to booked revenue in Q2 and Q3 is the key open variable.
The Street is broadly constructive but not chasing. Across 27 analysts, the breakdown is 15 Buys, 4 Outperforms, 6 Holds, 1 Underperform, and 1 Sell, with a mean target of $41.32. That target implies essentially no upside from today’s price.
Either the stock has run past consensus, or consensus hasn’t caught up to the cycle yet.
On free cash flow, the TIKR consensus estimates project around $1.9 billion for full-year 2026. That supports a buyback program, CFO Eric Carre confirmed, which will accelerate in the second half. The near-term drag from $42 million quarterly SAP S/4 migration costs and elevated Middle East logistics expenses is real but time-limited.
The risk is also clearly defined. The Q2 Middle East impact is estimated at $0.07 to $0.09 per share embedded in guidance, with a possible additional $0.03 to $0.05 if offshore restarts are delayed past mid-quarter.
Shannon Slocum, Executive Vice President and COO, noted that alternative supply routes and higher purchase material costs from the Strait closure are manageable, but they are a live headwind in the income statement right now.
The bull case is ultimately about what happens when North America’s frac capacity crosses into visible pricing power.
Miller described premium dual-fuel fleets as being “absolutely sold out as an industry.” When that tightness converts to higher realized prices in the Completion and Production segment, incremental margins move sharply because the cost base is already set. The data for that is not yet in the reported numbers.
That gap between what management sees on the ground and what is visible in results is exactly where the investment risk and opportunity coexist.
See how Halliburton performs against its peers in TIKR (It’s free!) >>>
TIKR Advanced Model Analysis
- Current Price: $40.36
- Target Price (Mid): ~$59
- Potential Total Return: ~46%
- Annualized IRR: ~5% / year

See analysts’ growth forecasts and price targets for Halliburton stock (It’s free!) >>>
The TIKR mid-case uses a revenue CAGR of around 3% through 12/31/30. The two drivers are international unconventional expansion, led by the YPF/Vaca Muerta win and growing offshore wins across Latin America and West Africa, and North America services pricing recovery as premium frac capacity tightens through 2026 into 2027. The net income margin expands from around 9% in 2026 toward around 11% by 2030 as Middle East disruption fades and higher-margin technology deployments carry increasing weight in the mix. The primary risk to both assumptions is a prolonged Middle East conflict that delays the 2027 revenue acceleration on which the model depends.
The high case reaches ~$70 by 12/31/30 with a total return of around 74%, while the low case lands near ~$48 with around 18% total return. The wide scenario spread reflects genuine uncertainty around North America pricing, timing, and the Middle East recovery.
At around 5% annualized, the mid-case is honest: HAL at $40.36 is not a high-growth compounder. It is a cycle-exposed, cash-returning business that becomes compelling if the market re-rates its valuation multiple as pricing evidence arrives, and stays only mildly interesting if it does not.
Conclusion
Watch the Completion and Production segment operating margin at the Q2 2026 earnings report, expected around July 22. Management guided C&P margins to improve 50 to 100 basis points sequentially from Q1’s 15% baseline. If it comes in above that range, North America pricing is converting inbound calls to revenue. If it misses, this becomes a 2027 story.
Halliburton has real technology momentum, a structurally tighter oil market behind it, and a growing international contract pipeline. The TIKR mid-case says the stock needs the cycle to keep delivering. At $40.36, that is the bet.
See what stocks billionaire investors are buying so you can follow the smart money with TIKR.
Should You Invest in Halliburton?
The only way to really know is to look at the numbers yourself. TIKR gives you free access to the same institutional-quality financial data that professional analysts use to answer exactly that question.
Pull up Halliburton, and you’ll see years of historical financials, what Wall Street analysts expect for revenue and earnings in the quarters ahead, how valuation multiples have moved over time, and whether price targets are trending up or down.
You can build a free watchlist to track Halliburton alongside every other stock on your radar. No credit card required. Just the data you need to decide for yourself.
Analyze Halliburton on TIKR Free →
Looking for New Opportunities?
- See what stocks billionaire investors are buying so you can follow the smart money.
- Analyze stocks in as little as 5 minutes with TIKR’s all-in-one, easy-to-use platform.
- The more rocks you overturn… the more opportunities you’ll uncover. Search 100K+ global stocks, global top investor holdings, and more with TIKR.
Disclaimer:
Please note that the articles on TIKR are not intended to serve as investment or financial advice from TIKR or our content team, nor are they recommendations to buy or sell any stocks. We create our content based on TIKR Terminal’s investment data and analysts’ estimates. Our analysis might not include recent company news or important updates. TIKR has no position in any stocks mentioned. Thank you for reading, and happy investing!