Estimating a stock’s fair value is like determining the true price of a house based on its future rental income rather than just the bricks and mortar. While historical data tells you what a company has done, analyst forecasts offer a roadmap of where it’s going. The challenge for most investors isn’t finding these estimates; it’s finding free tools that can actually aggregate this “wisdom of the crowd” into a reliable valuation model.
In the past, accessing multi-year analyst projections and professional-grade valuation models required a five-figure subscription to a Bloomberg terminal, while individual investors were left to guess at a stock’s “intrinsic value” using stale data and simplified formulas. Today, a new wave of platforms has democratized this process, allowing you to bridge the gap between Wall Street expectations and your own investment discipline.
The following tools act as your personal research department, helping you synthesize revenue, earnings, and margin forecasts into a clear picture of a stockis current value. By using these platforms to stress-test analyst targets and build your own forward-looking models, you can avoid overpaying for “hype” and focus on buying durable businesses at a discount. These are the best free resources for turning professional forecasts into a verifiable margin of safety.
1. TIKR
TIKR is the premier platform for investors who want to move beyond simple price targets and build evidence-based valuations. It allows you to scan over 100,000 global stocks, giving you access to institutional-grade analyst estimates for everything from revenue and EPS to specific industry KPIs. Unlike many free tools that show only a single year of projections, TIKR offers multi-year forward-looking data, allowing you to see how long-term expectations evolve.

The platform’s standout valuation feature is its Valuation Model Builder, which lets you estimate a stock’s potential share price in under a minute. By using analyst consensus as a “pre-filled” starting point, you can quickly adjust revenue growth and margin assumptions to create Bull, Base, and Bear scenarios. This ensures that you don’t just “accept” an analyst’s target but actually understand the financial logic required for the stock to reach that price.
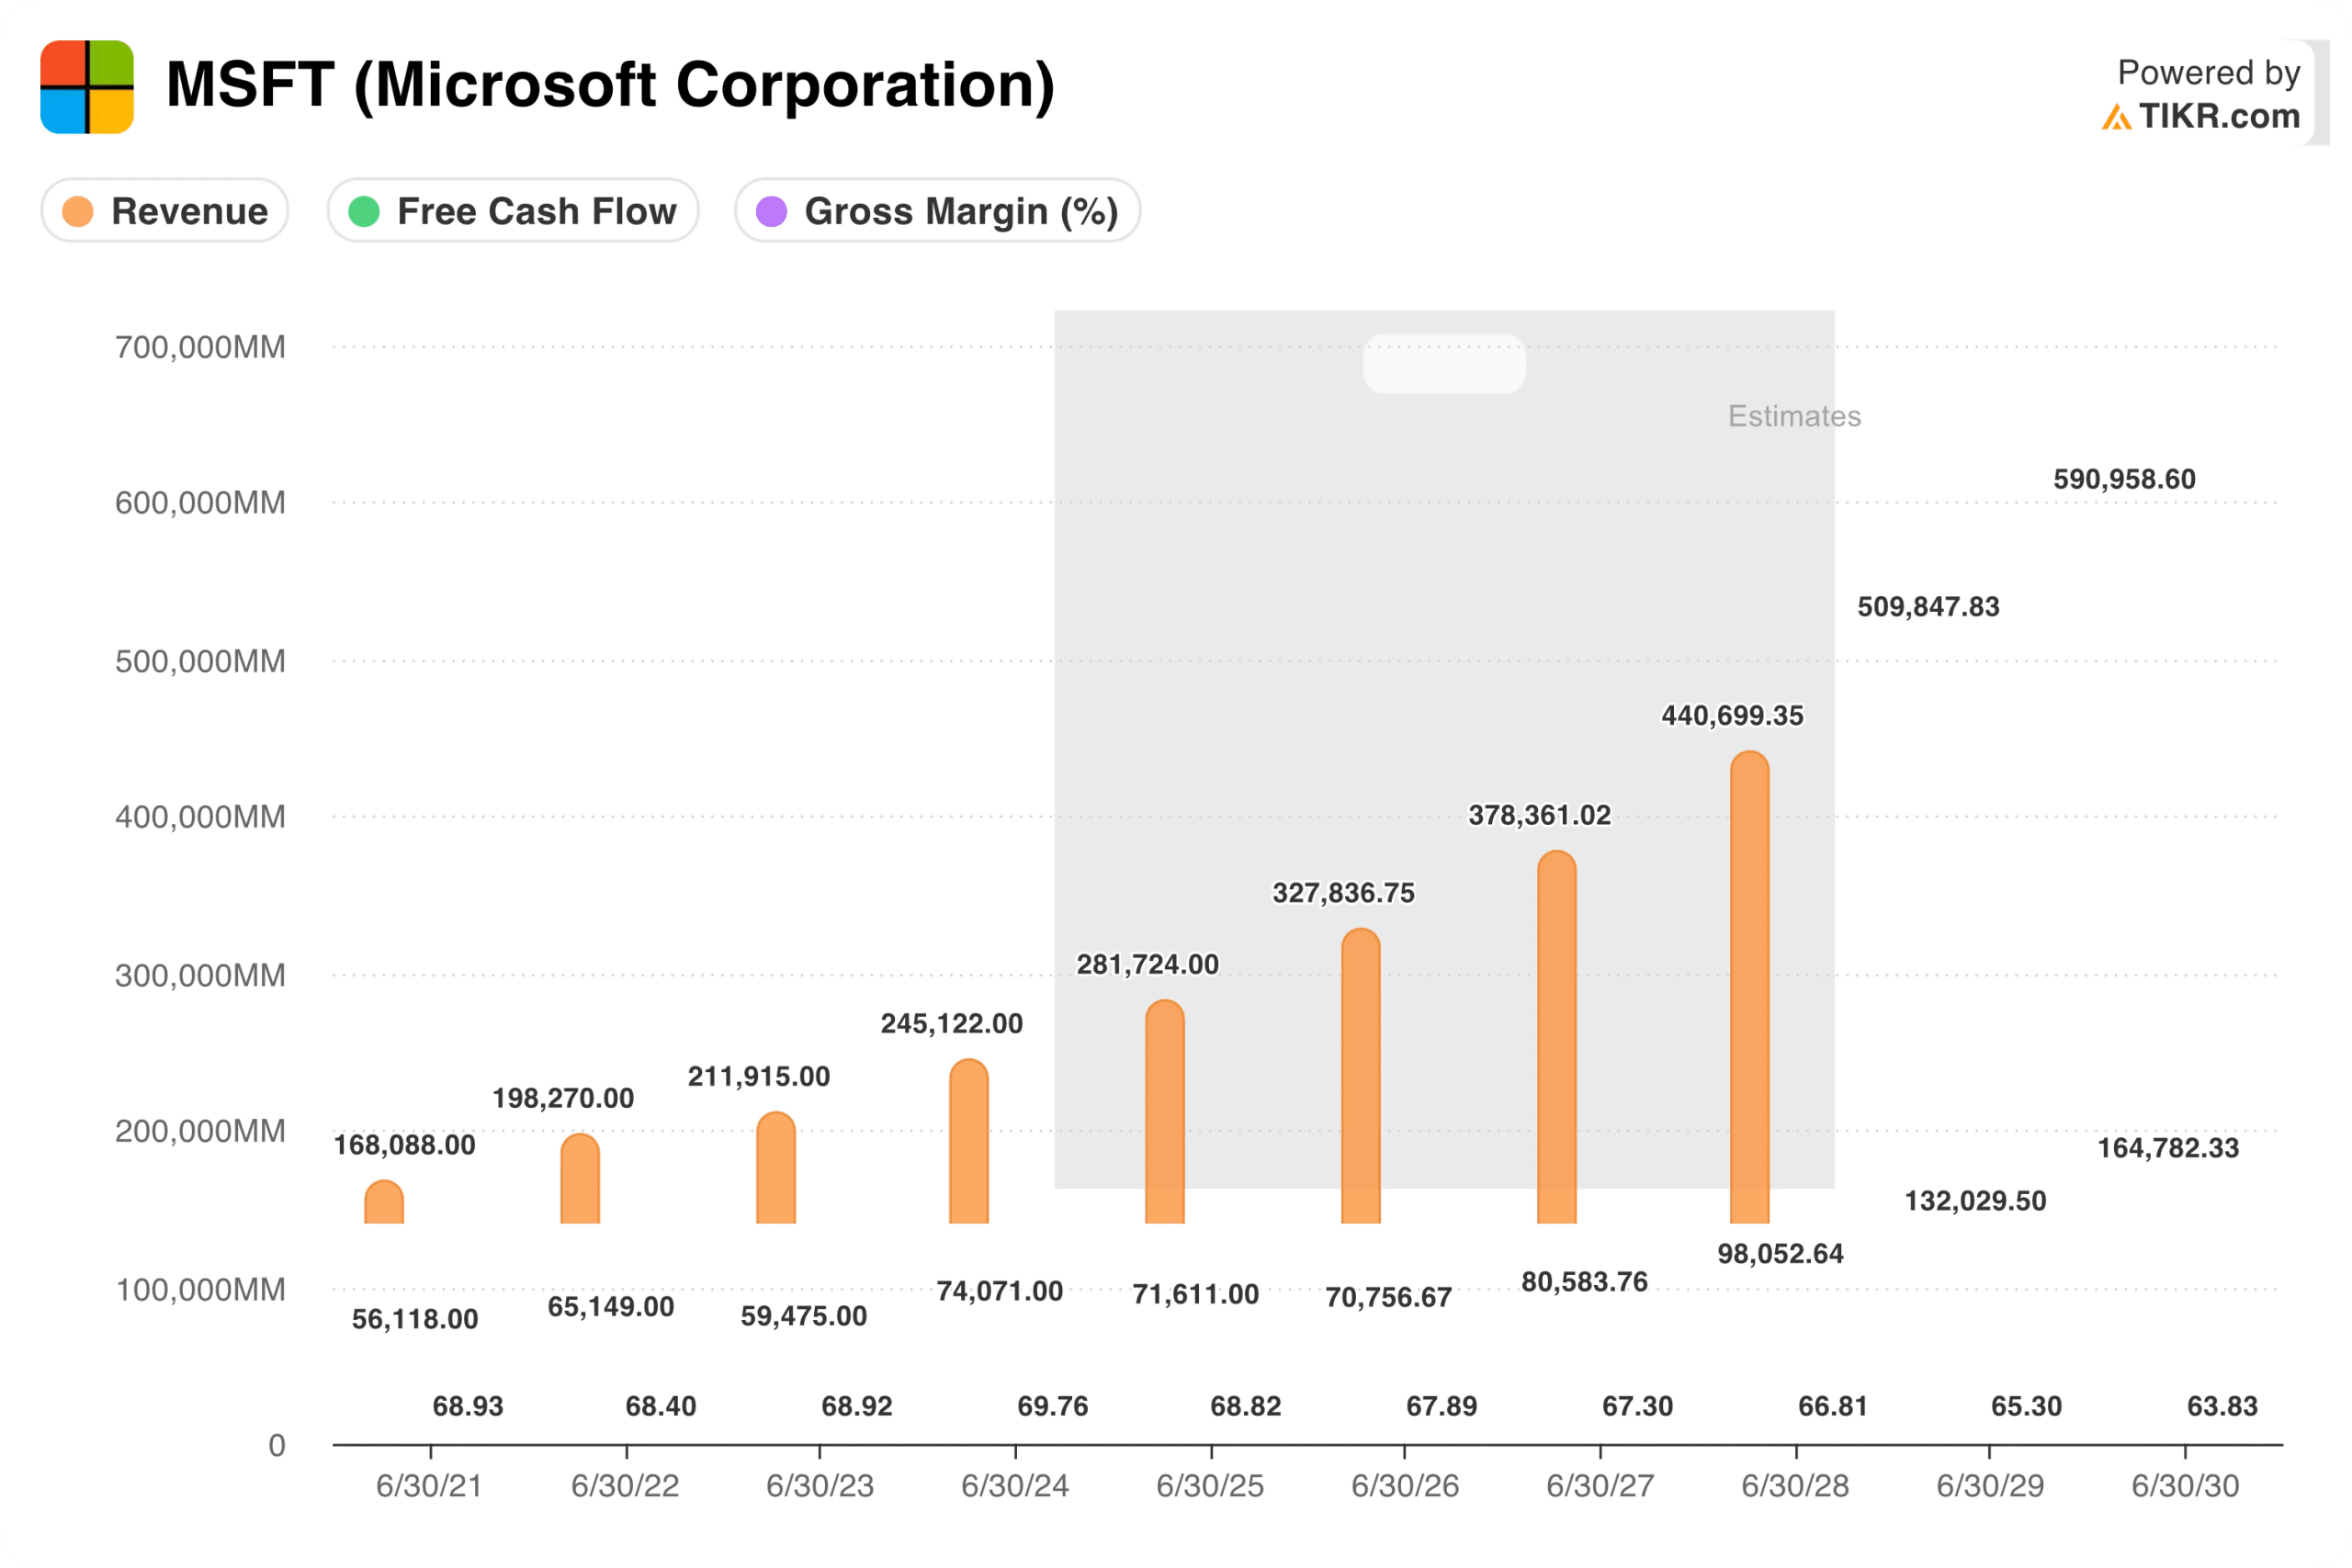
Furthermore, TIKR allows you to cross-reference these forecasts with 15+ years of historical financial statements. This historical context is vital for determining if an analyst’s “hockey stick” growth projection is realistic, given the company’s past performance. TIKR bridges the gap between raw data and disciplined decision-making, ensuring you invest with a clear understanding of a stock’s intrinsic value.
Best Features:
- Historical Baseline Overlay: Instantly see if forward-looking margin and growth estimates align with a company’s long-term historical averages.
- Valuation Model Builder: Automatically pre-fills analyst consensus data to let you calculate potential share prices in under 60 seconds.
- Up-to-Date Analyst Estimates: Access detailed, multi-year forecasts for over 100,000 global companies across 92 countries.
- Transcript Integration: Read earnings call transcripts side-by-side with estimates to understand the “why” behind analyst revisions.
Find stocks that analysts think are undervalued today >>>
| Tool | Best For | Key Valuation Feature |
| TIKR | Model Building | Automated Valuation Builder & Multi-Year Estimates. |
| Yahoo Finance | Consensus Checks | Mean Price Target and Analyst Coverage counts. |
| GuruFocus | Intrinsic Value Math | DCF Calculator and proprietary “GF Value” scores. |
| Finviz | Rapid Target Alerts | Price Target vs. Stock Price percentage diffs. |
| Stock Analysis | Clean Visual Forecasts | Interactive EPS/Revenue Growth charts. |
2. Yahoo Finance
Yahoo Finance remains the industry standard for a quick, low-friction check on the broader market consensus. In the “Analysis” tab for any stock, it provides a clean summary of the Mean Price Target, the number of covering analysts, and the “Recommendation Rating” (Buy, Hold, Sell). It is a highly effective tool for establishing a baseline “whisper number” before you dive into more granular research.
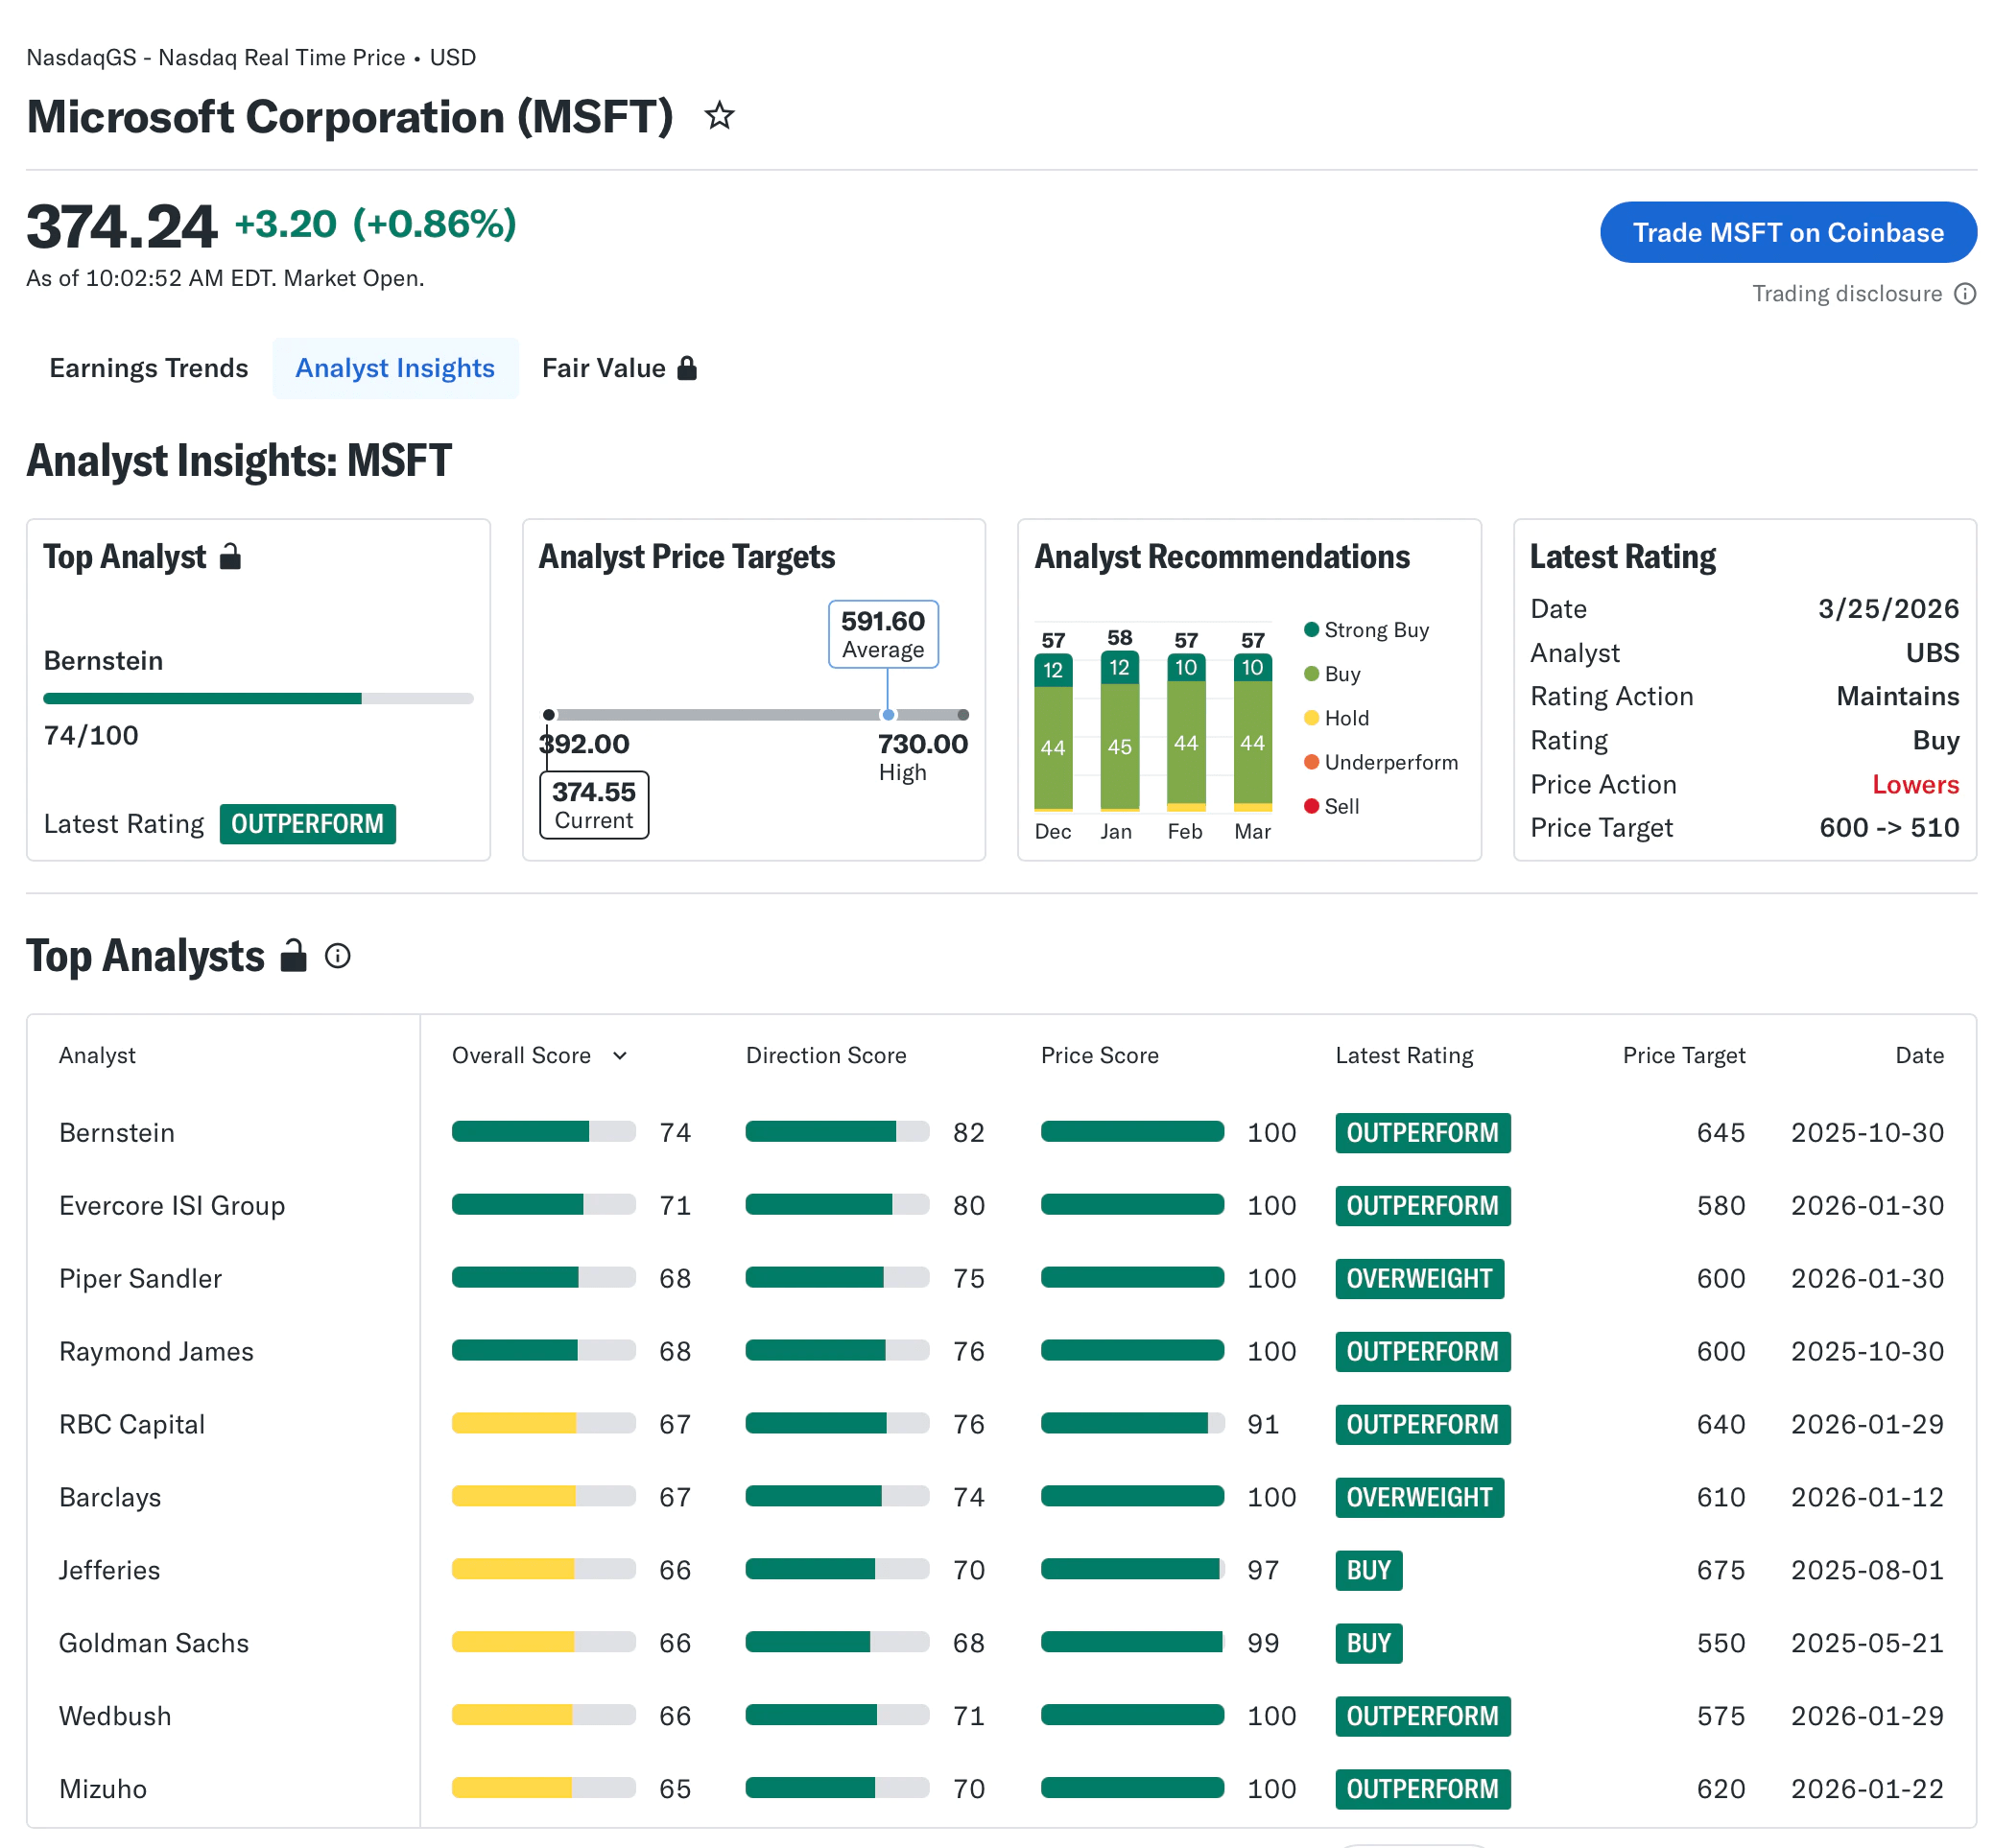
The platform’s “Fair Value” indicator is particularly helpful for beginners, as it provides a visual gauge of whether a stock is currently overvalued, undervalued, or near its fair price based on proprietary algorithms. While it lacks the deep customization of a professional terminal, its ubiquitous accessibility makes it an essential tool for daily monitoring of professional sentiment.
Best Features:
- Yahoo Finance does this best by providing an accessible, free Analyst Coverage Summary that establishes the market’s average “fair value” expectations in seconds.
3. GuruFocus
GuruFocus is designed for the “value-first” investor who wants to verify a company’s quality through forensic valuation metrics. Its standout free feature is the Handy DCF Calculator, which lets you manually enter your own growth rates or use pre-filled analyst estimates to calculate a stock’s intrinsic value. This “reverse-engineered” approach helps you determine exactly what level of growth is currently “priced in” by the market.

The platform also offers a unique GF Value score, which combines historical multiples with future growth projections to identify stocks trading at a deep discount. By visualizing how a stock’s current price deviates from this “fair value line” over several years, GuruFocus helps you avoid the trap of buying into high-growth stocks at peak valuations.
Best Features:
- GuruFocus does this best by offering an interactive DCF Calculator that lets you stress-test analyst growth projections to find a margin of safety.
Find stocks that are expected to outperform today >>>
4. Finviz
Finviz excels at rapid, high-level discovery of stocks that are trading significantly below Wall Street price targets. Within its powerful screener, you can filter for companies with specific “Analyst Rating Upgrades” or those whose Price/Target ratio suggests significant upside potential. It is the fastest way to build a “buy list” of companies that analysts are suddenly becoming more bullish on.

The platform’s news aggregator and interactive heatmap also help you track real-time shifts in sentiment. If you notice a sector turning “dark green” on the heatmap following a series of analyst upgrades, Finviz allows you to immediately drill down into the specific targets and news reports driving that movement. It is a “top-of-funnel” essential for monitoring where professional confidence is accumulating.
Best Features:
- Finviz does this best by providing Price-to-Target Filters in its screener, allowing you to find stocks with the largest gap between current price and analyst expectations.
Find stocks analysts think will explode with TIKR’s detailed analyst estimates (It’s free) >>>
5. Stock Analysis
Stock Analysis is built for investors who value clarity and speed when reviewing historical and projected performance. It provides one of the cleanest visual representations of Analyst Forecasts, showing a dedicated table of future revenue and EPS projections alongside the estimated “Year-over-Year” growth rates. This makes it incredibly easy to see if a company’s valuation is justified by an expected acceleration in its earnings power.
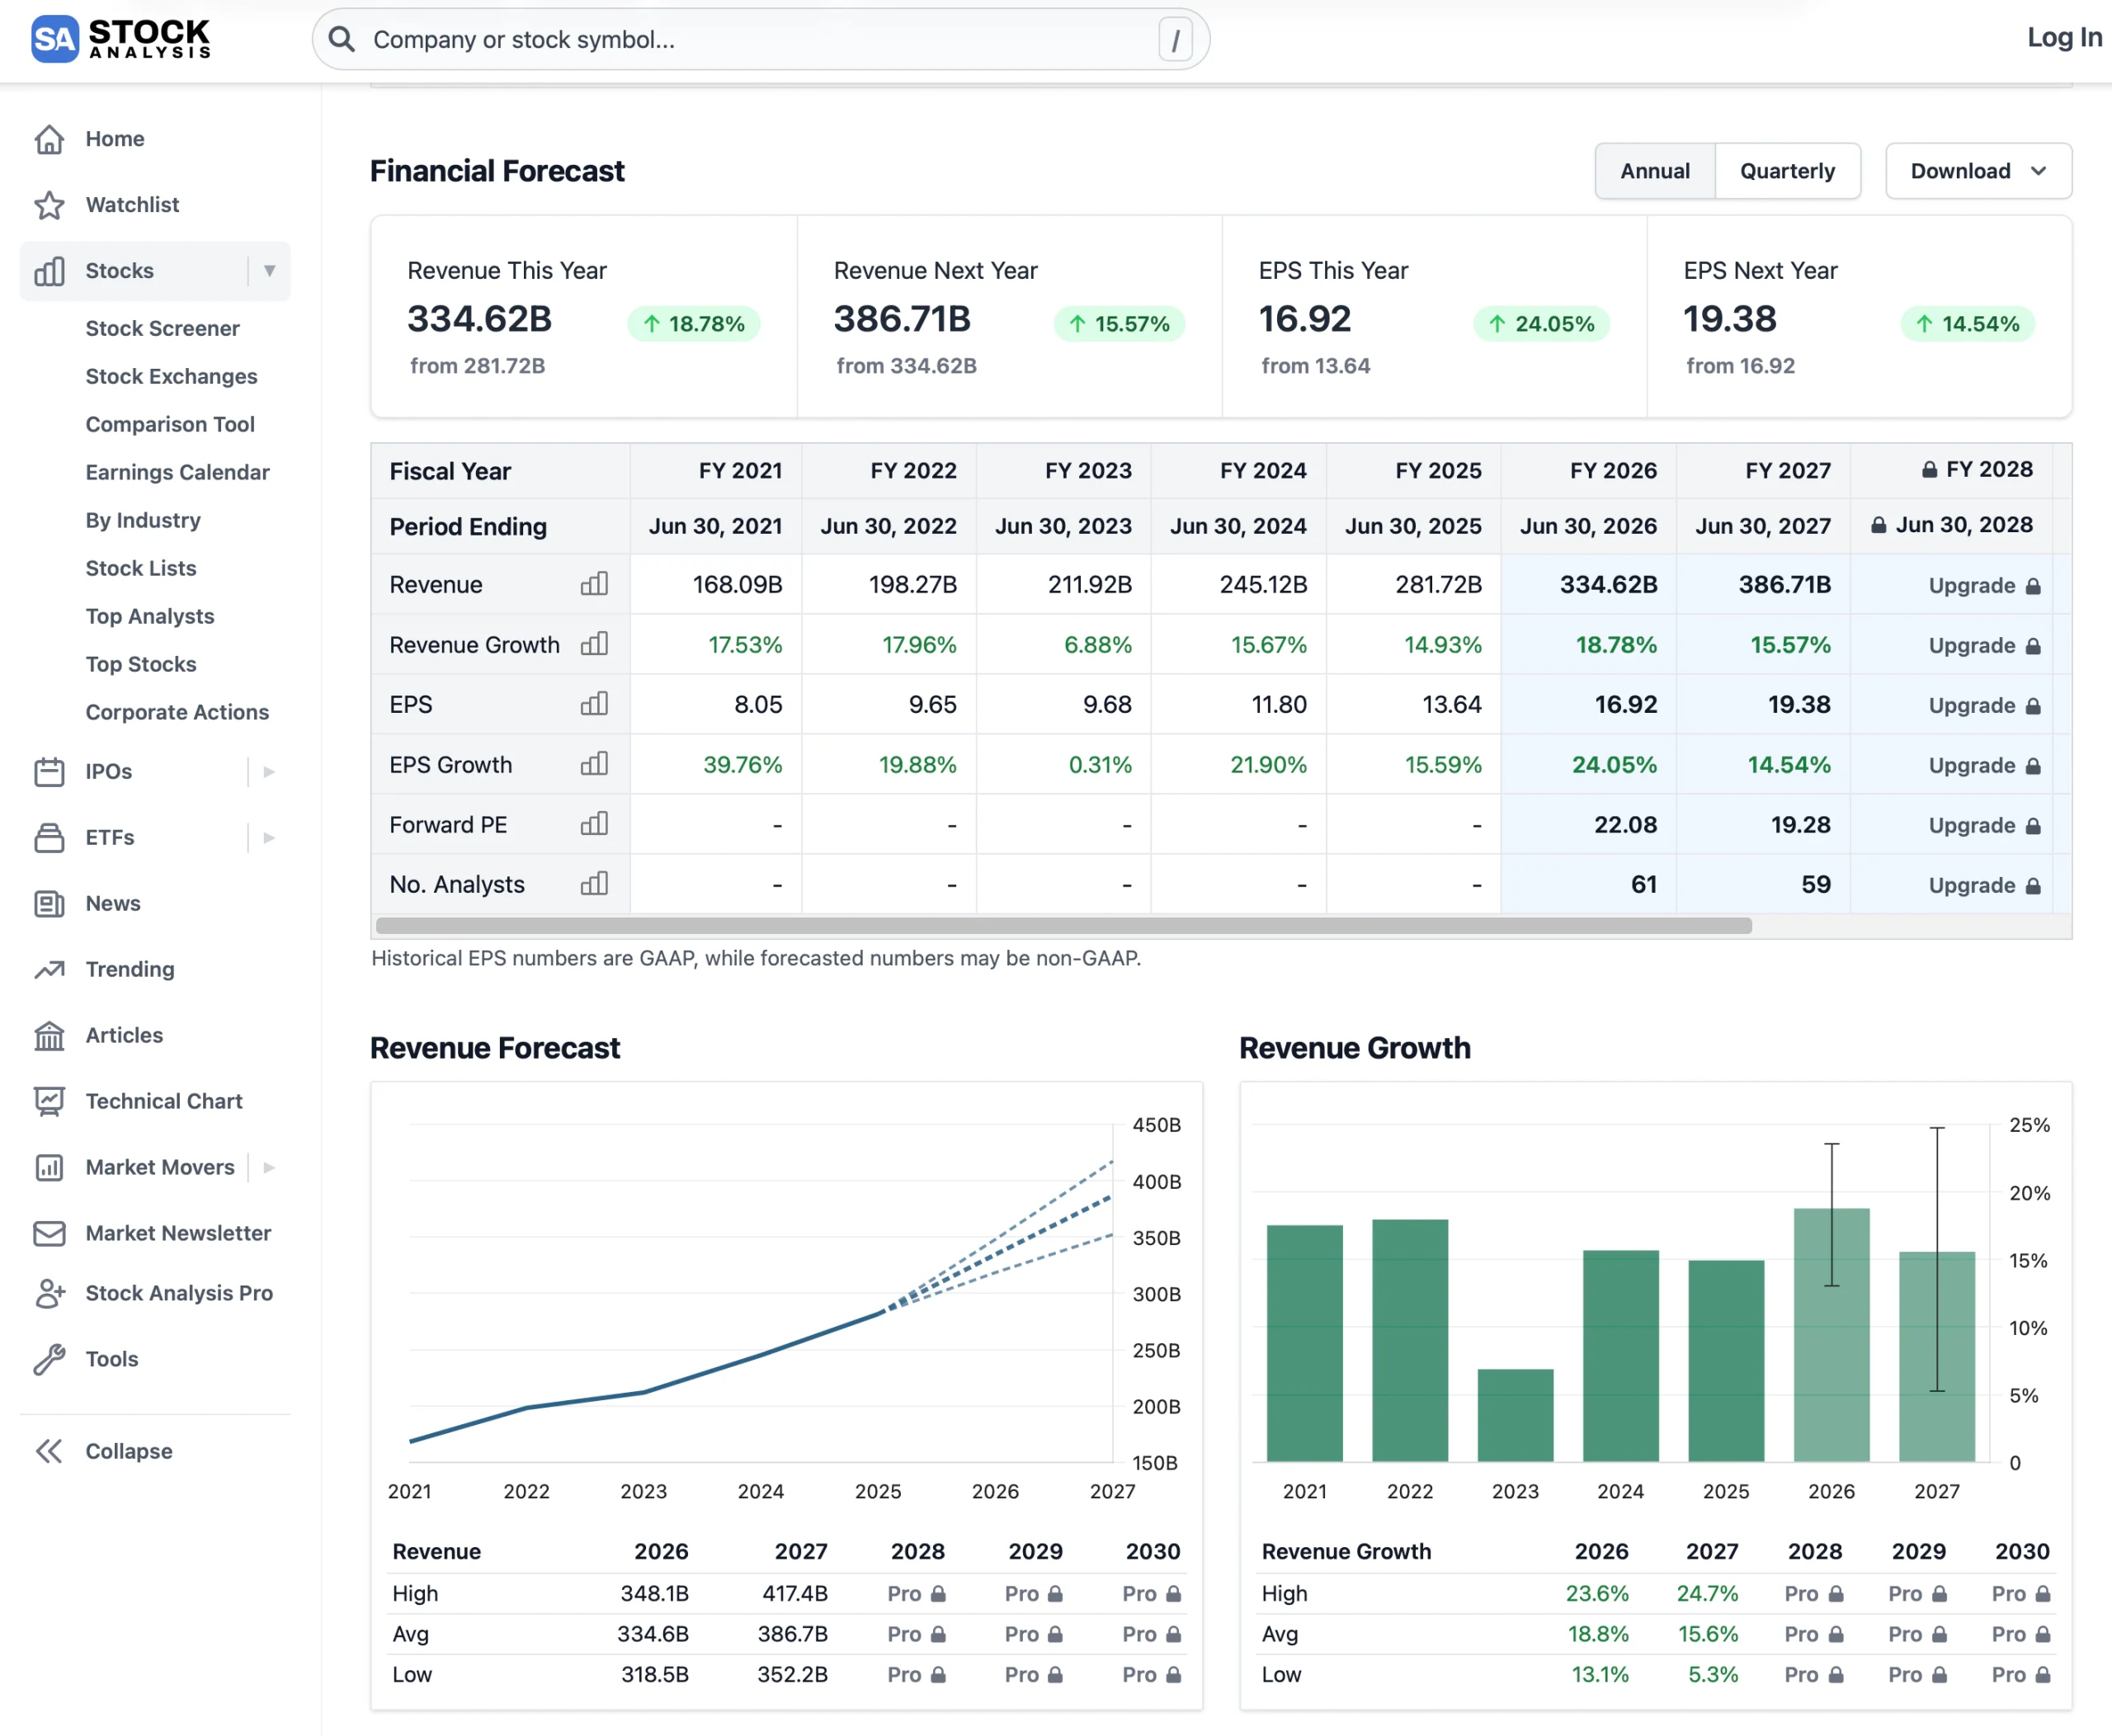
The platform’s no-frills UI removes the “noise” found on larger financial portals, allowing you to focus purely on the fundamental growth trajectory. Because it prioritizes standardized, easy-to-read tables, it is often the best choice for a final “sanity check” to ensure your fair value estimates aren’t being skewed by temporary market volatility.
Best Features:
- Stock Analysis does this best by offering a Clean Forecast View that visualizes multi-year EPS and revenue growth projections in a simple, high-speed interface.
The TIKR Takeaway
Estimating fair value is not about blindly following a single analyst’s price target; it is about using the “wisdom of crowds” to build a range of realistic outcomes. TIKR is the only free platform that allows you to instantly bridge the gap between professional consensus estimates and your own evidence-based convictions.
By using the Valuation Model Builder to auto-fill your assumptions with up to five years of Wall Street projections, TIKR ensures your “Base Case” is grounded in institutional-grade data rather than guesswork. It transforms valuation from a speculative exercise into a rigorous stress-test, allowing you to see exactly how sensitive a stock’s potential return is to changes in the underlying growth narrative.
Find undervalued stocks in less than 60 seconds with TIKR’s new Valuation Model (It’s free) >>>
Value Any Stock in Under 60 Seconds with TIKR
With TIKR’s new Valuation Model tool, you can estimate a stock’s potential share price in under a minute.
All it takes is three simple inputs:
- Revenue Growth
- Operating Margins
- Exit P/E Multiple
If you’re not sure what to enter, TIKR automatically fills in each input using analysts’ consensus estimates, giving you a quick, reliable starting point.
From there, TIKR calculates the potential share price and total returns under Bull, Base, and Bear scenarios so you can quickly see whether a stock looks undervalued or overvalued.
See a stock’s true value in under 60 seconds (Free with TIKR) >>>
Looking for New Opportunities?
- Discover which stocks billionaire investors are purchasing, so you can follow the smart money.
- Analyze stocks in as little as 5 minutes with TIKR’s all-in-one, easy-to-use platform.
- The more rocks you overturn… the more opportunities you’ll uncover. Search 100K+ global stocks, global top investor holdings, and more with TIKR.
Disclaimer:
Please note that the articles on TIKR are not intended to serve as investment or financial advice from TIKR or our content team, nor are they recommendations to buy or sell any stocks. We create our content based on TIKR Terminal’s investment data and analysts’ estimates. Our analysis might not include recent company news or important updates. TIKR has no position in any stocks mentioned. Thank you for reading, and happy investing!