Key Stats for Dollar General Stock
- Current Price: ~$105 (June 3, 2026)
- Q1 FY2027 Net Sales: $10.8B, +3.4% YoY
- Q1 FY2027 Adjusted EPS: $2.00, +12.4% YoY
- Q1 FY2027 EBIT Margin: 6%, +40 bps YoY
- Q1 FY2027 Same-Store Sales: +2.0%, traffic +1.4%
- FY2026 EPS Guidance (raised): $7.20–$7.45
- TIKR Model Price Target: ~$167
- Implied Upside: ~59%
Dollar General Stock Posts Q1 FY2027 EPS Beat as Operating Margin Expands 40 Basis Points

Dollar General Corporation (DG) reported Q1 FY2027 adjusted EPS of $2.00, beating the Street estimate of $1.89 by approximately 6% and extending the company’s operating leverage story despite a revenue result that came in just shy of consensus expectations.
Net sales rose 3.4% to $10.8B, with the gain driven by a 2% same-store sales increase that management described as broad-based across all four merchandise categories for the fifth consecutive quarter.
Customer traffic increased 1.4% in Q1, marking the fourth straight quarter of traffic growth and the metric most directly tied to Dollar General stock’s long-term value proposition of value and convenience in rural and underserved communities.
Todd Vasos, CEO, stated on the Q1 FY2027 earnings call that “EPS results exceeded our expectations as strong operating margin expansion more than offset the impact of severe weather and higher fuel costs,” framing the quarterly beat as a product of structural improvement rather than one-time timing.

Street consensus reflects that view: analysts project normalized EPS of $1.99 in Q2 FY2027, $2.00 in Q3, and $2.17 in Q4, a trajectory that implies continued earnings expansion through the fiscal year even as gross margin comparisons tighten in the back half.
Value Valley, the company’s 500-rotating-SKU program priced entirely at $1, posted a comp sales increase of 18.4%, outperforming the chain average and reflecting accelerated customer engagement with Dollar General’s most defensible price point as fuel prices remain elevated.
Delivery contributed approximately 70 basis points to the 2% same-store comp, with more than 80% of orders delivered within one hour, and the company announced plans to pilot a delivery subscription program later in 2026.
The remodel program advanced with 659 Project Renovate completions and 711 Project Elevate completions in Q1, on track for 2,000 and 2,250 respective projects in FY2026, targeting annualized comp lifts of 6% and 3% across the two programs.
Is Dollar General Stock Undervalued? What the TIKR Valuation Model Shows
TIKR’s base case values Dollar General stock at approximately $167 by January 2031, implying around 59% total return from the current price of approximately $105, or roughly 10% annualized over approximately 5 years.
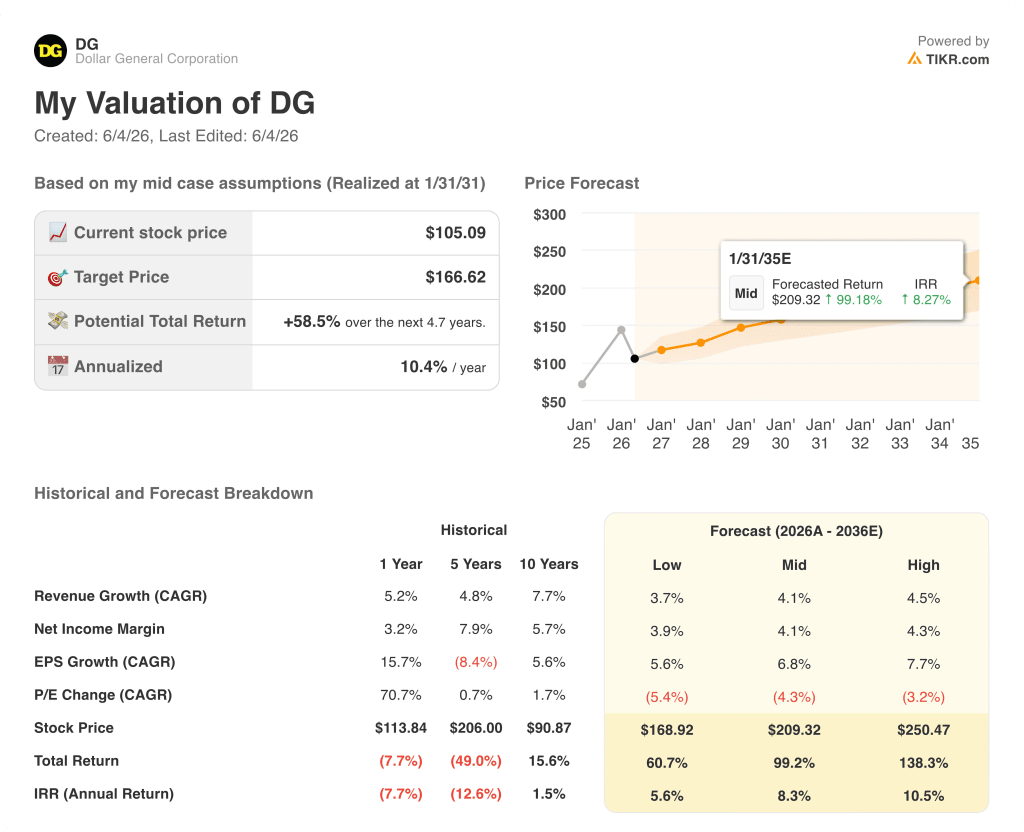
If Dollar General’s margin recovery trajectory holds and the business delivers the TIKR model’s mid-case revenue CAGR of approximately 4% with net income margins expanding toward 4%, the model targets approximately $209 by January 2036, implying roughly 99% total return and an annualized rate of around 8%.
Should the macro environment intensify pressure on core customers and comp growth stalls below the 2% threshold, the low-case scenario produces a target of approximately $169, representing around 61% total return at roughly 6% annualized.
If nonconsumable penetration accelerates, the DG Media Network scales to its 50 basis point gross margin contribution target on schedule, and the remodel programs drive sustained comp outperformance, the high case reaches approximately $250, implying around 138% total return at roughly 11% annualized.
How did Dollar General perform in Q1 FY2027 earnings?
Dollar General delivered adjusted EPS of $2.00, beating the Street estimate of $1.89 by approximately 6% and growing earnings 12.4% year-over-year.
Net sales reached $10.8B, up 3.4%, driven by 2% same-store sales growth and a fourth consecutive quarter of customer traffic gains at 1.4%.
Shrink mitigation and higher inventory markups were the primary gross margin drivers, with the company delivering 65 basis points of gross margin expansion even while lapping a 61 basis point improvement in the prior year.
Management raised full-year FY2026 EPS guidance to $7.20–$7.45, up from $7.10–$7.35.
Is Dollar General stock undervalued?
TIKR’s base case values Dollar General stock at approximately $167 by January 2031, implying around 59% total return from the current price of approximately $105, or roughly 10% annualized.
EBIT margin expanded 40 basis points to 5.9% in Q1 FY2027, continuing progress toward the company’s long-term 6% to 7% target, with five consecutive quarters of positive nonconsumable comp sales providing evidence the mix shift story is durable.
The key variable is shrink improvement sustainability: if the program continues delivering incremental expansion through harder laps in the back half, the base case gross margin assumptions hold and the path to the operating margin target remains open.
Should You Invest in Dollar General Corporation?
The only way to really know is to look at the numbers yourself. TIKR gives you free access to the same institutional-quality financial data that professional analysts use to answer exactly that question.
Pull up Dollar General Corporation stock and you’ll see years of historical financials, what Wall Street analysts expect for revenue and earnings in the quarters ahead, how valuation multiples have moved over time, and whether price targets are trending up or down.
You can build a free watchlist to track Dollar General Corporation alongside every other stock on your radar. No credit card required. Just the data you need to decide for yourself.
Access Professional Tools to Analyze DG stock on TIKR for Free →