
Key Takeaways
- CoreWeave’s Q2 2026 revenue more than doubled year over year to $2.6 billion and backlog hit $104.2 billion, yet adjusted operating income of $128 million came in below the $200 million CoreWeave posted a year earlier on far less revenue.
- Interest expense more than doubled year over year to $640 million in Q2 and is guided toward $860 million to $940 million in Q3, growing faster than the operating income CoreWeave points to as proof of margin inflection.
- Total debt roughly tripled in each of the last two fiscal years to $29.82 billion by the end of 2025, free cash flow burn deepened every year since 2022 to negative $7.25 billion, and EBITDA to interest coverage fell from 5.21x to 2.86x over that span.
- Management says CoreWeave front loads the burn by design and has already locked in nearly 300 basis points of lower borrowing costs, but the annual numbers have not yet shown that thesis paying off. That test arrives as the first contract cohorts mature.
CoreWeave’s own numbers show operating income still trailing its interest bill even as backlog swells. See how CoreWeave’s margin and coverage trends compare on TIKR for free →
Record Backlog, Record Debt: CoreWeave’s Q2 By the Numbers
CoreWeave’s (CRWV) second quarter looked, on its face, like exactly the kind of print that justifies the AI infrastructure buildout. Revenue reached $2.6 billion, up 112% year over year and 24% sequentially, beating the $2.56 billion analysts had modeled. Backlog closed the quarter at $104.2 billion, up 246% year over year, and that figure excludes more than $25 billion in new customer commitments signed in the first weeks of Q3. Management says contracts with delivery already underway account for more than half of that backlog, and expects that share to reach two thirds by year end.
The margin story looked encouraging too, at least sequentially. Adjusted operating income jumped from $21 million in Q1 2026 to $128 million in Q2, and CFO Nitin Agrawal told analysts contribution margins on contracts signed this quarter ran 5 to 10 percentage points above recent quarters, helped by the newer Vera Rubin GPU generation. CoreWeave raised full year revenue guidance to $12.4 billion to $13.2 billion and now expects to exit 2026 at an $18.5 billion to $19.5 billion annualized run rate.
CoreWeave’s Growth Story Meets a Faster-Growing Interest Bill
But the same quarter that produced that $128 million adjusted operating income also produced $640 million of interest expense, more than double the $267 million CoreWeave paid in Q2 2025. Net loss widened to $626 million from $290 million a year earlier, and adjusted net loss widened to $567 million from $130 million.
Measured against a year ago, adjusted operating income actually fell, from $200 million to $128 million, even as revenue more than doubled, because financing a much larger, much more indebted business cost more still. Guidance points to more of the same near term: CoreWeave expects Q3 interest expense of $860 million to $940 million, against a projected adjusted operating income of only $200 million to $260 million.
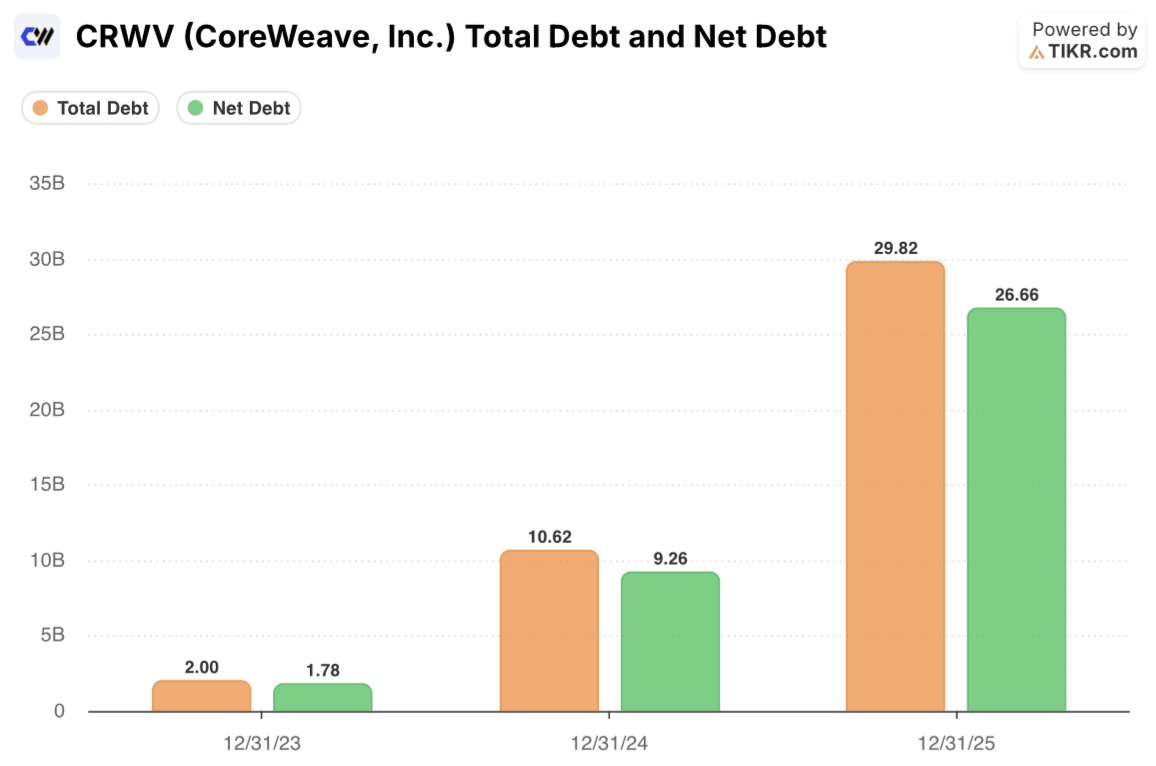
CoreWeave’s total debt grew from $2.00 billion at the end of 2023 to $10.62 billion at the end of 2024 to $29.82 billion at the end of 2025, roughly tripling in each of the last two years, with net debt following the same path to $26.66 billion.
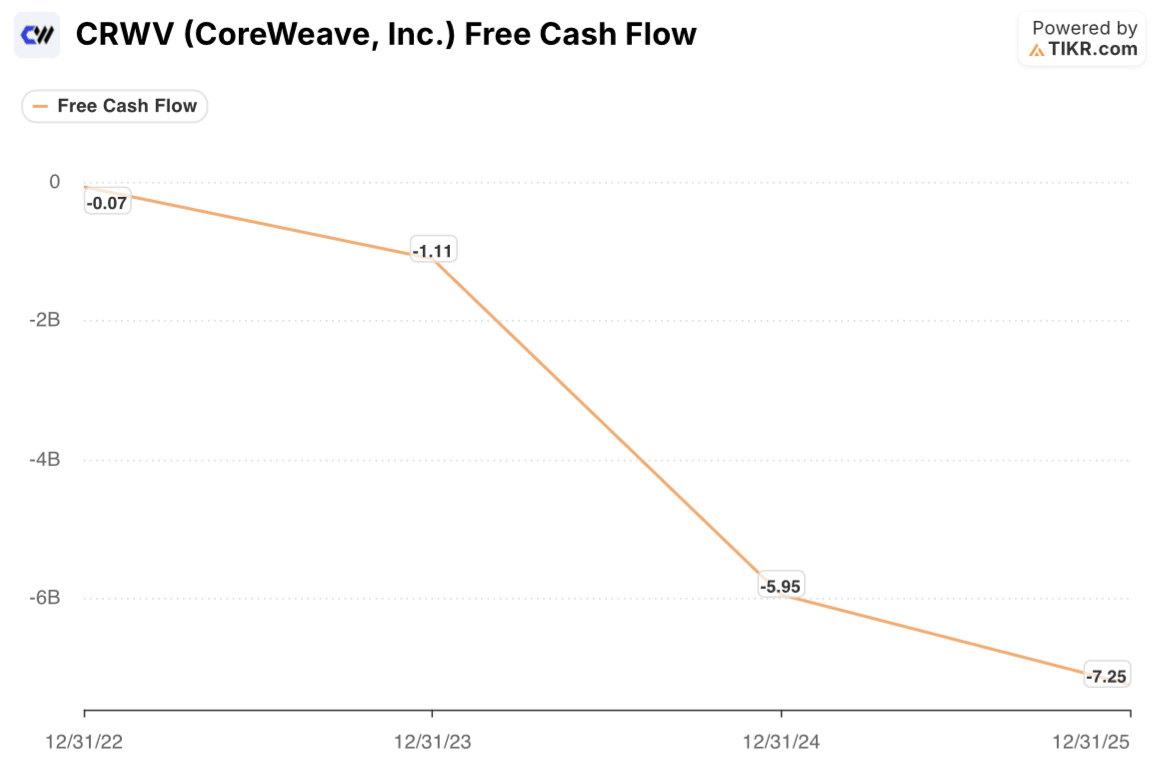
Free cash flow has moved the wrong direction every year on record: negative $70 million in 2022, negative $1.11 billion in 2023, negative $5.95 billion in 2024, and negative $7.25 billion in 2025.
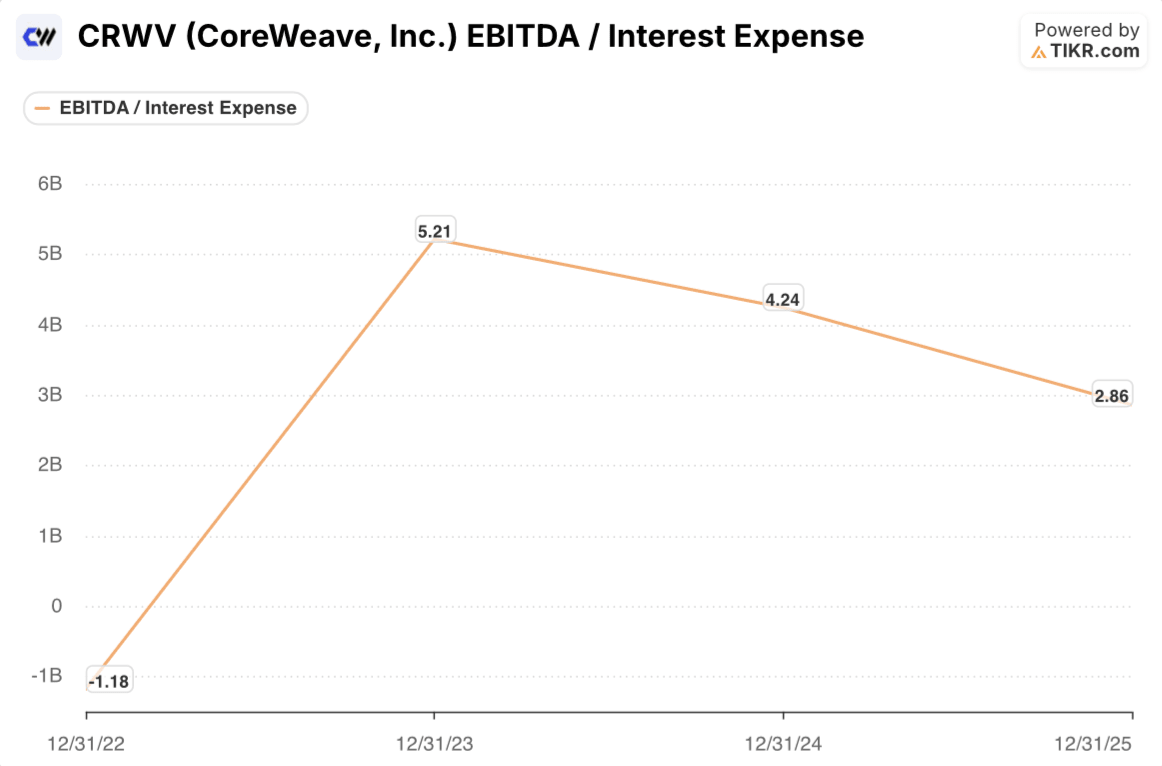
Meanwhile, EBITDA to interest coverage fell from 5.21x in 2023 to 4.24x in 2024 to 2.86x in 2025, even as EBITDA itself grew substantially in dollar terms.
CoreWeave generates more operating profit every year. It also takes on debt and interest costs fast enough that the cushion around that profit has shrunk for two straight years.
CoreWeave’s EBITDA to interest coverage fell from 5.21x to 2.86x in two years, even as EBITDA grew. Track that ratio and CoreWeave’s leverage trend on TIKR for free →
Why CoreWeave Says the Debt Burn Shouldn’t Worry CRWV Stock Holders
CoreWeave’s management has a specific answer for this. On the Q2 call, Agrawal walked through how the company underwrites each cluster. Capital expenditure is front loaded, financed with a mix of asset level debt, customer prepayments and corporate capital, and revenue only becomes predictable and cash generative once a cluster is delivered and its five year contract starts ramping. Much of CoreWeave’s debt sits at the special purpose vehicle level, secured by the offtake counterparty’s credit, which Intrator described at the Goldman conference as lenders effectively underwriting Microsoft, not CoreWeave’s own balance sheet. Once a cluster’s asset level debt is repaid, Agrawal said, CoreWeave is free to recontract or resell that unlevered capacity for incremental returns on top of what it has already earned.
There is also a genuine improvement buried in the numbers. CoreWeave says it has cut its weighted average cost of debt by nearly 300 basis points over the past year, worth roughly $1.1 billion in annualized interest savings, and its most recent term loan was the first underwritten against shorter, two to three year enterprise contracts rather than the standard five year hyperscaler deal. That widens the customer pool CoreWeave can finance and should eventually lower its blended cost of capital. None of that shows up yet in the annual free cash flow or coverage figures above, because those cohorts are still young. It is a real mitigant, but a claim about the future shape of the cost curve, not evidence the curve has already bent.
The Real Test Is Still Ahead, Not Behind
CoreWeave is not a company whose demand is in question. The backlog, the Anthropic and Perplexity agreements, the Caterpillar and Isomorphic Labs wins, and a Q2 print that beat on both revenue and margin all support that. What is genuinely unresolved is the race between two growing numbers: operating income, which management has shown can inflect quarter over quarter as newer, higher margin contracts season, and interest expense, set to keep climbing at least through Q3 as roughly $35 billion to $39 billion of full year capital expenditure gets financed. Two straight years of falling EBITDA to interest coverage and deepening free cash flow burn are the clearest evidence that, so far, the second number has grown faster than the first.
The condition that would resolve this in CoreWeave’s favor is specific and checkable. Adjusted operating income needs to keep expanding toward the low teens percentage margin management guided for Q4, while interest expense growth decelerates as the falling cost of debt takes hold and older, unlevered clusters start throwing off free cash flow instead of consuming it.
If Q3 and Q4 show operating income growth finally outpacing interest expense growth, the underwriting story management describes becomes visible in the numbers, not just the guidance. If interest expense keeps outrunning operating income into 2027, the gap between CoreWeave’s revenue growth and what reaches shareholders will keep widening, no matter how large the backlog gets.
The next signal to watch is simple: does CoreWeave’s operating income growth finally outpace its rising interest bill. Follow CoreWeave’s quarterly margin and leverage trend on TIKR for free →
Should You Invest in X?
The only way to really know is to look at the numbers yourself. TIKR gives you free access to the same institutional-quality financial data that professional analysts use to answer exactly that question.
Pull up X stock and you’ll see years of historical financials, what Wall Street analysts expect for revenue and earnings in the quarters ahead, how valuation multiples have moved over time, and whether price targets are trending up or down.
You can build a free watchlist to track X alongside every other stock on your radar. No credit card required. Just the data you need to decide for yourself.
Access Professional Tools to Analyze X stock on TIKR for Free →
Looking for New Opportunities?
- See what stocks billionaire investors are buying so you can follow the smart money.
- Analyze stocks in as little as 5 minutes with TIKR’s all-in-one, easy-to-use platform.
- The more rocks you overturn… the more opportunities you’ll uncover. Search 100K+ global stocks, global top investor holdings, and more with TIKR.
Disclaimer:
Please note that the articles on TIKR are not intended to serve as investment or financial advice from TIKR or our content team, nor are they recommendations to buy or sell any stocks. We create our content based on TIKR Terminal’s investment data and analysts’ estimates. Our analysis might not include recent company news or important updates. TIKR has no position in any stocks mentioned. Thank you for reading, and happy investing!