
Key Takeaways
- Microsoft’s free cash flow fell to $19.64 billion in the fiscal fourth quarter, down 23% from $25.57 billion a year earlier, even though operating cash flow grew 30% to $55.44 billion and revenue grew 18%.
- Cash capital expenditures roughly doubled between the back half of fiscal 2025 and the back half of fiscal 2026, from about $34 billion combined to nearly $67 billion, and that gap explains almost all of the free cash flow decline.
- Starting fiscal 2027, Microsoft is extending the useful life of its data centers and office buildings from 15 to 25 years, a change that lowers the capital expenditure figure management guides to without reducing the actual cash going out the door.
- Operating cash flow is still growing faster than revenue, which argues against a demand problem, but capital spending has been growing even faster, and free cash flow margin has slipped from the high 20% range to roughly 20% to 22%.
- Microsoft remains free cash flow positive, unlike Oracle, but it is also named among the hyperscalers that added to roughly $220 billion of AI related debt issued over the past year, which complicates the idea that its buildout is entirely self funded.
The Guidance Slide Says One Thing. The Cash Flow Statement Says Another.
On July 29, Microsoft (MSFT) closed out fiscal 2026 with quarterly revenue of $90 billion, up 18%. Azure grew 43%, accelerating from 41% the quarter before. Management guided Azure to roughly 45% growth in the first quarter of fiscal 2027, citing demand that continues to exceed available capacity.
Microsoft 365 Copilot crossed 30 million paid seats, with net seat additions more than doubling sequentially. CFO Amy Hood described a company still adding capacity as fast as it can build it, and full fiscal 2027 guidance calls for double digit revenue and operating income growth.
None of that is in dispute. But later in Hood’s remarks came a smaller, more technical disclosure. Starting fiscal 2027, Microsoft is extending the useful life of its data centers and office buildings from 15 to 25 years. Hood said this change “affects only the timing of future depreciation” and would have a “minimal benefit” to operating income.
The larger effect sits elsewhere. The change shifts more of Microsoft’s future data center leases from finance leases, which count as capital expenditures, to operating leases, which don’t. That’s part of why Hood revised her calendar year 2026 capital expenditure guidance down to approximately $175 billion, even while saying the underlying infrastructure spend hasn’t changed.

That distinction matters for anyone using Microsoft’s CapEx guidance as a gauge of what the AI buildout actually costs. The reported number can move for accounting reasons even when the cash spend does not.
Where the Cash Actually Went

The cash flow statement, which isn’t subject to the same lease reclassification, tells a cleaner story. Cash paid for property and equipment was $14.92 billion in the September 2024 quarter, then $15.80 billion, $16.75 billion, and $17.08 billion across the next three quarters, a gradual climb through fiscal 2025.
Then it broke higher. The September 2025 quarter came in at $19.39 billion, still a modest step up. The December 2025 quarter jumped to $29.88 billion, a 54% sequential increase, and spending held near that level for the next two quarters at $30.88 billion and $35.80 billion.
Put another way, Microsoft spent about $34 billion in cash capital expenditures across the March and June quarters of fiscal 2025 combined. The same two quarters in fiscal 2026 cost nearly $67 billion combined. That isn’t an accounting artifact. It’s cash leaving the business at roughly twice the prior rate.
Operating Cash Flow Is Still Strong. It Just Isn’t Keeping Pace.
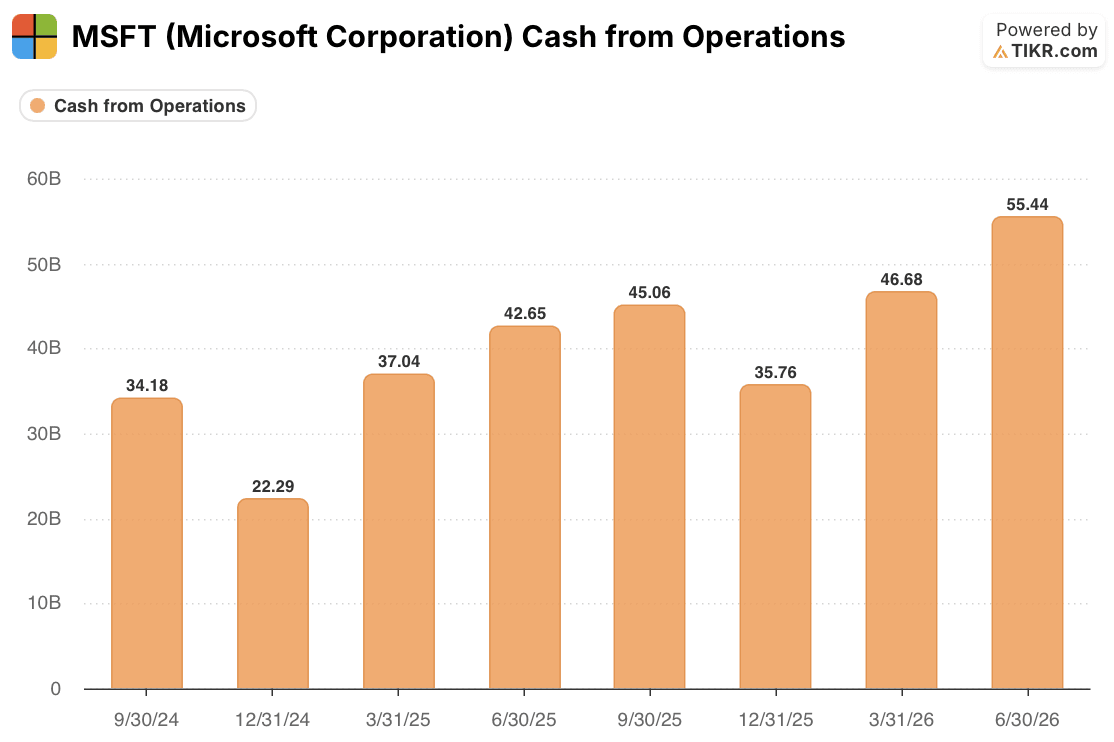
The revenue engine behind that spending looks healthy. Operating cash flow was $22.29 billion in the December 2024 quarter and $35.76 billion in the December 2025 quarter, a 60% increase in what is normally Microsoft’s weakest cash flow quarter of the year. Every other quarter in this two year window shows a similar or larger year over year gain.
That pattern argues against reading the free cash flow decline as a demand problem. Azure bookings, Copilot seat growth, and GitHub Copilot’s move to usage based pricing are converting into real operating cash, at a faster pace than revenue itself is growing.
The issue is that capital expenditure grew even faster. Free cash flow margin fell from 28.97% in the March 2025 quarter to 19.07% in the March 2026 quarter, a nearly 10 point drop. It fell from 9.32% to 7.24% in the December quarter across the same two years. Margin is compressing in both quarters TIKR shows a clean year over year match for, not just the dollar figure.
The June quarter shows the same pattern in dollars even without a confirmed prior year margin to compare. Free cash flow fell 23%, from $25.57 billion to $19.64 billion, while operating cash flow rose 30% over the same stretch. That’s a margin story, not a growth story, and it traces directly to capital spending outrunning the cash the business generates.
The Debt Question Attached to a Cash Flow Positive Company
Microsoft’s position still looks stronger than several of its AI infrastructure peers. Oracle reported negative free cash flow of $5.40 billion in its most recent quarter and has said it will raise $40 billion in debt and equity this fiscal year to fund its buildout. Neocloud operators such as CoreWeave carry tens of billions in liabilities against a business model that short seller Jim Chanos argues cannot earn its cost of capital.
Microsoft isn’t in that category. It generated $55.44 billion of operating cash flow in a single quarter and remains solidly free cash flow positive. But it isn’t entirely separate from the financing dynamics reshaping the sector either.
A recent Reuters analysis found that roughly $220 billion in debt has been issued by U.S. hyperscalers over the past year, including Alphabet, Amazon, Meta, Microsoft, and Oracle, and that the size of some of these bond deals has begun to distort how the market prices otherwise similar debt. Microsoft is named among the issuers in that wave, even though its balance sheet strength isn’t in question the way Oracle’s is.
The point isn’t that Microsoft faces financial risk. It’s that “self funded” is a weaker claim than it sounds when the company guiding to a $175 billion capital plan is also tapping the same debt markets its more leveraged peers depend on.
What Would Actually Change This Verdict
The evidence supports a narrower judgment than either the bull case, that accelerating Azure growth solves everything, or the bear case, that Microsoft is quietly becoming another debt funded neocloud. Microsoft’s operating business is compounding faster than its revenue, a genuinely strong signal. But free cash flow margin has fallen by as much as 10 percentage points in comparable quarters, and that compression tracks a real, cash based doubling in capital spending rather than a bookkeeping change.
The open question is whether this is a trough or a new normal. Hood’s own framing, that Microsoft will “remain free cash flow positive” in fiscal 2027, is a lower bar than investors have typically heard from this company, and it leaves room for further margin erosion if Azure capacity additions keep pace with the “demand exceeds supply” language management keeps repeating.
The next data point that would sharpen this call is Microsoft’s fiscal 2027 first quarter cash flow statement, expected in late October. Two things are worth watching. First, whether cash capital expenditure growth decelerates toward the pace implied by the $175 billion full calendar year guide, rather than continuing at the rate it climbed through the back half of fiscal 2026. Second, whether operating cash flow, aided by Copilot’s usage based billing and GitHub Copilot’s post June pricing change, grows fast enough to close the gap on its own.
Until that shows up, the more honest read on Microsoft right now is a company whose growth story is intact and whose cash conversion story is under real, measurable pressure, not a company quietly running out of room.
Should You Invest in Microsoft Corporation?
The only way to really know is to look at the numbers yourself. TIKR gives you free access to the same institutional-quality financial data that professional analysts use to answer exactly that question.
Pull up MSFT stock and you’ll see years of historical financials, what Wall Street analysts expect for revenue and earnings in the quarters ahead, how valuation multiples have moved over time, and whether price targets are trending up or down.
You can build a free watchlist to track MSFT alongside every other stock on your radar. No credit card required. Just the data you need to decide for yourself.
Access Professional Tools to Analyze MSFT stock on TIKR for Free →
Looking for New Opportunities?
- See what stocks billionaire investors are buying so you can follow the smart money.
- Analyze stocks in as little as 5 minutes with TIKR’s all-in-one, easy-to-use platform.
- The more rocks you overturn… the more opportunities you’ll uncover. Search 100K+ global stocks, global top investor holdings, and more with TIKR.
Disclaimer:
Please note that the articles on TIKR are not intended to serve as investment or financial advice from TIKR or our content team, nor are they recommendations to buy or sell any stocks. We create our content based on TIKR Terminal’s investment data and analysts’ estimates. Our analysis might not include recent company news or important updates. TIKR has no position in any stocks mentioned. Thank you for reading, and happy investing!