Key Stats for Occidental Stock
- Current Price: $61.46
- Target Price (Mid): ~$66
- Street Target: ~$67
- Potential Total Return: ~7%
- Annualized IRR: ~2% / year
Now Live: Discover how much upside your favorite stocks could have using TIKR’s new Valuation Model (It’s free) >>>
What Happened?
Occidental Petroleum (OXY) keeps drawing higher price targets, and the latest comes from a firm that spent last year as its harshest critic. On September 11, Evercore ISI raised its target to $70 from $65 while keeping an Outperform rating, putting it near the top of a Street that had OXY at $38 and Underperform as recently as October 2025. The direction of travel is clear: the consensus is slowly warming to a name it spent much of last year rating Hold.
Shares closed at $61.46, up about 45% since January and within a few dollars of a 52-week high of $67.45. And the biggest reason the stock is up here is not the analyst desk. It is crude: Brent crossed $100 a barrel again on September 9 as Middle East fighting intensified, and OXY rose with Exxon, Chevron, and ConocoPhillips. So the question the $70 target forces is whether the fundamentals have re-rated, or whether the Street is chasing an oil tape it does not control.
What the Higher Targets Are Actually Pricing
The bull case is the plan management laid out in August: new CEO Richard Jackson, in his second quarter running the company, put hard milestones behind a target to add over $4 billion of annual sustainable cash flow by 2030, and framed most of it as durable rather than price-dependent, with “approximately 85% to be achieved at even much lower prices.” The engine is a lower base decline rate, which management expects to fall from about 25% to 20% by 2030 as advanced recovery projects mature, cutting sustaining capital by roughly $900 million.
Head of international operations Ken Dillon pointed to Oman, where waterflooding has been used “to reduce declines from 19% to around 7% once complete, extending field lives,” the same technique Occidental is now bringing to the Gulf of America and its Permian assets. It is the kind of operational proof point that turns a former skeptic constructive.
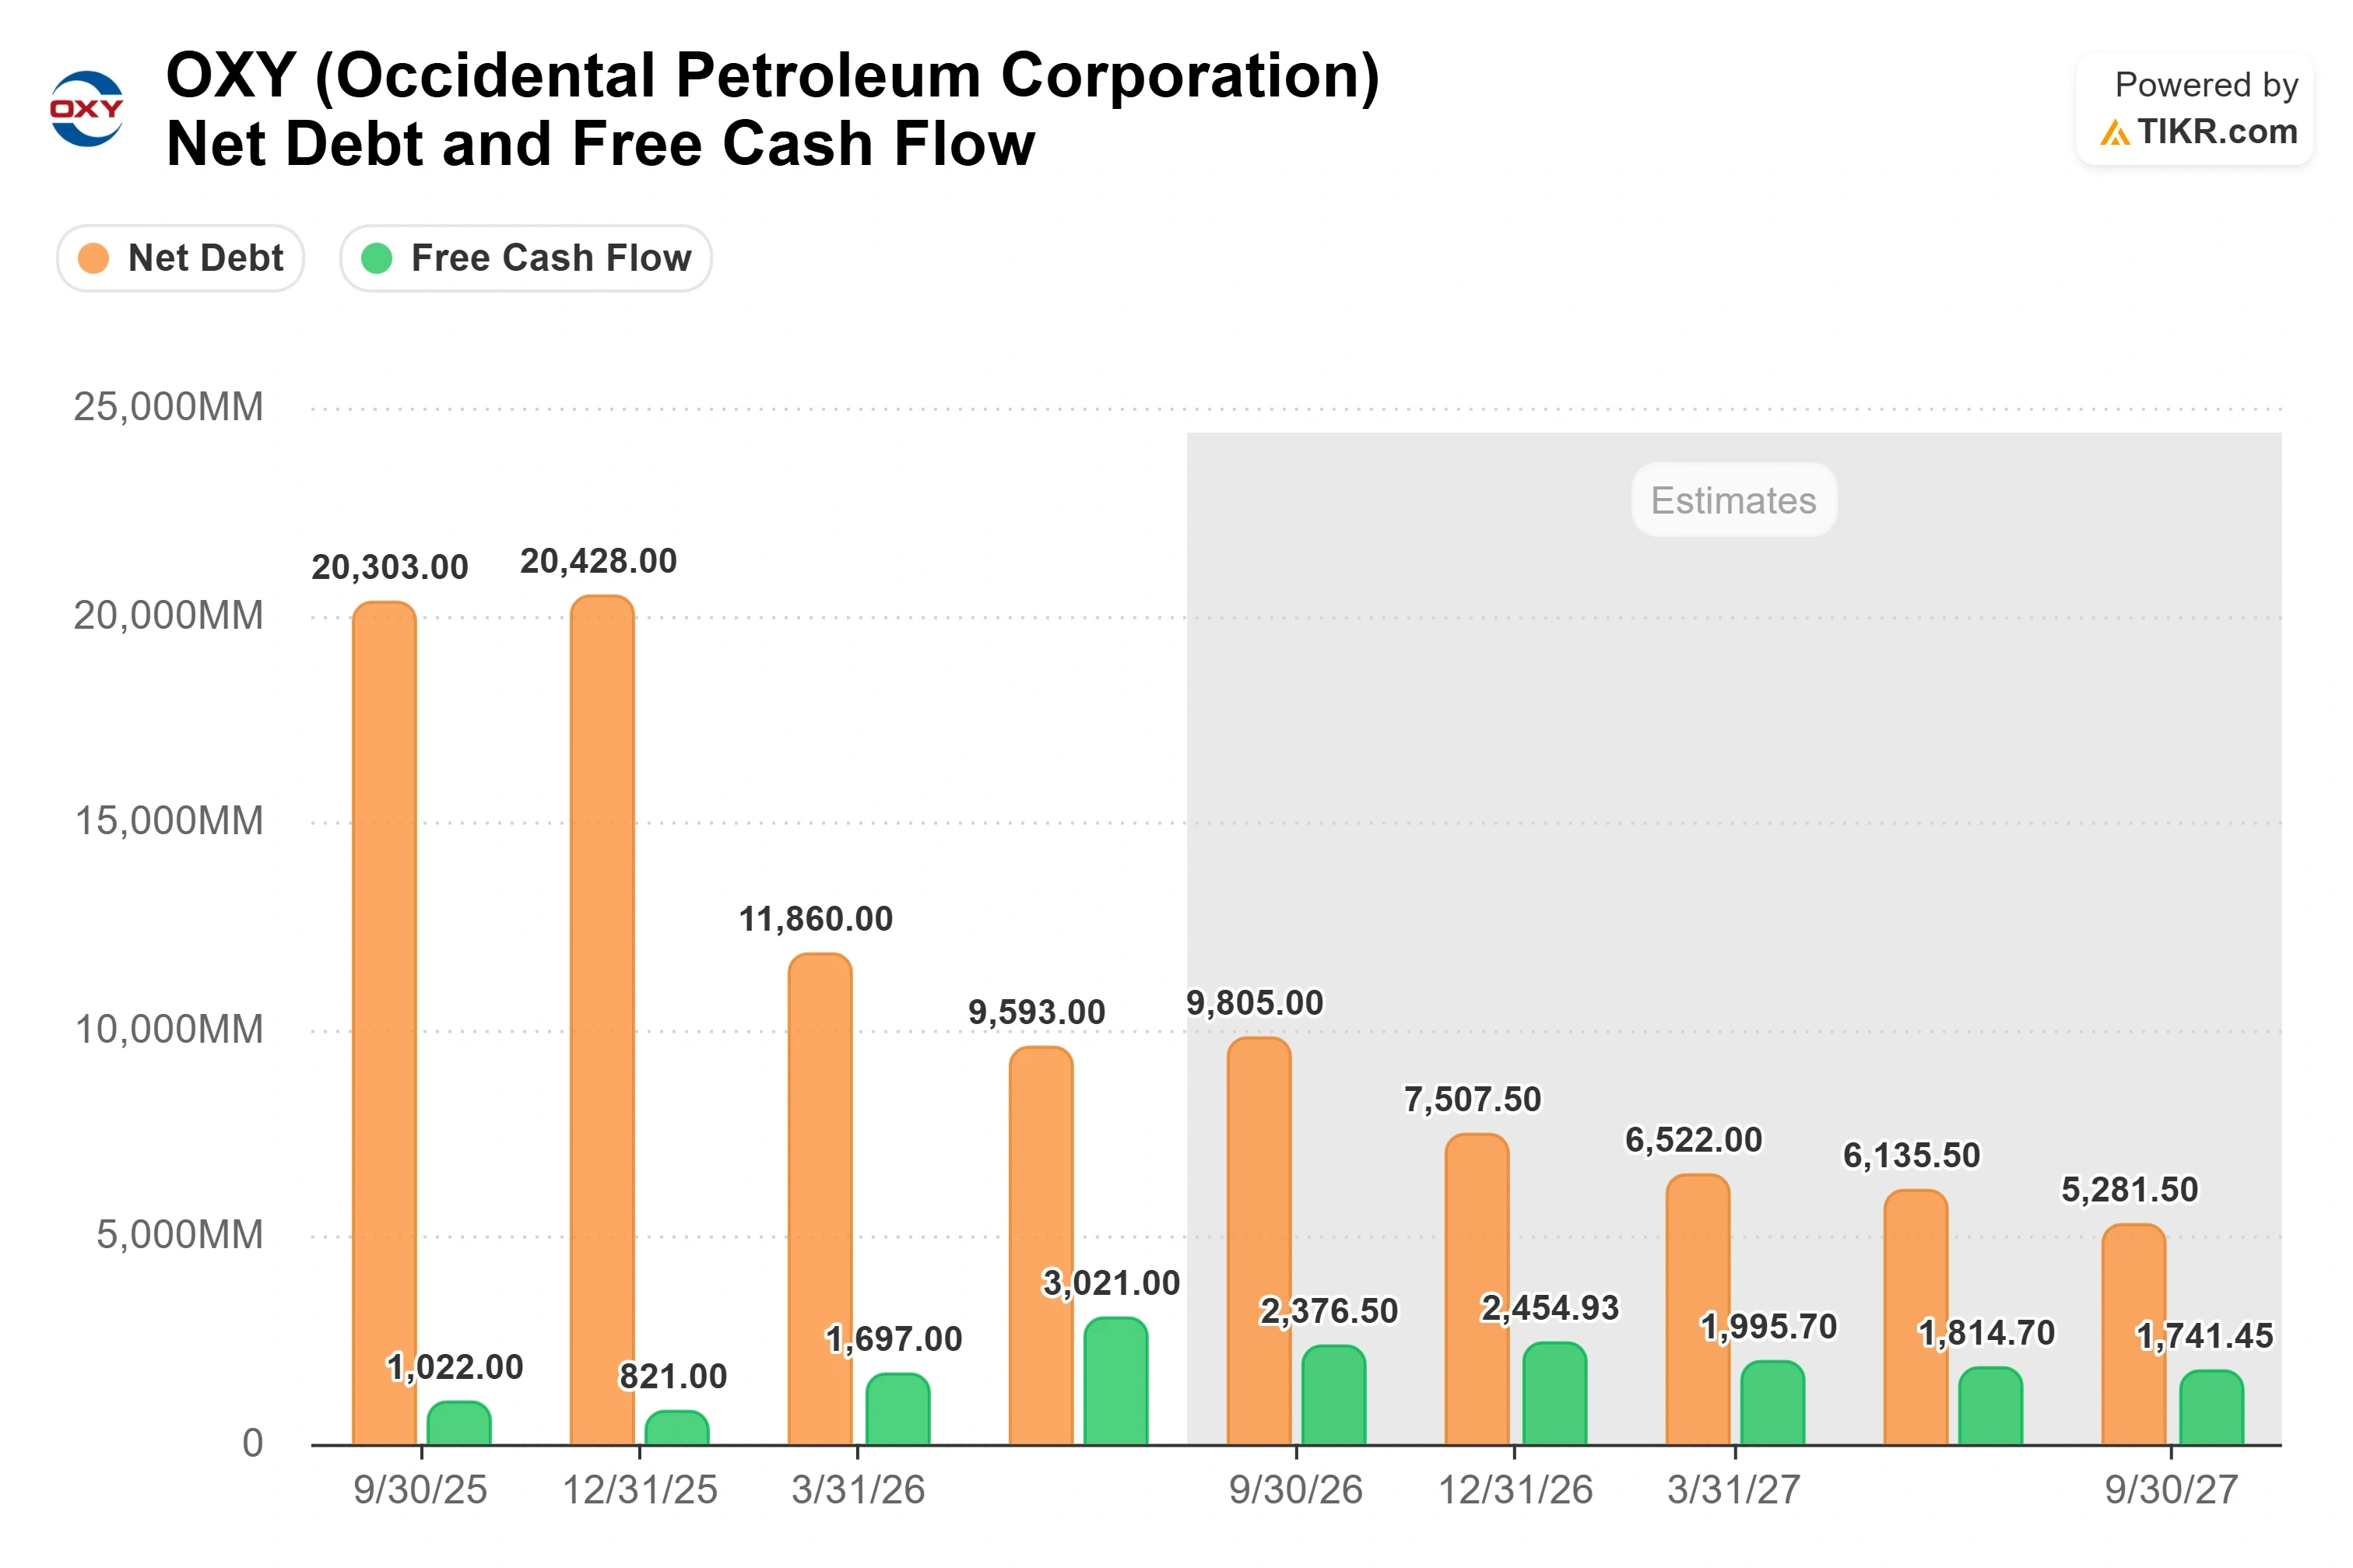
Occidental cut principal debt by $1.5 billion in the second quarter to $11.8 billion, its lowest since 2019, and has drawn a hard line at $10 billion as the next milestone, a level it expects to cut annual interest expense by roughly $740 million versus 2025. That progress funded an 8% dividend increase to $0.28 per share. On the Q2 call, though, CFO Sunil Mathew was blunt about what the milestone does not unlock yet: “Share repurchase actions will remain opportunistic and any continuous share buyback program will be a lower priority until the redemption of the preferred,” an equity stake not due until August 2029.

See historical and forward estimates for Occidental stock (It’s free!) >>>
Why the Stock Can Be Cheap and Still Capped
Set against the improvements is the risk that never leaves a producer this leveraged: it does not set its own price. The stock jumps on a geopolitical scare and falls when crude softens, and a durable slide would stretch the deleveraging timeline the higher targets assume. That leverage is why OXY looks inexpensive and stays that way. It trades near 5.3x NTM EV/EBITDA, a step below diversified names like Suncor at 7.29x and roughly in line with pure-play peers like TotalEnergies at 4.84x. For a producer carrying more balance-sheet risk than the majors, some discount is exactly what the numbers should show. The debate the $70 target reopens is whether falling debt earns a narrower one, or whether the market is right to keep pricing OXY as a levered bet on crude.
See how Occidental performs against its peers in TIKR (It’s free!) >>>
TIKR Advanced Model Analysis
- Current Price: $61.46
- Target Price (Mid): ~$66
- Potential Total Return: ~7%
- Annualized IRR: ~2% / year

See analysts’ growth forecasts and price targets for Occidental stock (It’s free!) >>>
Revenue drivers: steady Permian volumes and a growing, higher-margin Powder River Basin contribution (~1% revenue growth assumed).
Margin driver: the cost-and-interest savings program, lifting net income margin toward ~16%.
What holds the target down: roughly 6% a year of P/E compression, even as EPS compounds near 10%.
Primary risk: a sustained drop in oil prices that resets the entire cash flow base.
At ~$66, the model’s mid case sits just below Evercore’s $70, and the Street mean is near $67, which tells you the disagreement is narrow, not a gulf. The upside: hit the cost and decline targets while oil holds, and the model’s high case runs toward $101 by 2030, a total return near 64%. The downside: if crude rolls over, the mid case’s thin annual return can turn negative, because a low-multiple, price-taking producer has little to cushion the fall.
Conclusion
The next real test is the $10 billion principal-debt milestone. Management made it the trigger that shifts capital allocation, so hitting it before year-end would validate the pace the higher targets assume. Watch the Q3 report, expected in early November, for principal debt closing on that line and for any change in the buyback language now parked behind the 2029 preferred redemption. Debt at or near $10 billion with the dividend intact reads as the story working. A slip, most likely from a softer oil price, is what would prove the $70 optimism early.
See what stocks billionaire investors are buying so you can follow the smart money with TIKR.
Should You Invest in Occidental?
The only way to really know is to look at the numbers yourself. TIKR gives you free access to the same institutional-quality financial data that professional analysts use to answer exactly that question.
Pull up Occidental, and you’ll see years of historical financials, what Wall Street analysts expect for revenue and earnings in the quarters ahead, how valuation multiples have moved over time, and whether price targets are trending up or down.
You can build a free watchlist to track Occidental alongside every other stock on your radar. No credit card required. Just the data you need to decide for yourself.
Analyze Occidental on TIKR Free →
Looking for New Opportunities?
- See what stocks billionaire investors are buying so you can follow the smart money.
- Analyze stocks in as little as 5 minutes with TIKR’s all-in-one, easy-to-use platform.
- The more rocks you overturn… the more opportunities you’ll uncover. Search 100K+ global stocks, global top investor holdings, and more with TIKR.
Disclaimer:
Please note that the articles on TIKR are not intended to serve as investment or financial advice from TIKR or our content team, nor are they recommendations to buy or sell any stocks. We create our content based on TIKR Terminal’s investment data and analysts’ estimates. Our analysis might not include recent company news or important updates. TIKR has no position in any stocks mentioned. Thank you for reading, and happy investing!