Key Takeaways:
- Constellation Energy is the largest pure play nuclear operator in the United States, with 32,400 megawatts of generating capacity across five regions. Vistra is a Texas-based integrated power and retail electricity company with nearly 38,700 megawatts of capacity and around 4.3 million customers across 20 states. Both have emerged as premier AI electricity demand plays, but they serve that theme from very different business models.
- Analysts expect both companies to grow revenues at a solid pace, with VST targeting a forward two-year revenue CAGR of around 18% and CEG at around 15%. Both generated around $1.3B in free cash flow in 2025, and operating margins for both sat around 12% for the full year.
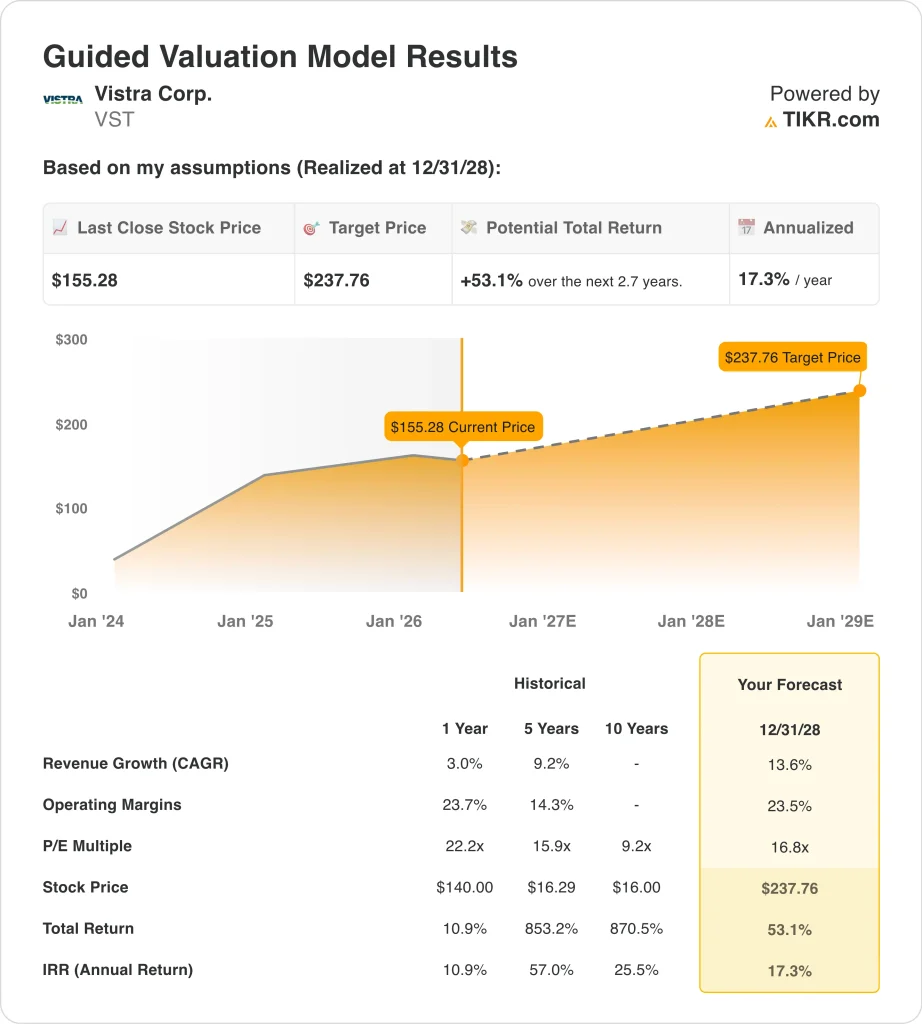
- Based on our valuation assumptions, VST stock could rise from $155 to around $238 per share by December 2028, a 53% total return or around 17% annualized. CEG could rise from $308 to around $403 per share in the same period, a 31% total return or around 11% annualized, so VST is the more aggressive return scenario at current prices.
Now Live: Discover how much upside your favorite stocks could have using TIKR’s new Valuation Model (It’s free)>>>
What’s Happening?
Power demand in the United States is growing at a pace not seen in decades. AI data centers are consuming electricity at historic rates. Utilities with reliable baseload capacity are now in high demand. Constellation Energy and Vistra are two companies best positioned to capture that shift.
Constellation Energy (CEG) is the country’s largest pure play nuclear operator. It generates and sells electricity through five regional segments. Vistra (VST) is a broader energy business. It combines power generation with retail electricity services for around 4.3 million customers across 20 states. Both own nuclear assets, but Vistra also relies on natural gas, coal, solar, and battery storage.
Investors rewarded both stocks heavily over the past two years. But both have since pulled back significantly from their annual highs. That pullback has created a new conversation about which name offers better value today. Here’s why both companies are worth examining closely right now.
Estimate a company’s fair value instantly (Free with TIKR) >>>
Revenue Is Growing for Both, but Free Cash Flow Tells a Story
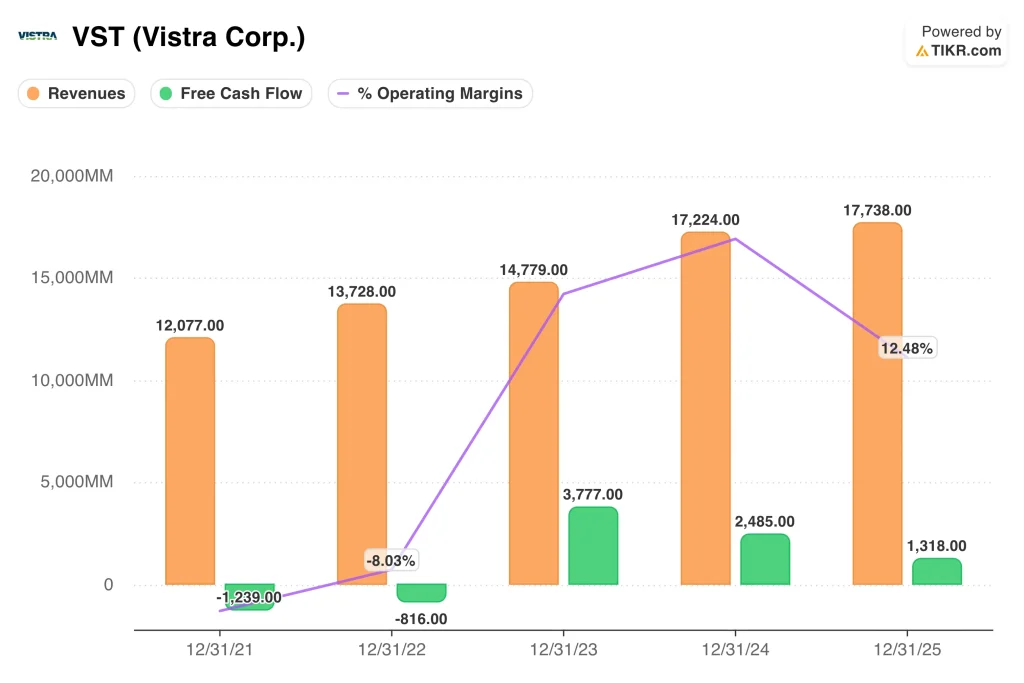
Vistra has grown its revenue from $12.1B in 2021 to $17.7B in 2025. That is consistent growth for a large-scale power company. But the operating margin story is more volatile. Margins turned deeply negative in 2022, hitting around negative 8%, as energy commodity prices moved sharply against the company.
By 2025, VST had recovered to an operating margin of around 12.5%. Free cash flow has also been uneven. The company posted $3.8B in FCF in 2023, but that figure fell to $2.5B in 2024 and then to $1.3B in 2025. So cash generation has declined even as revenue has grown. But analysts project VST’s forward two-year revenue CAGR at around 18%.
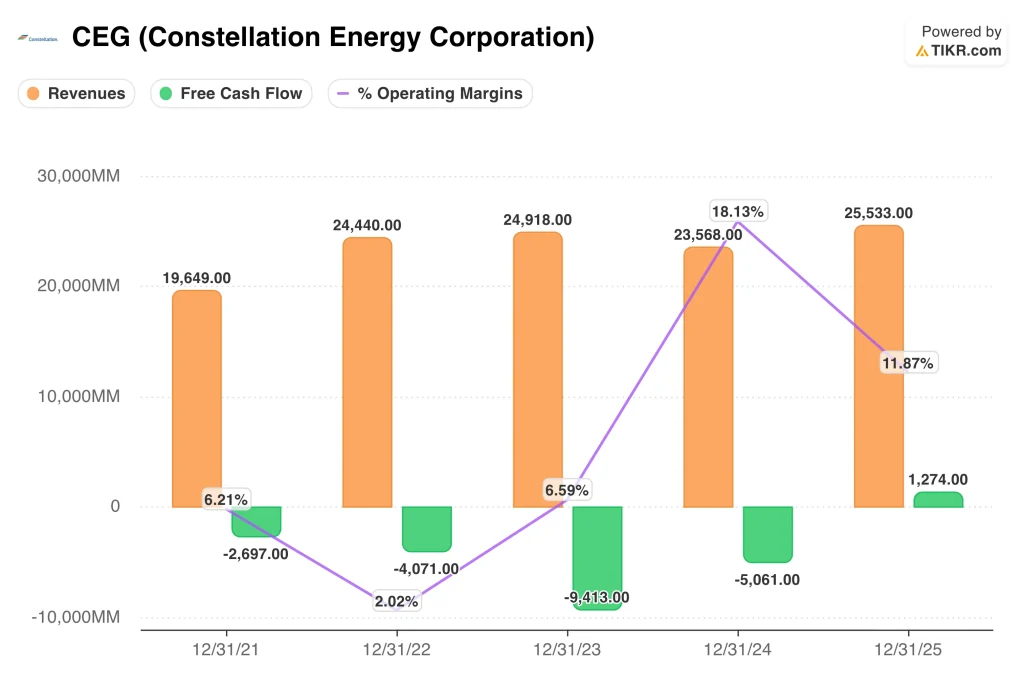
Constellation’s revenue picture is similarly uneven. Revenue reached $24.9B in 2023, dipped to $23.6B in 2024, and then recovered to $25.5B in 2025. But the operating margin trajectory is where the real story lies. CEG’s operating margins were only around 2% in 2022 before surging to 18% in 2024.
By 2025, those margins compressed back to around 12%, and free cash flow finally turned positive at $1.3B. Constellation generated negative free cash flow from 2021 through 2024, driven by heavy capital investment in nuclear maintenance. That investment cycle is now moderating. Analysts project CEG’s forward two-year revenue CAGR at around 15%.
Looking across both companies, the contrast in free cash flow trajectories is striking. Both generated around $1.3B in FCF in 2025, but they arrived there from very different directions. VST came down from a peak of $3.8B in 2023, while CEG turned FCF positive for the first time in years.
Vistra’s forward free cash flow yield stands at around 7.2%, while CEG’s is around 3.8%. That gap reflects the market’s view that VST generates more cash relative to its market cap. But it also reflects the higher risk embedded in VST’s more leveraged business model. So the free cash flow picture today does not fully capture what either business could look like in two to three years.
See what analysts think about CEG and VST stock right now (Free with TIKR) >>>
CEG Carries a Premium Multiple. VST Trades at a Discount. Here Is What the Gap Really Means.
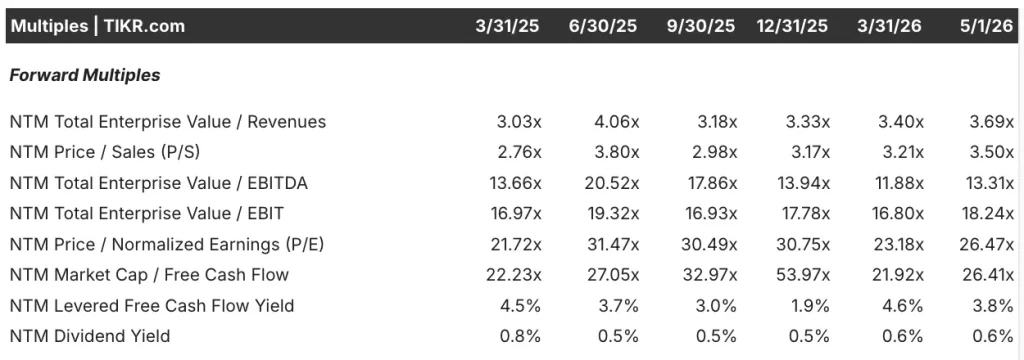
Constellation Energy trades at a forward P/E of around 26x and a forward EV/EBITDA of around 13x as of May 2026. Those are not utility multiples. Investors are pricing CEG as a premium clean energy infrastructure asset. The NRC recently renewed operating licenses at its Clinton and Dresden clean energy centers, extending those assets’ value for decades.
CEG also commands a forward market cap to free cash flow multiple of around 26x. That is elevated but reflects the contracted nature of its revenue base. So the premium is not irrational, but it does mean CEG offers less room for further multiple expansion. The stock’s 15.8% year-to-date decline suggests the market is already recalibrating expectations.
Vistra trades at a notably lower valuation across almost every metric. The forward P/E is around 18x, and the forward EV/EBITDA sits at around 10x as of May 2026. That discount reflects several genuine differences. VST carries far more debt, with net debt of around $19.6B versus CEG’s roughly $5.9B.
But that lower valuation also means VST is pricing in less of the AI electricity thesis than CEG is. The forward free cash flow yield for VST is around 7.2%, compared to just 3.8% for CEG. That yield gap is meaningful. And it suggests VST is generating more cash relative to its size, even at today’s reduced cash flow levels.
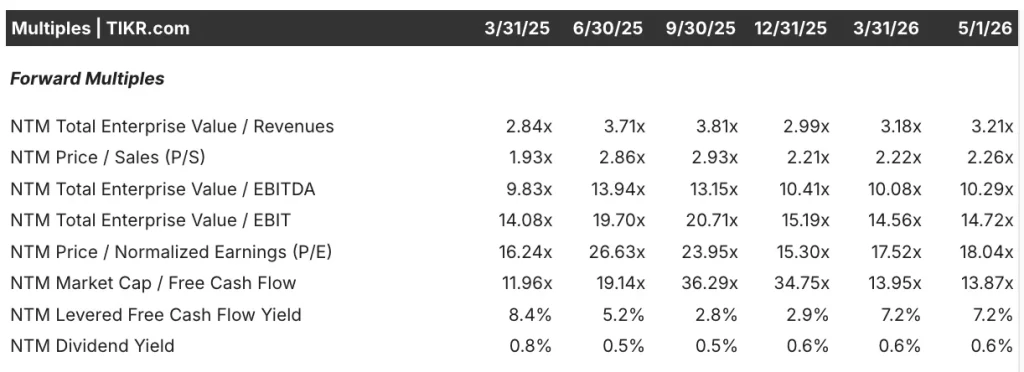
CEG’s forward P/E peaked at around 31x in mid-2025 before compressing to around 26x today. VST’s forward P/E peaked at around 27x and has since declined to around 18x. So both stocks have gone through significant multiple compression. But that also means both are pricing in less optimism than a year ago, which could represent a better entry point for long-term investors.
See analysts’ full growth forecasts and estimates for CEG and VST stock (It’s free) >>>
The Valuation Models Give VST the Edge on Return Potential
We analyzed the upside potential for Vistra stock based on the company’s growing AI-driven power agreements and its ongoing expansion of generation capacity across multiple fuel types.
Based on estimates of 14% annual revenue growth, 24% operating margins, and a normalized P/E multiple of around 17x, the model projects Vistra stock could rise from $155 to around $238 per share by December 2028.
That would be a 53% total return, or a 17% annualized return over the next 2.7 years.
We analyzed the upside potential for Constellation Energy stock based on the company’s irreplaceable nuclear fleet, its growing portfolio of contracted corporate power agreements, and its plan to restart Three Mile Island.
Based on estimates of 12% annual revenue growth, 18% operating margins, and a normalized P/E multiple of around 26x, the model projects Constellation Energy stock could rise from $308 to around $403 per share by December 2028.
That would be a 31% total return, or an 11% annualized return over the next 2.7 years.
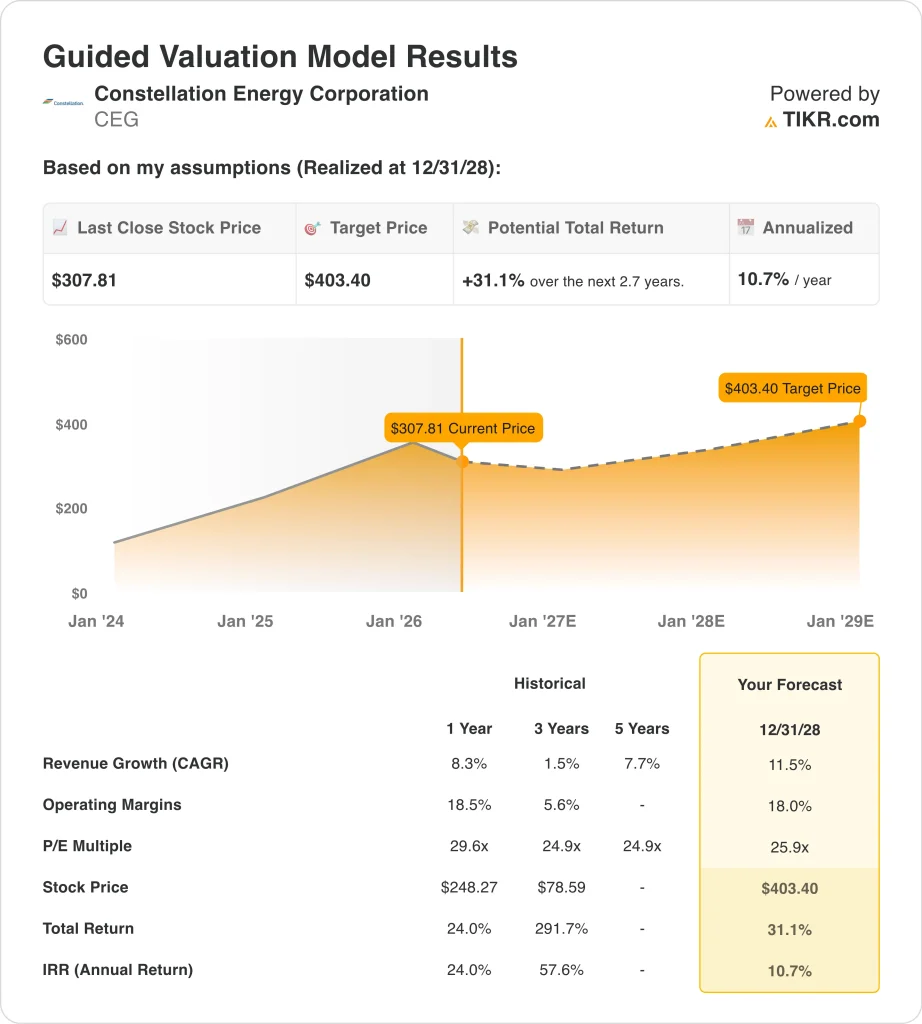
Based on analysts’ consensus estimates, we see Vistra offering the more aggressive return potential of the two at current prices. VST’s 17% annualized projected return is well above the 15% threshold that typically signals an undervalued or high-growth opportunity. CEG’s 11% annualized return is solid and suggests the stock is reasonably priced, but it implies less upside cushion for investors.
Build your own Valuation Model to value any stock (It’s free!) >>>
Which One Do You Actually Buy?
Both Constellation Energy and Vistra are legitimate beneficiaries of the AI electricity boom. CEG is the cleaner and more defensible nuclear play of the two. The company has the largest U.S. nuclear fleet, and the NRC recently renewed operating licenses at its Clinton and Dresden clean energy centers. CEG also carries much less debt than Vistra, with net debt of around $5.9B.
But CEG guided 2026 earnings below analyst estimates, which disappointed the market in late March. And at a forward P/E of around 26x, CEG is priced for continued flawless execution. So CEG is a high-quality business, but the current valuation reflects a great deal of optimism already built in.
Vistra offers a different proposition. The company presents more return potential at a lower valuation. The Fitch upgrade to investment grade in March 2026 was a meaningful vote of confidence in VST’s financial trajectory. And the company beat Q4 2025 adjusted EBITDA estimates on the strength of AI-driven data center demand. But VST’s net debt load of around $19.6B is a real risk that investors need to factor in carefully.
The two stocks appeal to different kinds of investors. CEG suits investors who want a premium nuclear pure play with a strong balance sheet and predictable contracted revenue. VST is a better fit for investors who want the same AI electricity exposure at a cheaper valuation and are willing to accept higher leverage.
Going forward, both companies should benefit as AI-driven electricity demand continues to strain the U.S. grid, but VST offers more total upside for investors willing to accept a higher-risk profile.
See a stock’s true value in under 60 seconds (Free with TIKR) >>>
Should You Invest in Constellation Energy or Vistra?
The only way to really know is to look at the numbers yourself. TIKR gives you free access to the same institutional-quality financial data that professional analysts use to answer exactly that question.
Pull up CEG or VST, and you’ll see years of historical financials, what Wall Street analysts expect for revenue and earnings in the quarters ahead, how valuation multiples have moved over time, and whether price targets are trending up or down.
You can build a free watchlist to track CEG or VST alongside every other stock on your radar. No credit card required. Just the data you need to decide for yourself.
Analyze Constellation Energy and Vistra stock on TIKR Free→
Looking for New Opportunities?
- See what stocks billionaire investors are buying so you can follow the smart money.
- Analyze stocks in as little as 5 minutes with TIKR’s all-in-one, easy-to-use platform.
- The more rocks you overturn… the more opportunities you’ll uncover. Search 100K+ global stocks, global top investor holdings, and more with TIKR.
Disclaimer:
Please note that the articles on TIKR are not intended to serve as investment or financial advice from TIKR or our content team, nor are they recommendations to buy or sell any stocks. We create our content based on TIKR Terminal’s investment data and analysts’ estimates. Our analysis might not include recent company news or important updates. TIKR has no position in any stocks mentioned. Thank you for reading, and happy investing!