Key Stats for Compass Stock
- Past week’s performance: -8.7%
- 52-week range: $5.66 to $13.96
- Valuation model target price: $14
- Implied upside: 94.3% over 2.7 years
Value your favorite stocks like Compass with 5 years of analysts’ forecasts using TIKR’s new Valuation Model (It’s free) >>>
What Happened?
Compass, Inc. (COMP) shares fell about 8.7% this week, with the stock closing near $7 by May 1. That drop pushed COMP more than 30% below where it started 2026. Investors are focused on Q1 2026 results, due May 5, and the stock is pricing in real uncertainty. So the week’s decline reflects broader caution rather than a single negative event.
Compass recently took a 51% controlling stake in a new strategic venture and set a 30-month plan to repay the associated debt. And earlier this year, Compass and Rocket formed a three-year strategic alliance to expand home listing inventory. That partnership is designed to drive more listings through the Compass platform and boost agent productivity. But the market is also weighing those moves against rising legal pressure.
A federal court ruled in March that Compass and other home brokerages must face a buyers’ price-fixing lawsuit. Compass did clear one overhang by dismissing its own case against Zillow after the so-called Zillow ban was reversed. But the unresolved price-fixing case continues to weigh on investor sentiment.
If COMP stock is to recover toward the analyst consensus target near $13, the company needs a strong Q1 report and encouraging Rocket alliance commentary.
See analysts’ growth forecasts and price targets for Compass (It’s free) >>>
Is Compass Stock Undervalued?
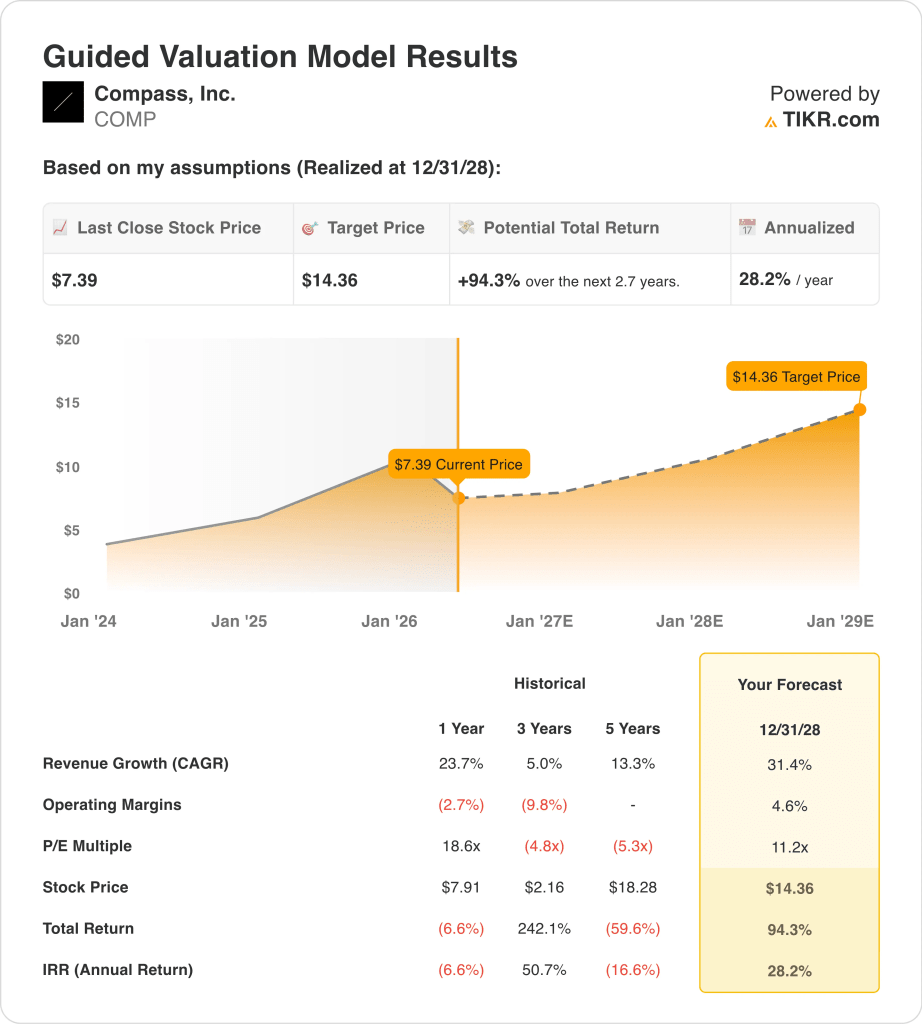
Under valuation model assumptions realized through 12/31/28, the stock is modeled using:
- Revenue growth (CAGR): 31.4%
- Operating Margins: 4.6%
- Exit P/E Multiple: 11.2x
Based on these inputs, the model estimates a target price of $14, implying 94.3% total upside from the current share price and a 28.2% annualized return over the next 2.7 years.
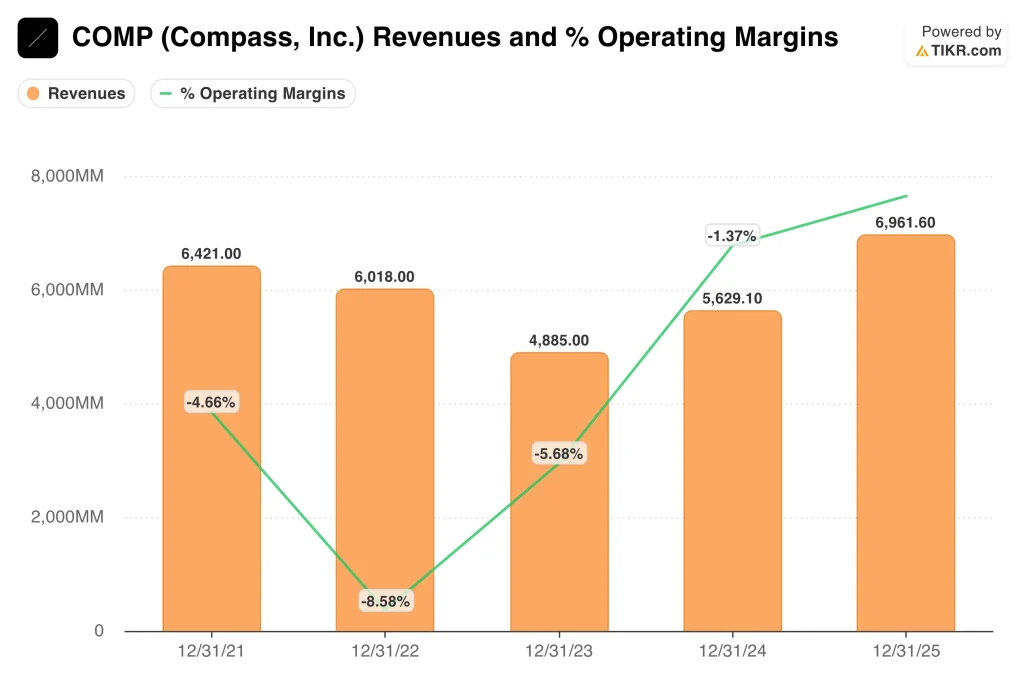
Those assumptions require meaningful revenue acceleration. Compass delivered 23.1% Q4 revenue growth to $1.70B, so the direction is encouraging.
But reaching a 31.4% annual growth rate through 2028 will require a durable housing recovery and consistent agent share gains. And the 4.6% operating margin target reflects a company still in the early stages of building consistent profitability.
The 11.2x exit P/E multiple is modest by technology standards, but it is appropriate here. Compass operates as a real estate brokerage with technology features, so it does not command the same multiples as a pure software business.
The current stock at $7 sits well below the street consensus target near $13, and analysts maintain a Buy consensus. So the market is pricing in execution risk, and closing that gap depends on the company’s ability to deliver on its growth plan.
What’s Driving Compass Stock Going Forward?
The most immediate catalyst is Q1 2026 earnings on May 5. Analysts will closely watch agent count trends, top-line revenue, and any updates on the Rocket alliance. Because the stock is already well below analyst targets, a strong Q1 report could spark a sharp price recovery.
The Rocket strategic alliance is a meaningful longer-term driver. By jointly expanding home listing inventory, both companies aim to grow transaction volume and attract high-performing agents to the platform.
And if the alliance scales as planned, it could help Compass close the gap between its brokerage operations and its technology ambitions. But investors will want concrete early evidence before fully pricing in that upside.
Real estate market conditions are the most important external variable for Compass. Mortgage rates have stayed elevated, and any meaningful decline would create a significant tailwind for residential transaction volume.
The unresolved price-fixing lawsuit is also a risk, because an adverse ruling would create financial liability and distract management. And ongoing growth through the Century 21 subsidiary could add incremental revenue as the broader real estate market recovers.
Estimate a company’s fair value instantly (Free with TIKR) >>>
Should You Invest in Compass?
The only way to really know is to look at the numbers yourself. TIKR gives you free access to the same institutional-quality financial data that professional analysts use to answer exactly that question.
Pull up COMP, and you’ll see years of historical financials, what Wall Street analysts expect for revenue and earnings in the quarters ahead, how valuation multiples have moved over time, and whether price targets are trending up or down.
You can build a free watchlist to track COMP alongside every other stock on your radar. No credit card required. Just the data you need to decide for yourself.
Analyze Compass stock on TIKR Free→
Looking for New Opportunities?
- See what stocks billionaire investors are buying so you can follow the smart money.
- Analyze stocks in as little as 5 minutes with TIKR’s all-in-one, easy-to-use platform.
- The more rocks you overturn… the more opportunities you’ll uncover. Search 100K+ global stocks, global top investor holdings, and more with TIKR.
Disclaimer:
Please note that the articles on TIKR are not intended to serve as investment or financial advice from TIKR or our content team, nor are they recommendations to buy or sell any stocks. We create our content based on TIKR Terminal’s investment data and analysts’ estimates. Our analysis might not include recent company news or important updates. TIKR has no position in any stocks mentioned. Thank you for reading, and happy investing!