Raw financial numbers can be misleading when you’re comparing two companies of different sizes. A business generating $50 billion in revenue will naturally show larger absolute figures across every line of the income statement than one doing $5 billion. That doesn’t tell you which business is better run, more profitable, or more efficiently structured. To answer those questions, you need a different lens.
Common-size financial statements solve this by expressing every line item as a percentage of a base figure rather than as a dollar amount. On the income statement, every line becomes a percentage of revenue. On the balance sheet, every line item is expressed as a percentage of total assets. The dollar amounts disappear, and what remains is pure structure, making it possible to compare a mega-cap with a mid-cap on equal footing.
It’s one of the more underused tools in fundamental analysis, which is surprising given how much clarity it adds. Once you start reading financials in percentage terms, certain things become immediately obvious that a table of dollar figures would obscure entirely.
Common-size statements strip out the noise of scale and show you the actual structure of a business, which is often where the most useful comparisons begin.
Find out what a stock’s really worth in under 60 seconds with TIKR’s new Valuation Model (It’s free)>>>
The Income Statement: Margins as the Story
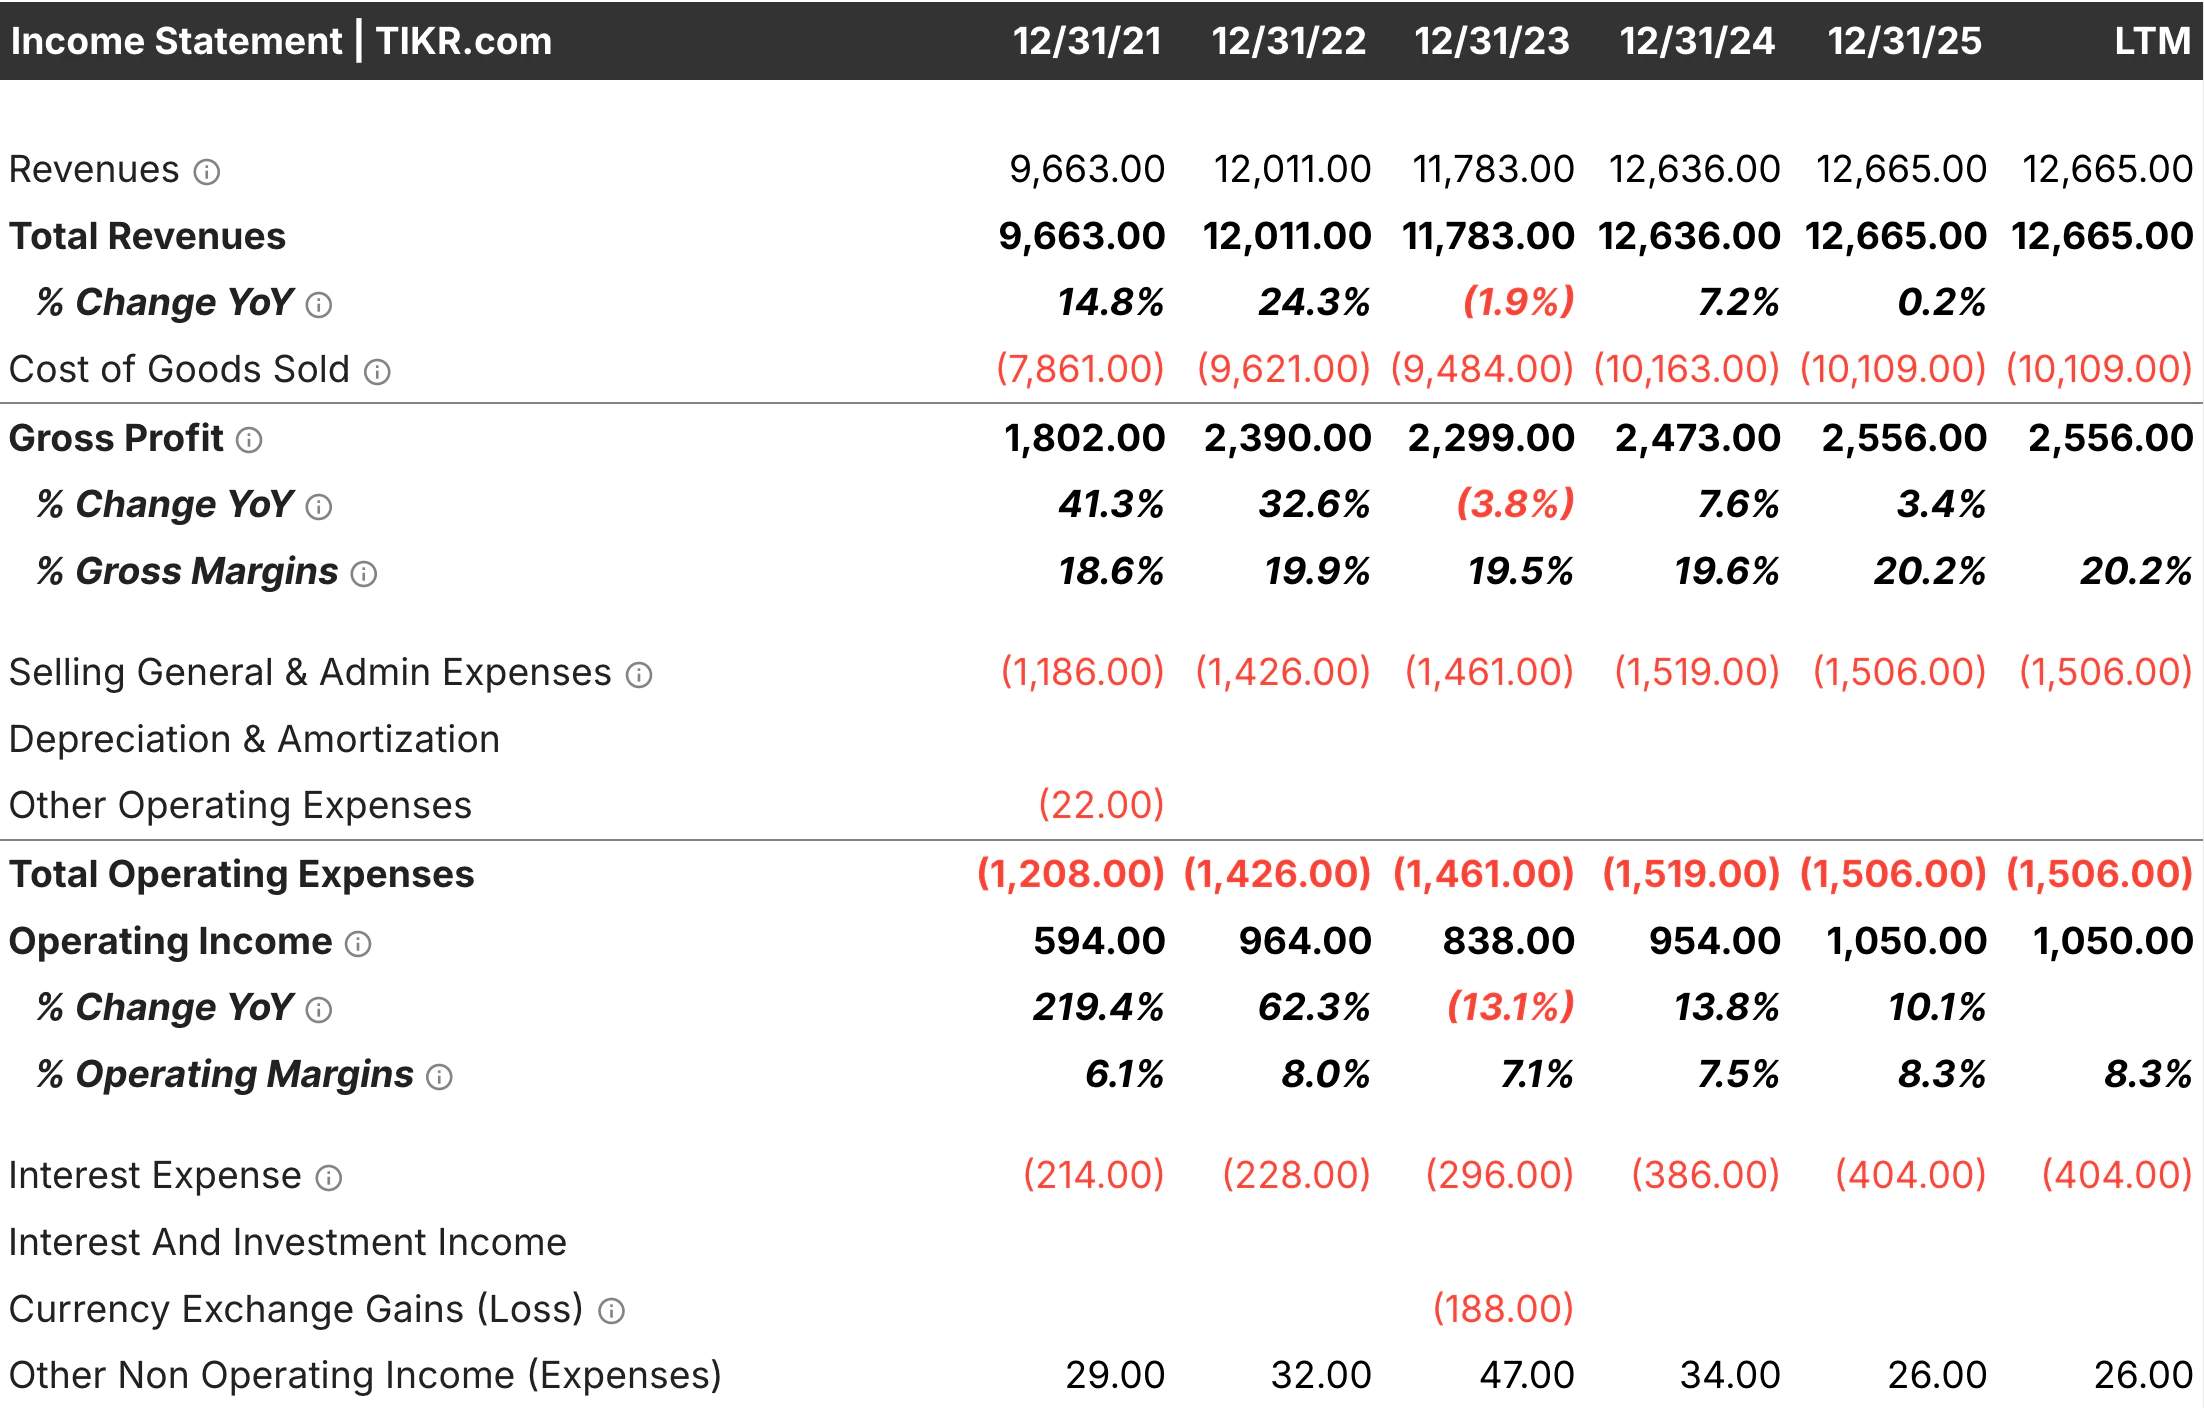
On a common-size income statement, every line item is expressed as a percentage of total revenue. Gross profit becomes gross margin. Operating expenses become a share of the top line. Net income becomes net margin. You already think about some of these instinctively, but applying this framework to every single line creates a much fuller picture.

The most immediate use is margin comparison. Take two companies in the same industry. One generates $10 billion in revenue with a 60% gross margin. The other generates $2 billion with a 45% gross margin. The smaller company might look less impressive on an absolute basis, but the margin structure tells a very different story about cost efficiency, pricing power, and the scalability of the business model.
What’s more useful is watching these percentages over time for a single company. If the cost of goods sold is creeping up as a percentage of revenue over several years, that’s a signal worth investigating, even if absolute gross profit is still growing. The dollar figure can rise while the margin compresses, and in isolation, the headline number looks fine. In the common size form, the deterioration is immediately visible.
Access the full income statements of over 100,000 global stocks with TIKR >>>
The Balance Sheet: Competition Over Scale
On a common-size balance sheet, every line is expressed as a percentage of total assets. Cash becomes a percentage of the asset base. Goodwill tells you how acquisition-heavy the company’s history has been relative to its overall size. Long-term debt shows leverage as a proportion of what the company actually owns.
This view is particularly useful when comparing capital structures across companies of different sizes. Two industrial businesses might both appear conservatively financed in absolute terms, but if one has 40% of its asset base funded by long-term debt and the other has 15%, they’re carrying very different levels of risk. The common-size balance sheet makes that comparison instant.

Goodwill as a percentage of total assets is worth particular attention. A company where goodwill represents 5% of total assets has a very different risk profile than one where it represents 45%. The latter has made large acquisitions at significant premiums, and if those deals underperform, the balance sheet absorbs the write-down. Common-size analysis surfaces this concentration risk in a way that raw numbers often don’t.
Review the balance sheet on any stock in less than 60 seconds with TIKR (It’s free) >>>
The Cash Flow Statement: Where the Money Actually Goes
The common-size cash flow statement is the least commonly discussed of the three, but it adds something that the other two don’t. By expressing each line as a percentage of operating cash flow, you can see how efficiently a company converts its operations into free cash and how it deploys that cash.
If capital expenditures consistently consume 60% or more of operating cash flow, that’s a capital-intensive business that requires substantial ongoing reinvestment just to maintain its competitive position. If a company is generating operating cash flow and spending 80% of it on share buybacks, that’s a capital allocation story worth understanding in the context of whether the business has better uses for that money.

Comparing two companies in the same industry on this basis can reveal dramatically different capital requirements and financial flexibility, even when their income statement margins look similar on the surface.
A Practical Example: Two Retailers, Very Different Businesses
Consider a simplified comparison between two hypothetical retailers. Company A generates $30 billion in revenue. Company B generates $8 billion. In absolute terms, Company A looks dominant across every line.
But restate both in common-size terms, and a different picture emerges. Company A’s gross margin is 28%. Company B’s is 38%. Company A’s SG&A is consuming 22% of revenue. Company B’s is 18%. Company A’s operating margin lands at around 6%. Company B is closer to 14%. The smaller company is running a fundamentally more efficient operation, and the common size format is the only way to see that clearly when the raw numbers are this far apart in scale.
This kind of comparison also matters when evaluating whether a smaller company can maintain its margin advantage as it scales, or whether the larger company’s margin compression is structural or temporary. Neither question can be answered from a single year, which is why running this analysis across several periods matters as much as the cross-company comparison.
How to Use TIKR for Common Size Analysis
TIKR’s Detailed Financials section includes a toggle that instantly converts the income statement to a percentage-of-revenue view, covering more than a decade of data without manual calculation. What would otherwise require building a spreadsheet, pulling years of figures, and dividing every line by the corresponding revenue number is handled automatically.
This makes it practical to run common-size analysis as a routine part of reading a company’s financials rather than a separate exercise. You can switch between absolute and percentage views in the same session, toggling back and forth to see both the dollar trend and the structural trend simultaneously.

Click any row in the percentage view to generate a chart of that margin or cost ratio over time, which is often the fastest way to spot a multi-year shift in cost structure that deserves a closer look.
Find the best high-margin, high-quality stocks to buy today with TIKR >>>
TIKR Takeaway
Common-size analysis is one of those tools that sounds simple but consistently produces useful insights. Expressing financials as percentages rather than dollar figures removes the distortion of scale and lets you evaluate the actual structure of a business: how efficiently it converts revenue into profit, how its asset base is composed, and where its cash is going.
Those are the questions that matter most when comparing companies or tracking whether a single business is improving over time.
TIKR makes this analysis available without any additional setup. The percentage-of-revenue toggle in Detailed Financials converts years of income statement data into a common-size format instantly, and the chart generation feature turns any margin or cost ratio into a visual trend across the full historical range.
For investors who want to compare two companies in the same industry or track how a single company’s cost structure has evolved, it’s one of the more practically useful features on the platform.
Value Any Stock in Under 60 Seconds with TIKR
With TIKR’s new Valuation Model tool, you can estimate a stock’s potential share price in under a minute.
All it takes is three simple inputs:
- Revenue Growth
- Operating Margins
- Exit P/E Multiple
If you’re not sure what to enter, TIKR automatically fills in each input using analysts’ consensus estimates, giving you a quick, reliable starting point.
From there, TIKR calculates the potential share price and total returns under Bull, Base, and Bear scenarios so you can quickly see whether a stock looks undervalued or overvalued.
See a stock’s true value in under 60 seconds (Free with TIKR) >>>
Looking for New Opportunities?
- Discover which stocks billionaire investors are purchasing, so you can follow the smart money.
- Analyze stocks in as little as 5 minutes with TIKR’s all-in-one, easy-to-use platform.
- The more rocks you overturn… the more opportunities you’ll uncover. Search 100K+ global stocks, global top investor holdings, and more with TIKR.
Disclaimer:
Please note that the articles on TIKR are not intended to serve as investment or financial advice from TIKR or our content team, nor are they recommendations to buy or sell any stocks. We create our content based on TIKR Terminal’s investment data and analysts’ estimates. Our analysis might not include recent company news or important updates. TIKR has no position in any stocks mentioned. Thank you for reading, and happy investing!