

Key Takeaways:
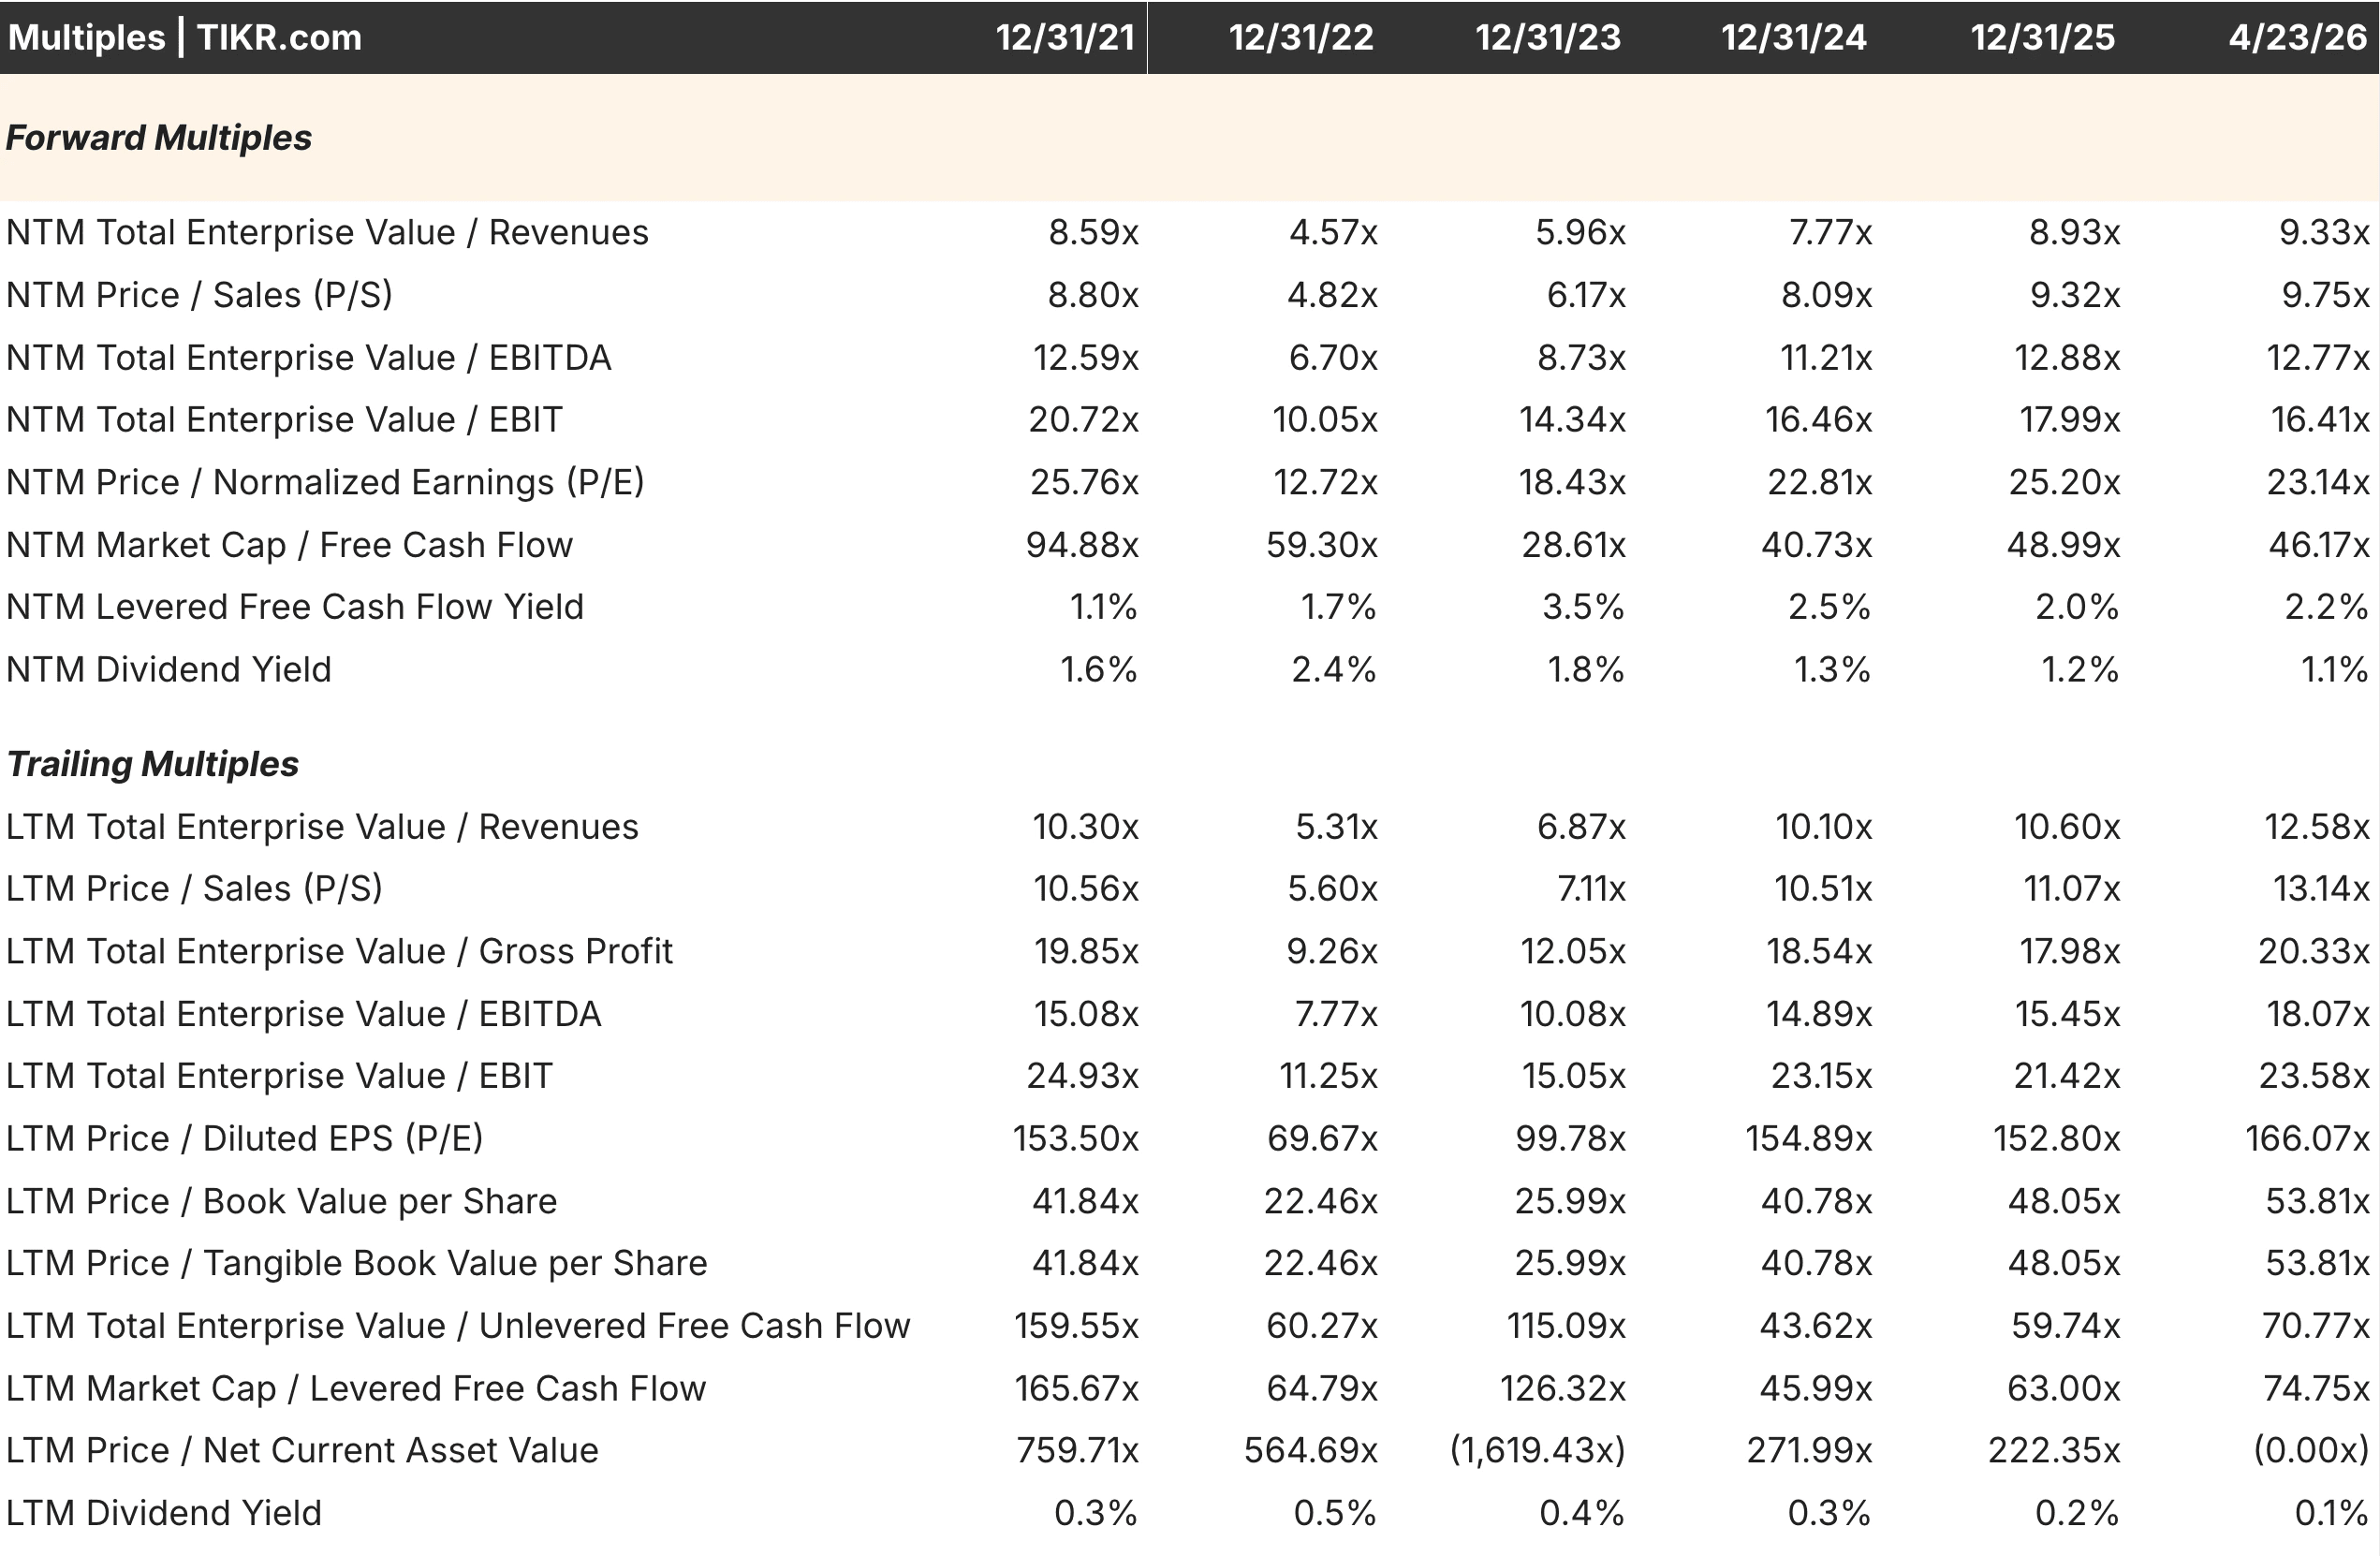
- ASML trades at approximately 36x forward P/E and 27x forward EV/EBITDA today, sitting near the upper end of its five-year historical range, while Taiwan Semiconductor trades at roughly 23x forward P/E and 13x forward EV/EBITDA, a meaningful discount to its own recent history despite accelerating revenue growth.
- ASML’s return on capital recovered to approximately 46% in 2025 after a trough of 38% in 2024, while TSMC’s return on capital reached nearly 30% in 2025 and continues to trend higher as advanced-node utilization improves.
- Analysts project ASML revenue growth of roughly 19% for 2026 and 20% for 2027, while TSMC consensus sits at approximately 35% revenue growth for 2026 and 26% for 2027, reflecting a meaningfully faster near-term growth profile driven by AI chip demand.
- On almost every forward valuation metric, TSMC trades at a significant discount to ASML despite growing faster, generating expanding margins, and benefiting from the same AI-driven demand tailwind on the other side of the supply chain.
Now Live: Discover how much upside your favorite stocks could have using TIKR’s new Valuation Model (It’s free)>>>
No two companies are more essential to the existence of advanced semiconductors than these. One makes the only machines capable of printing the chips that power AI. The other is the only manufacturer trusted to build them at scale. Remove either from the supply chain, and the entire AI infrastructure buildout stops.
That shared irreplaceability makes the comparison interesting, because the market is pricing the two very differently right now. Understanding why and whether that difference is justified is the central question this article seeks to answer.
One Makes the Only Machine. The Other Runs the Only Factory That Matters.
ASML (ASML) holds a genuine monopoly on extreme ultraviolet lithography systems, the machines required to manufacture chips at 7nm and below. No competitor produces a comparable system.
Building such a design requires decades of accumulated optical, mechanical, and software expertise that no other company has been able to replicate, and the barriers to entry grow higher each year as ASML advances to High-NA EUV for the next generation of nodes. Each system costs over $200 million and requires years of lead time, giving ASML extraordinary pricing power over a customer base with no alternatives.
On the other hand, you have TSMC (TSM), which occupies the other side of that relationship. As the world’s dominant foundry, it manufactures chips for companies like Apple, NVIDIA, AMD, and Qualcomm that lack the capital or expertise to build their own fabs.
Its manufacturing technology has stayed ahead of competitors for years, and the gap between TSMC’s most advanced nodes and the nearest alternative remains wide. Once a chip designer optimizes for TSMC’s process, redesigning for a different foundry involves years of re-engineering and carries meaningful performance risk.
What distinguishes the two businesses operationally is the nature of their revenue cycles. ASML’s order book is lumpy, driven by multi-year equipment purchasing decisions that can create significant quarter-to-quarter variability.
TSMC’s revenue is more capacity-driven, tied to chip demand across consumer electronics, data centers, and automotive end markets. That smoothness gives TSMC’s revenue profile a more predictable character, while ASML’s backlog provides long-term visibility even when near-term order timing creates noise.
Estimate a company’s fair value instantly (Free with TIKR) >>>
ASML’s Multiple Is Near Its Five-Year High. TSMC’s Has Quietly Compressed.

At roughly 36x forward P/E and 27x forward EV/EBITDA today, ASML trades near the upper end of its five-year historical range. Looking at the multiple tables, the NTM P/E has ranged from 28.69x in late 2022 to 36.90x in late 2023, indicating the current valuation is close to the peak set during the AI enthusiasm period. The NTM EV/EBITDA of 27.47x similarly reflects a premium, leaving limited room for multiple expansion and requiring strong execution on the High-NA EUV ramp to be justified.
TSMC’s picture looks notably different. The forward P/E of approximately 23x sits below the 25.20x reading from late 2025 and well below the 25.76x from late 2021. The NTM EV/EBITDA of roughly 13x is materially lower than ASML’s on an absolute basis and also below where TSMC itself traded during prior periods of peak optimism. For a business generating faster revenue growth, expanding operating margins, and improving capital returns, the compressed multiple creates an interesting entry point that was not available six months ago.
The divergence is partly explained by geopolitical risk. Investor concern around Taiwan’s political situation applies a persistent discount to TSMC that ASML, headquartered in the Netherlands, does not carry. Whether that discount is appropriately sized relative to the actual probability and magnitude of disruption is a judgment call, but it clearly exists in the current pricing.
TSMC’s Operating Margins Are Expanding While ASML’s Remain Range-Bound
Revenue and margin trajectories reveal meaningfully different business dynamics between the two companies.

TSMC grew revenue from approximately NT$1.6 trillion in 2021 to NT$3.8 trillion in 2025, with operating margins recovering from a trough of 42.63% in 2023 to approximately 45-46% in 2025 as advanced node utilization improved and AI chip demand filled capacity. The direction of margin travel is upward, driven by pricing power in leading-edge nodes where TSMC faces no competition and by a product mix shift toward more complex, higher-margin chips.
ASML’s revenue grew from approximately 18.6 billion euros in 2021 to 32.7 billion euros in 2025, an impressive trajectory but one accompanied by more volatile margins. Operating margins peaked at 35.12% in 2021, compressed to 30.70% in 2022 during a period of elevated R&D spend and supply chain costs, recovered partially, and sit around 34.60% in 2025.

The pattern reflects the inherent lumpiness of building and delivering systems that take years to manufacture and recognize as revenue, in ways that do not always align with the smoothness of demand.
Neither margin profile is concerning. The directional difference does suggest that TSMC’s profitability improvement story has more near-term momentum than ASML’s, which is already operating near the top of its historical margin range.
See what analysts think about ASML stock right now (Free with TIKR) >>>
What the Consensus Numbers Imply Through 2028
Thirty-seven analysts covering the ASML project 2026 revenue of approximately 38.9 billion euros, up roughly 19% year-over-year, with EPS consensus around $31.28, up approximately 27%. Revenue growth is expected to remain solid at roughly 20% in 2027, then moderate to around 9% in 2028 as the initial High-NA EUV ramp normalizes. The outer-year deceleration is worth noting because the current multiple embeds an expectation of durable growth that the 2028 estimates do not fully support.
For TSMC, 37 analysts project 2026 revenue growth of approximately 35% year-over-year, with EPS consensus around $15.45, up roughly 45%. The growth rate moderates but remains strong, at roughly 26% in 2027 and 22% in 2028, as AI chip demand continues to scale. The combination of faster near-term growth, a larger analyst contributor base for near-term estimates, and a lower current multiple creates a setup that is difficult to ignore on a relative basis.
The estimates reveal a counterintuitive situation. TSMC is growing faster, has more analyst conviction in near-term numbers, and trades at a significant discount to ASML on virtually every forward metric.
See analysts’ full growth forecasts and estimates for TSM stock (It’s free) >>>
Return on Capital Tells a Story About Competitive Advantage Quality
Capital efficiency provides another angle for comparing the quality of each moat.

ASML’s return on capital reached approximately 46.49% in 2025, after a trough of 38.25% in 2024, reflecting the temporary impact of elevated inventory buildup and system delivery timing. The recovery back toward the high 40% range confirms that the underlying business economics remain exceptional and that the 2024 dip was cyclical rather than structural.
TSMC’s return on capital recovered from a trough of 20.75% in 2023 to approximately 29.94% in 2025, trending higher as AI-driven utilization of advanced capacity improves. While lower than ASML’s in absolute terms, the trajectory is meaningfully positive and reflects a business whose capital intensity is beginning to generate superior returns as the installed base of leading-edge fabs reaches scale.

The ROIC gap between the two companies partly explains why ASML commands a higher multiple. A business generating nearly 47% returns on capital deserves to trade at a premium to one generating 30%. The question is whether the current premium is sized appropriately relative to the growth differential, the margin trajectory, and the geopolitical risk adjustment.
Which Name Offers the Better Entry Point Right Now
On nearly every forward valuation metric, TSMC appears more attractively priced than ASML today. The forward P/E discount of roughly 13 multiple points, the EV/EBITDA gap of approximately 14 turns, and the faster consensus revenue growth rate all point in the same direction. A long-term investor buying TSMC today is paying less for more near-term growth than an investor buying ASML at current levels.
ASML’s premium is defensible on ROIC grounds and on the argument that its monopoly is more complete than TSMC’s. No competitor makes EUV systems. A handful of competitors, including Samsung and Intel Foundry, are attempting to challenge TSMC, even if successfully replicating its technology lead remains a multi-decade project. That distinction is real and justifies some premium.
The more practical question for investors is whether ASML’s premium is sized correctly, given that the 2028 estimates show meaningful growth deceleration and the current multiple sits near a five-year high.
At 36x forward earnings with growth moderating toward 9% by 2028, the margin for error is narrow. At 23x forward earnings with near-term growth running at 35%, TSMC offers a more comfortable cushion against macro disruption, geopolitical news flow, or any softening in AI infrastructure spending.
Build your own Valuation Model to value any stock (It’s free!) >>>
How Much Upside Does Each Stock Have From Here?
With TIKR’s new Valuation Model tool, you can estimate a stock’s potential share price in under a minute.
All it takes is three simple inputs:
- Revenue Growth
- Operating Margins
- Exit P/E Multiple
If you’re not sure what to enter, TIKR automatically fills in each input using analysts’ consensus estimates, giving you a quick, reliable starting point.
From there, TIKR calculates the potential share price and total returns under Bull, Base, and Bear scenarios so you can quickly see whether a stock looks undervalued or overvalued.
See a stock’s true value in under 60 seconds (Free with TIKR) >>>
Looking for New Opportunities?
- See what stocks billionaire investors are buying so you can follow the smart money.
- Analyze stocks in as little as 5 minutes with TIKR’s all-in-one, easy-to-use platform.
- The more rocks you overturn… the more opportunities you’ll uncover. Search 100K+ global stocks, global top investor holdings, and more with TIKR.
Disclaimer:
Please note that the articles on TIKR are not intended to serve as investment or financial advice from TIKR or our content team, nor are they recommendations to buy or sell any stocks. We create our content based on TIKR Terminal’s investment data and analysts’ estimates. Our analysis might not include recent company news or important updates. TIKR has no position in any stocks mentioned. Thank you for reading, and happy investing!


