Key Stats for ASML Stock
- This Week Performance: 4%
- 52-Week Range: $555 to $1,564
- Current Price: $1,480
What Happened to ASML Stock?
ASML (ASML) stock is currently trading at $1,480, as the company’s record €13.2 billion in Q4 2025 net bookings and a freshly launched €12 billion share buyback program reinforced investor confidence in its dominant position across the AI infrastructure buildout.
Last January 28, ASML reported Q4 2025 earnings that delivered €9.7 billion in net sales, €2.8 billion in net income, and EPS of €7.35, while simultaneously unveiling the new buyback program and issuing 2026 full-year revenue guidance of €34 billion to €39 billion.
Driving that confidence is ASML’s unmatched role as the sole supplier of EUV lithography tools, with AI-driven demand accelerating customer capacity expansion plans at both advanced logic and DRAM fabs, pushing full-year 2025 EUV system revenue up 39% to €11.6 billion.
Increasingly, the market perceives ASML not merely as a semiconductor equipment vendor but as a direct infrastructure beneficiary of the AI buildout, with its €38.8 billion backlog and growing High NA adoption pipeline signaling sustained demand well into the decade.
CFO Roger Dassen stated on the Q4 2025 earnings call that “the lion’s share of the orders that came in, in Q4, some of it is ’26, but the lion’s share we use for ’27,” grounding the company’s multi-year revenue visibility in a record quarterly booking figure of €13.2 billion.
Further reinforcing the bullish outlook, Intel announced in January 2026 the qualification and acceptance of ASML’s EXE:5200B High NA system for high-volume manufacturing, marking a concrete milestone in the commercial rollout of ASML’s next-generation technology.
Beyond the near term, ASML’s Capital Markets Day targets of €44 billion to €60 billion in 2030 revenue at 56% to 60% gross margins position the company as a long-cycle compounder whose earnings power scales directly with the semiconductor industry’s AI-driven capacity race.
Wall Street’s Take on ASML Stock
ASML’s record €38.8 billion backlog and a new €12 billion buyback program transform its blowout Q4 into a forward earnings story, with management guiding 2026 revenue between €34 billion and €39 billion as AI-driven fab construction accelerates across its customer base.
Analysts estimate ASML’s 2026 revenue at €37.30 billion, representing 14.2% year-over-year growth, with normalized EPS expanding 20% to €29.65 and EBITDA margins widening to 39.0%, building a compelling fundamental case for sustained earnings compounding.

Wall Street stands firmly bullish on ASML, with 31 buy ratings and a mean price target of $1,397.71 across 35 analysts as of February 20, 2026, implying the consensus still sees roughly 11% upside from current levels.
The target range spans $940.00 on the low end to $1,600.00 on the high end, reflecting meaningful disagreement over how quickly High NA adoption and fab capacity expansion translate into accelerating revenue above the guidance midpoint.
What Does the Valuation Model Say?
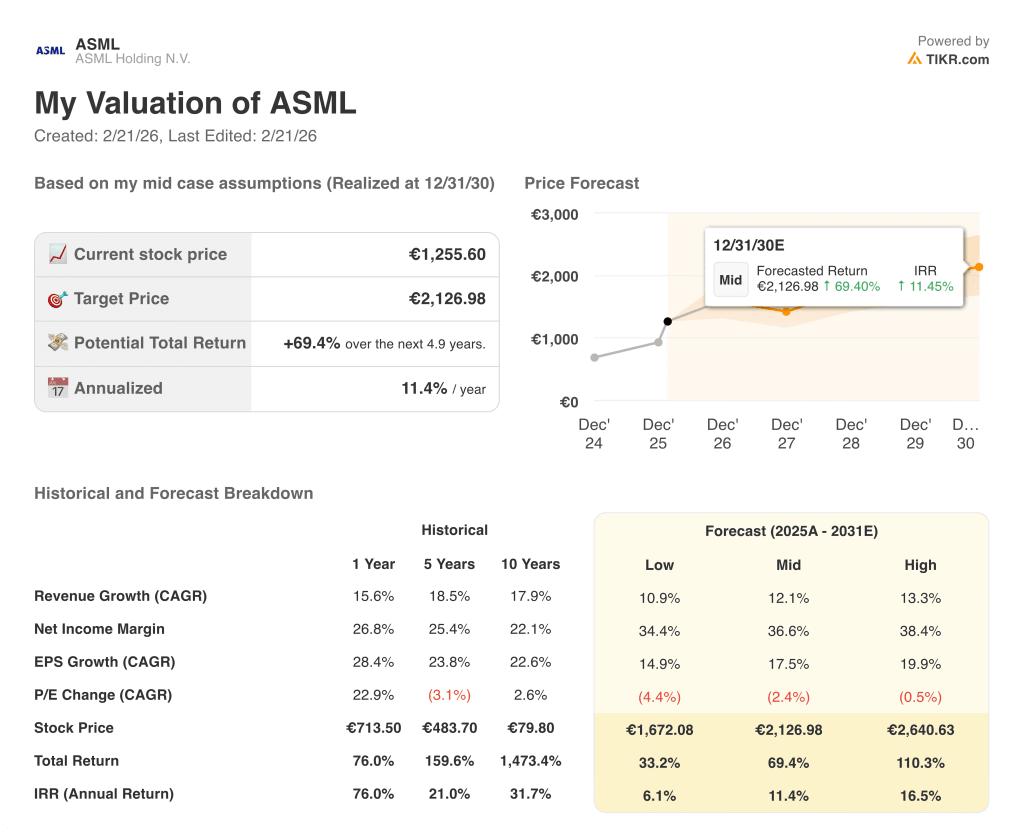
Buoyed by Intel’s January 2026 High NA qualification milestone and surging DRAM EUV demand, a mid-case valuation model prices ASML at €2,126.98 by December 2030, representing a 69.4% total return and an 11.4% annualized IRR from today’s price.
The primary risk is gross margin compression, with 2026 guidance of 51% to 53% reflecting a less favorable mix of older 3600 EUV units, supply-constrained immersion tools, and lower-margin dry DUV systems that could pressure near-term earnings even as top-line growth accelerates.
At $1,479.79 with consensus targets clustering near $1,397.71 and a multi-year valuation path to €2,126.98, ASML looks fairly valued near term but meaningfully undervalued for investors with a 2027-and-beyond horizon tied to High NA commercialization and the 2030 revenue target of €44 billion to €60 billion.
Value Any Stock in Under 60 Seconds (It’s Free)
With TIKR’s new Valuation Model tool, you can estimate a stock’s potential share price in under a minute.
All it takes is three simple inputs:
- Revenue Growth
- Operating Margins
- Exit P/E Multiple
From there, TIKR calculates the potential share price and total returns under Bull, Base, and Bear scenarios so you can quickly see whether a stock looks undervalued or overvalued.
If you’re not sure what to enter, TIKR automatically fills in each input using analysts’ consensus estimates, giving you a quick, reliable starting point.