Key Stats for Xylem Stock
- 52-Week Range: $100.7 to $154.3
- Current Price: $124.3
- Street Mean Target: $157.1
- Street High Target: $186
- TIKR Model Target (Dec. 2030): $188.9
What Happened?
Xylem Inc. (XYL), a water technology company covering the full water value chain from treatment and transport to smart metering and digital management, posted record full-year 2025 revenue of $9.0 billion while expanding operating margins to 14.6%, the highest level in at least four years, trading at $124.27.
The Q4 2025 earnings report, released February 10, delivered adjusted EPS of $1.42, beating consensus by $0.01 and marking a 20% year-over-year increase, while adjusted EBITDA margin reached 23.2%, up 220 basis points versus the prior year quarter.
The margin story is what separates this result from a simple beat: operating income grew 23.6% in 2025 to $1.32 billion, driven by productivity savings and price realization that outpaced inflation, with the Measurement and Control Solutions segment — which sells smart meters and digital water management platforms — delivering EBITDA margin expansion of 310 basis points in Q4 alone.
Matthew Pine, Chief Executive Officer, stated on the Q4 2025 earnings call that “the record results demonstrate the impact of our operating model transformation, which represents Phase 1 of our plan to deliver Xylem’s long-term framework,” tying that directly to the company’s structured shift from a highly matrixed organization to four focused segments with clearer P&L accountability and a 40% reduction in small management teams.
The 2026 setup is deliberately constructed around quality over volume: Xylem’s targeted “80/20” revenue simplification — a process of exiting low-margin customers and product lines to concentrate resources on the most profitable 20% — creates a 2% top-line headwind this year, but the restructuring program already delivering $29 million in 2025 savings is targeting $80 million to $120 million in annual net savings starting this year, supporting the company’s commitment to reach over 23% adjusted EBITDA margin for the full year.
Wall Street’s Take on XYL Stock
The Q4 beat resets the baseline: Xylem stock’s 2025 operating model transformation is now showing up directly in earnings, and consensus now prices in 8.4% EPS growth in 2026 on a more defensible, higher-quality revenue base.
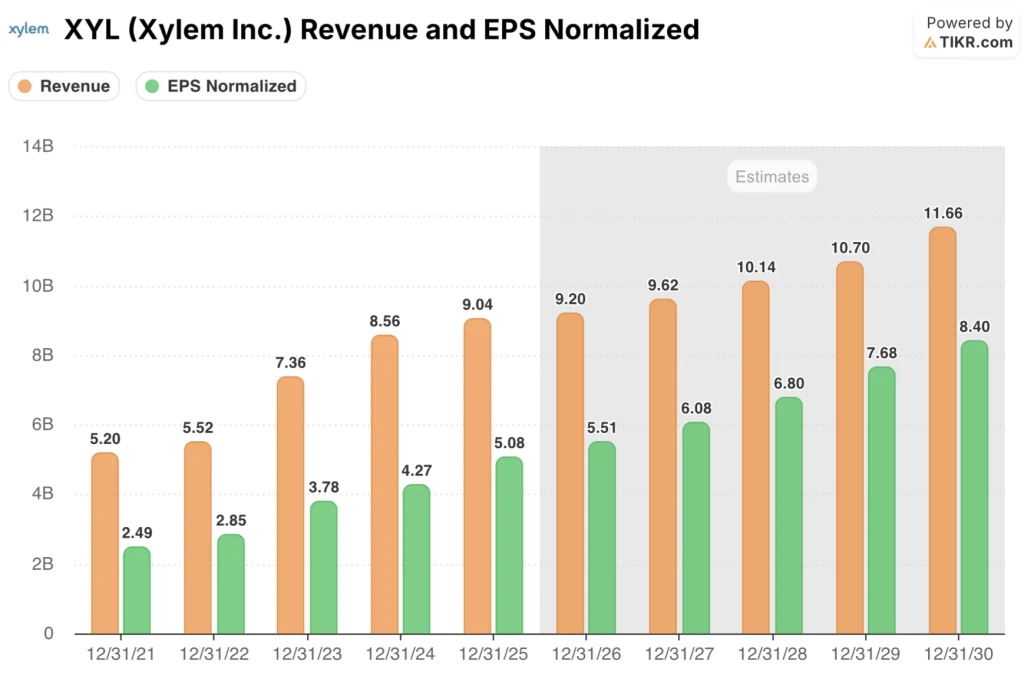
XYL’s 2026 consensus revenue estimate of $9.2 billion implies 1.8% growth, but the more important number is normalized EPS of $5.51, up from $5.08 in 2025, supported by $80 million to $120 million in annual restructuring savings that management confirmed will begin flowing in 2026.
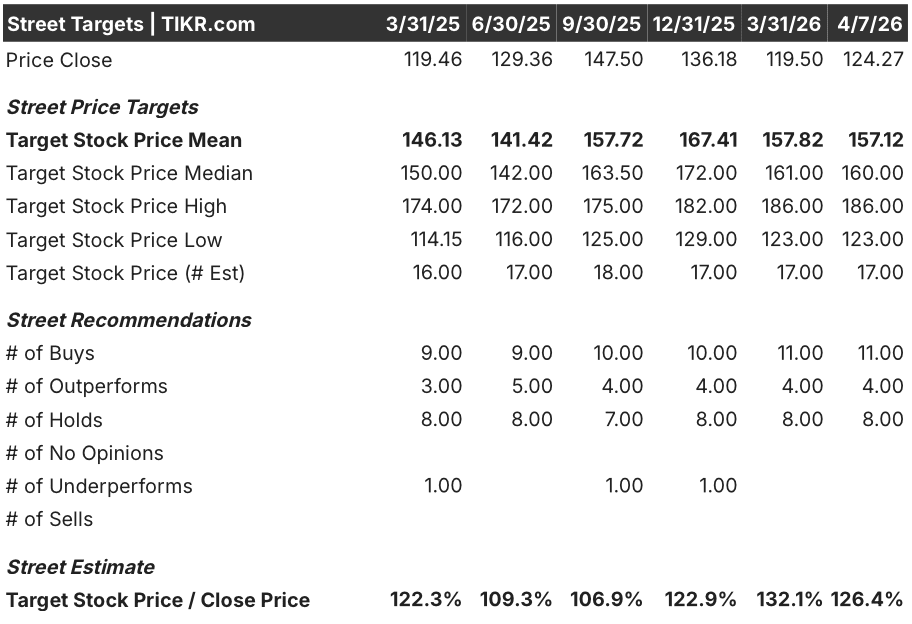
Fifteen analysts carry buy or outperform ratings on XYL against eight holds and zero sells, with a mean price target of $157.12 — implying 26.4% upside from current levels — while the street is specifically waiting for Q1 2026 earnings on April 28 to confirm that MCS order conversion is tracking the back-half acceleration in management’s guidance.
The spread between the $123 low target and $186 high target reflects a genuine debate: bears anchor to 1.8% reported revenue growth and soft China utility demand, while bulls price in the $80 million-plus savings ramp, MCS backlog conversion, and the company’s early positioning in AI-driven water infrastructure demand.
XYL currently trades at roughly 22.5x forward 2026 EPS of $5.51, a discount to its three-month-ago P/E of 28x, at a point where EPS is growing and margins are expanding — a combination that makes XYL stock undervalued relative to the quality improvement the operating model transformation has already delivered.
Pine’s statement that 2026 represents “an inflection point” from Phase 1 operational transformation into Phase 2 growth engine building — specifically targeting sales force customer-facing time rising from 40% to 75%-80% — is a genuine reframing of how the market should assess the company’s medium-term revenue trajectory.
The core risk is MCS project timing: five to ten large smart metering contracts pushed into H1 2026, and if those orders slip further, the back-half revenue ramp that underpins the full-year EPS guide breaks.
Q1 2026 results on April 28 are the first hard confirmation — specifically, whether MCS orders are tracking the first-half kickoffs management projected and whether organic growth exits Q1 at or above the flat sequential baseline in guidance.
Xylem Stock’s Income Statement
Xylem stock’s operating income grew 23.6% to $1.32 billion in 2025, pushing operating margins to 14.6% — the highest level the income statement shows going back to at least 2021, and a 210 basis point expansion from the 12.5% posted in 2024.
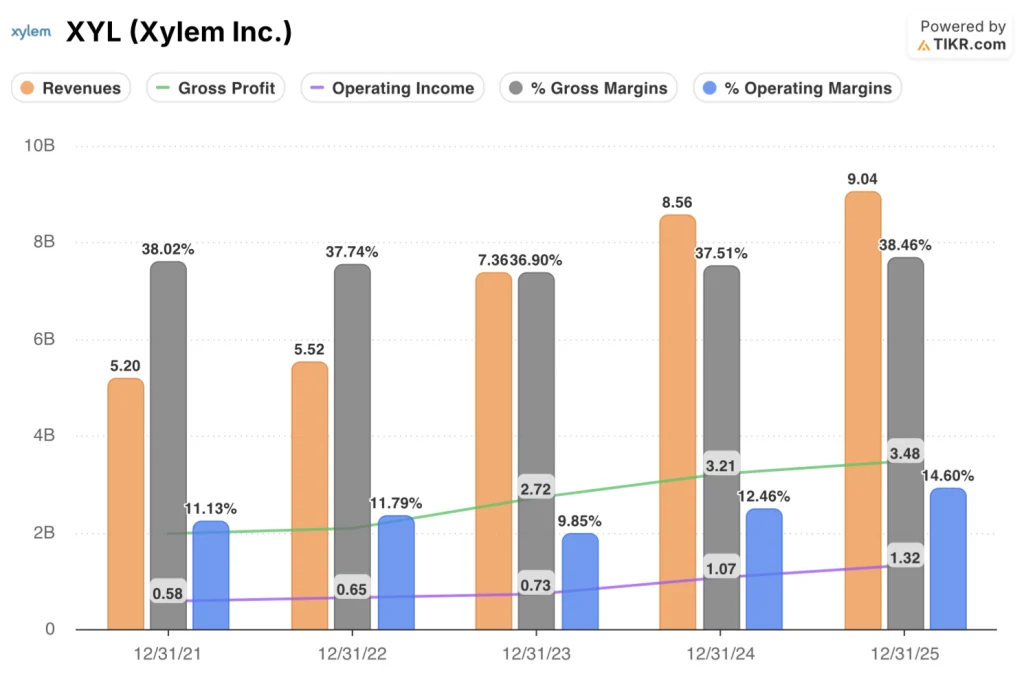
The expansion is not a one-year event: XYL’s gross margin reached 38.5% in 2025, recovering past the 2021 level of 38.0% and reversing the compression seen in 2022 and 2023, as the Evoqua integration — the 2023 acquisition that added outsourced water services and treatment capabilities — normalized and productivity savings compounded.
The directional trend in operating margins is steep and consistent: from 11.1% in 2021 to 11.8% in 2022, then a step back to 9.8% in 2023 as integration costs weighed, followed by a recovery to 12.5% in 2024 and an acceleration to 14.6% in 2025, tracing a clear operational leverage story as total operating expenses held nearly flat at $2.16 billion between 2024 and 2025 while revenue grew 5.5%.
The one tension in the income statement is that gross profit growth of 8.2% in 2025, while healthy, decelerated from 18.2% in 2024, a signal that the easy gains from Evoqua cost synergies may be behind Xylem and that sustaining operating margin expansion into 2026 will depend more heavily on the restructuring savings program than on gross-line pricing.
What Does the Valuation Model Say?
The TIKR model prices XYL at $188.90 by December 2030 under mid-case assumptions of 4.4% revenue CAGR and a net income margin expanding to 15.8%, a target that is already directionally supported by the operating model transformation delivering record 2025 margins and the $80 million to $120 million restructuring savings set to compound over the next three years.

A 52% total return over 4.7 years makes XYL undervalued at $124.27 — the multiple has contracted from 28x to roughly 22.5x forward earnings precisely as the earnings quality story has improved, creating the gap the model is pricing in.
The question for Xylem stock is whether MCS project conversion and the Phase 2 growth engine build accelerate the earnings compounding the mid case requires, or whether China softness and 80/20 walkaway headwinds cap the top line long enough to compress the returns timeline.
Low Case — $154.66 / 4.7% IRR: If MCS order kickoffs continue slipping and China utility demand remains depressed through 2026, revenue grows around 4.0% CAGR with net income margins stabilizing near 14.8% → 24.5% total return, 4.7% annualized.
Mid Case — $188.90 / 9.2% IRR: With MCS backlog converting on management’s H2 timeline and the restructuring savings ramp delivering, revenue grows near 4.4% CAGR and margins expand toward 15.8% → 52.0% total return, 9.2% annualized.
High Case — $224.16 / 13.3% IRR: If AI-driven water infrastructure demand accelerates within WSS and the data center segment, and 80/20 simplification unlocks faster sales force productivity gains, revenue reaches around 4.9% CAGR and margins approach 16.6% → 80.4% total return, 13.3% annualized.
The mid case requires no multiple expansion — P/E contracts a further 2.1% per year — and only needs the restructuring savings already communicated and backlog conversion already in pipeline, which management characterized as visible across five to ten named projects.
What is actually observable right now supports the mid case: book-to-bill was near 1.0 for both Q4 and the full year, the $4.6 billion backlog has over 60% converting in 2026, MCS orders surged 22% in Q4, and the company increased its dividend 8% — actions management makes only when FCF confidence is high.
Should You Invest in Xylem Inc.?
The only way to really know is to look at the numbers yourself. TIKR gives you free access to the same institutional-quality financial data that professional analysts use to answer exactly that question.
Pull up XYL stock and you’ll see years of historical financials, what Wall Street analysts expect for revenue and earnings in the quarters ahead, how valuation multiples have moved over time, and whether price targets are trending up or down.
You can build a free watchlist to track Xylem Inc. alongside every other stock on your radar. No credit card required. Just the data you need to decide for yourself.
Access Professional Tools to Analyze XYL stock on TIKR for Free →