Key Stats for WDC Stock
- Past week performance: (14.3%)
- 52-week range: $76.70 to $799.87
- Valuation model target price: $676.19
- Implied upside: 47.2% over 2.9 years
See how AI storage demand could shape Western Digital’s next 5 years using TIKR’s new Valuation Model (It’s free) >>>
A Beat That Wasn’t Big Enough for Sky-High Expectations
Western Digital (WDC) delivered a Q4 that would normally send a stock soaring. Revenue surged 44% to $3.75 billion, beating estimates of $3.69 billion, while non-GAAP earnings per share more than doubled to $3.56 versus expectations of $3.30. Full-year fiscal 2026 revenue jumped 36% to $12.92 billion.

Cloud demand drove nearly all of it. Cloud end-market revenue, which makes up 89% of total revenue, climbed 43% to $3.3 billion, fueled by strong demand for higher-capacity nearline drives and favorable pricing. The company shipped 231 exabytes, up 22% year over year, so volume and price both moved in Western Digital’s favor.

Despite that, shares dropped roughly 20% because the guidance failed to clear an unusually high bar. Western Digital guided fiscal Q1 2027 revenue of $4.1 billion and adjusted EPS of $4.00, slightly above consensus. However, investors expected more after the stock nearly tripled this year on AI storage optimism.
CEO Irving Tan said AI storage demand is expanding beyond model training into inference and agentic workflows, which continuously generate and retain data. If WDC stabilizes, the next catalyst may be confirmation that the 40-terabyte drive ramp is accelerating exabyte shipments beyond current guidance.
See analysts’ growth forecasts and price targets for WDC (It’s free) >>>
Is WDC Stock Undervalued?
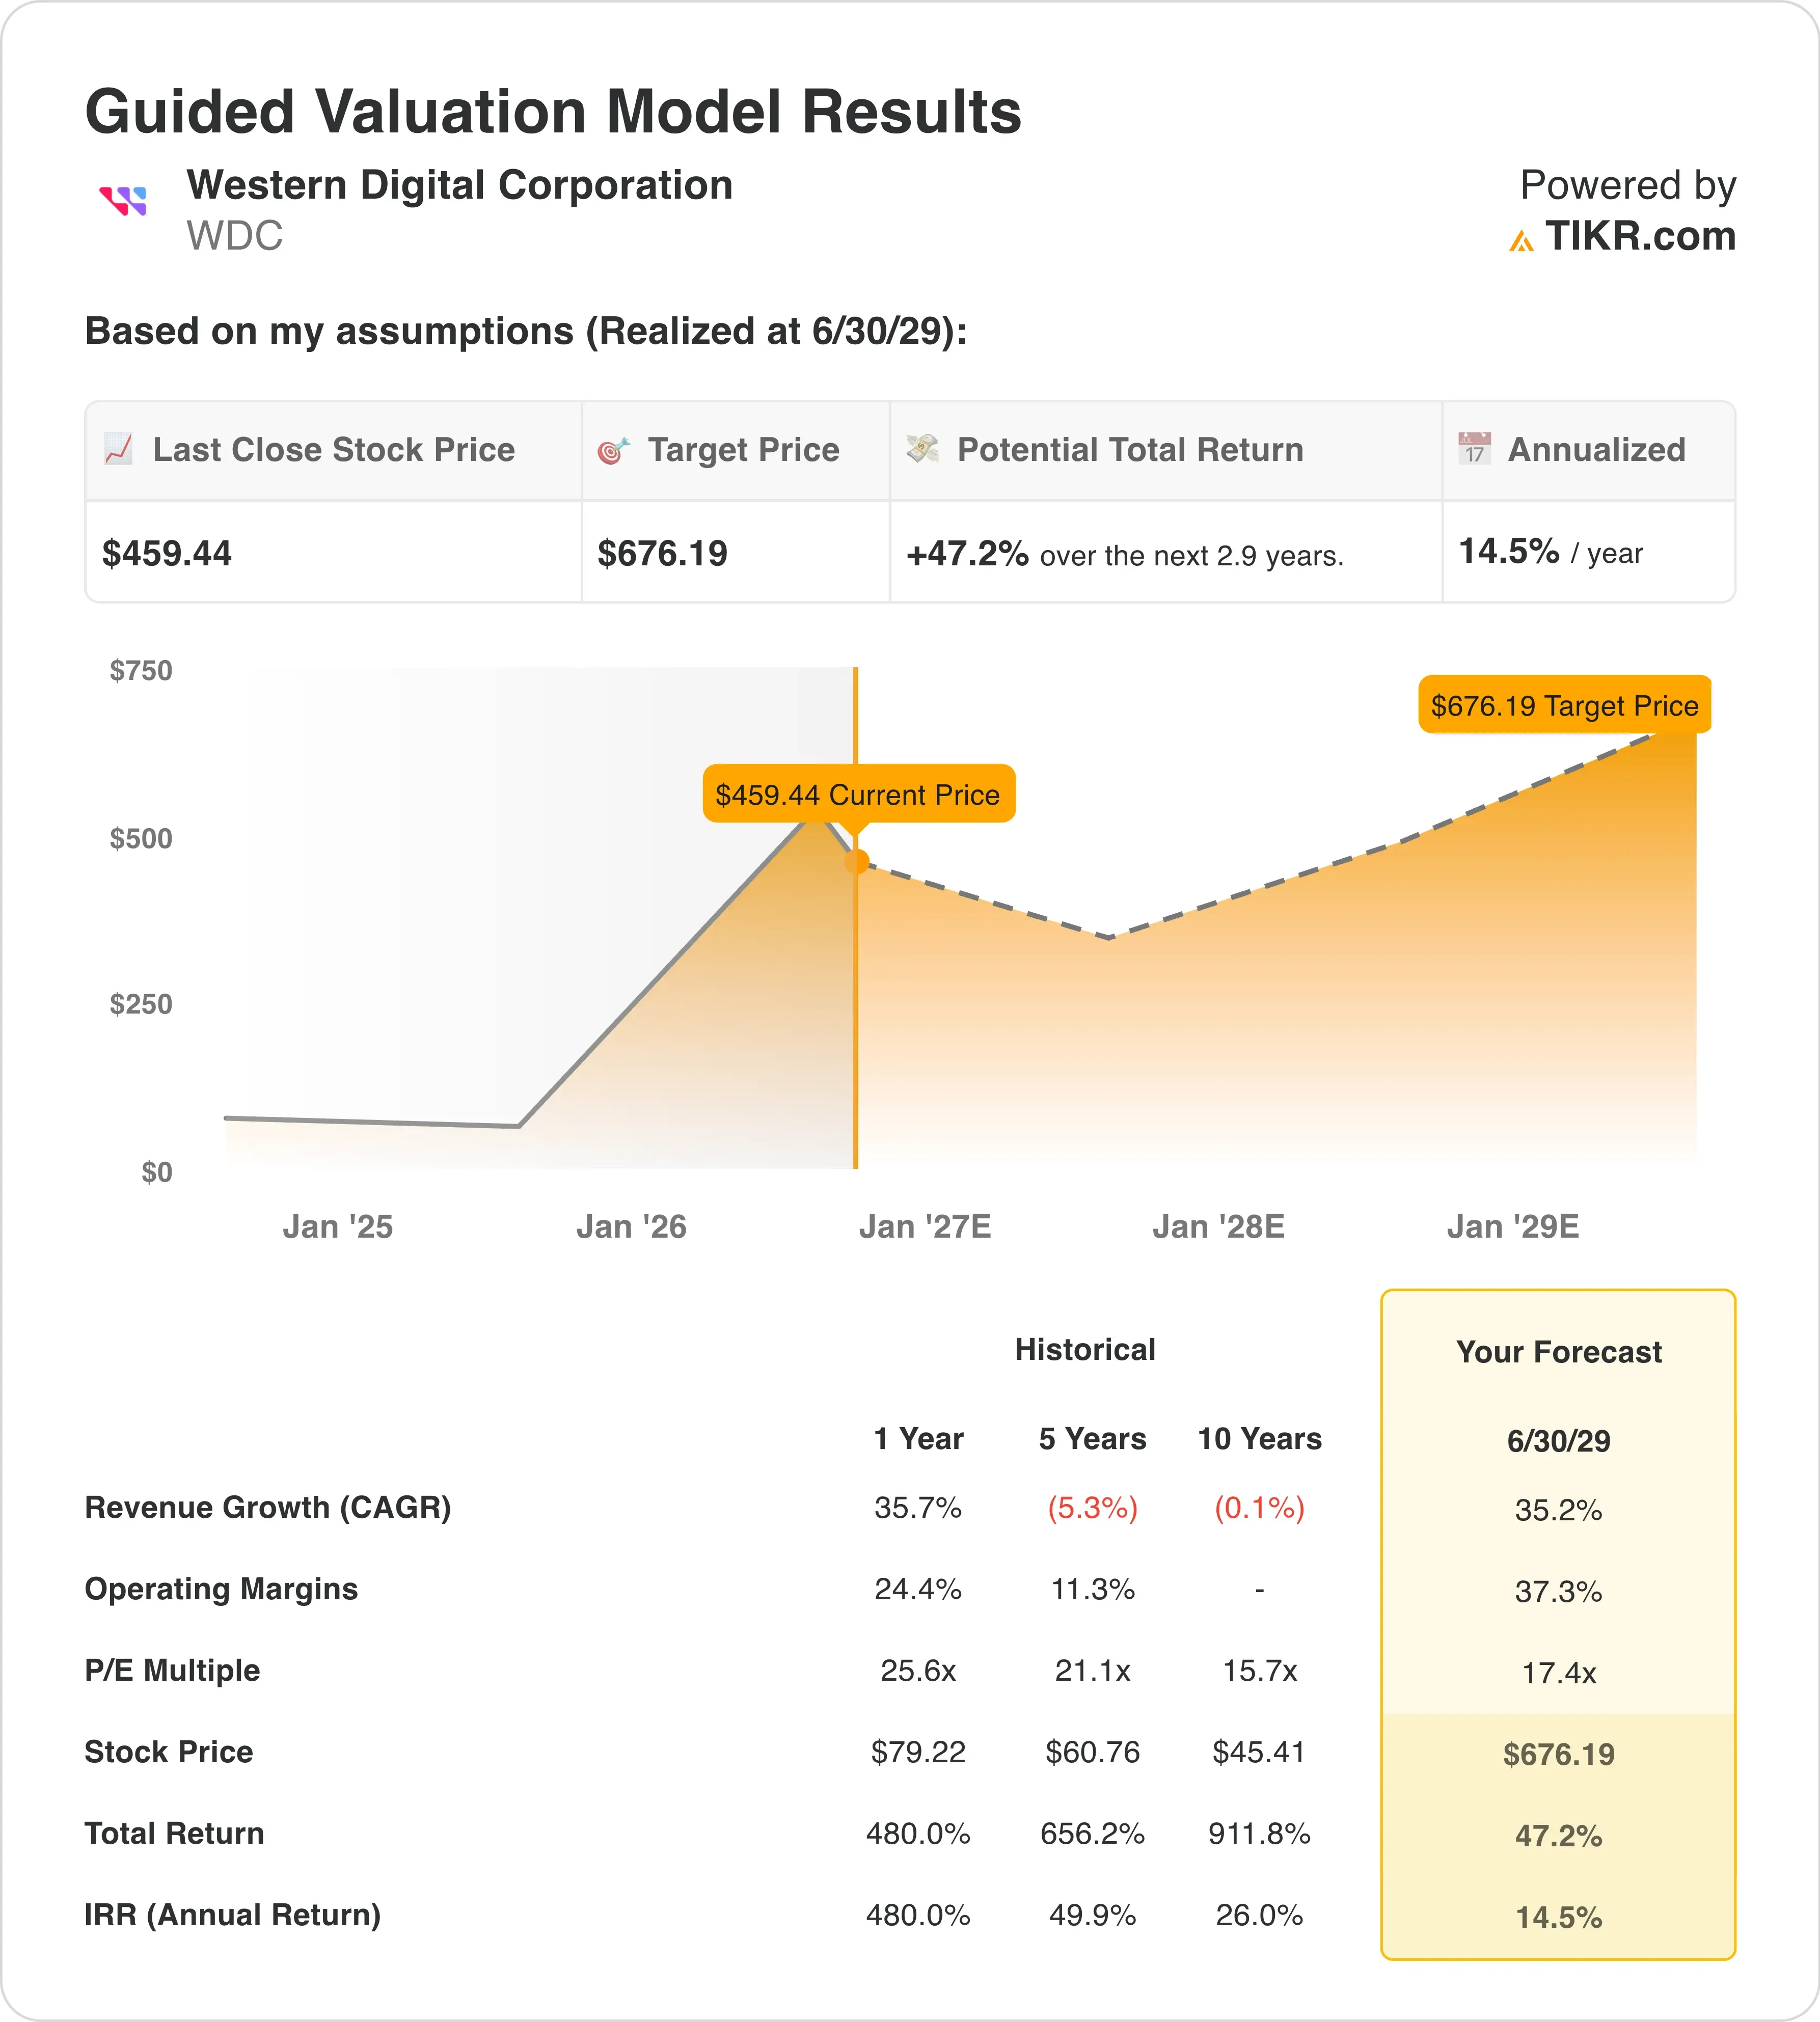
Under valuation model assumptions realized through 12/31/28, the stock is modeled using:
- Revenue Growth (CAGR): 35.2%
- Operating Margins: 37.3%
- Exit P/E Multiple: 17.4x
Based on these inputs, the model estimates a target price of $676.19, implying 47.2% total upside from the current share price and a 14.5% annualized return over the next 2.9 years.
A 14.5% annualized return lands in the moderately attractive range, just short of the 15% threshold that typically signals a clearly undervalued setup. Given that Western Digital shares have already tripled in 2026, the model suggests meaningful upside remains if the company can sustain its current growth trajectory.
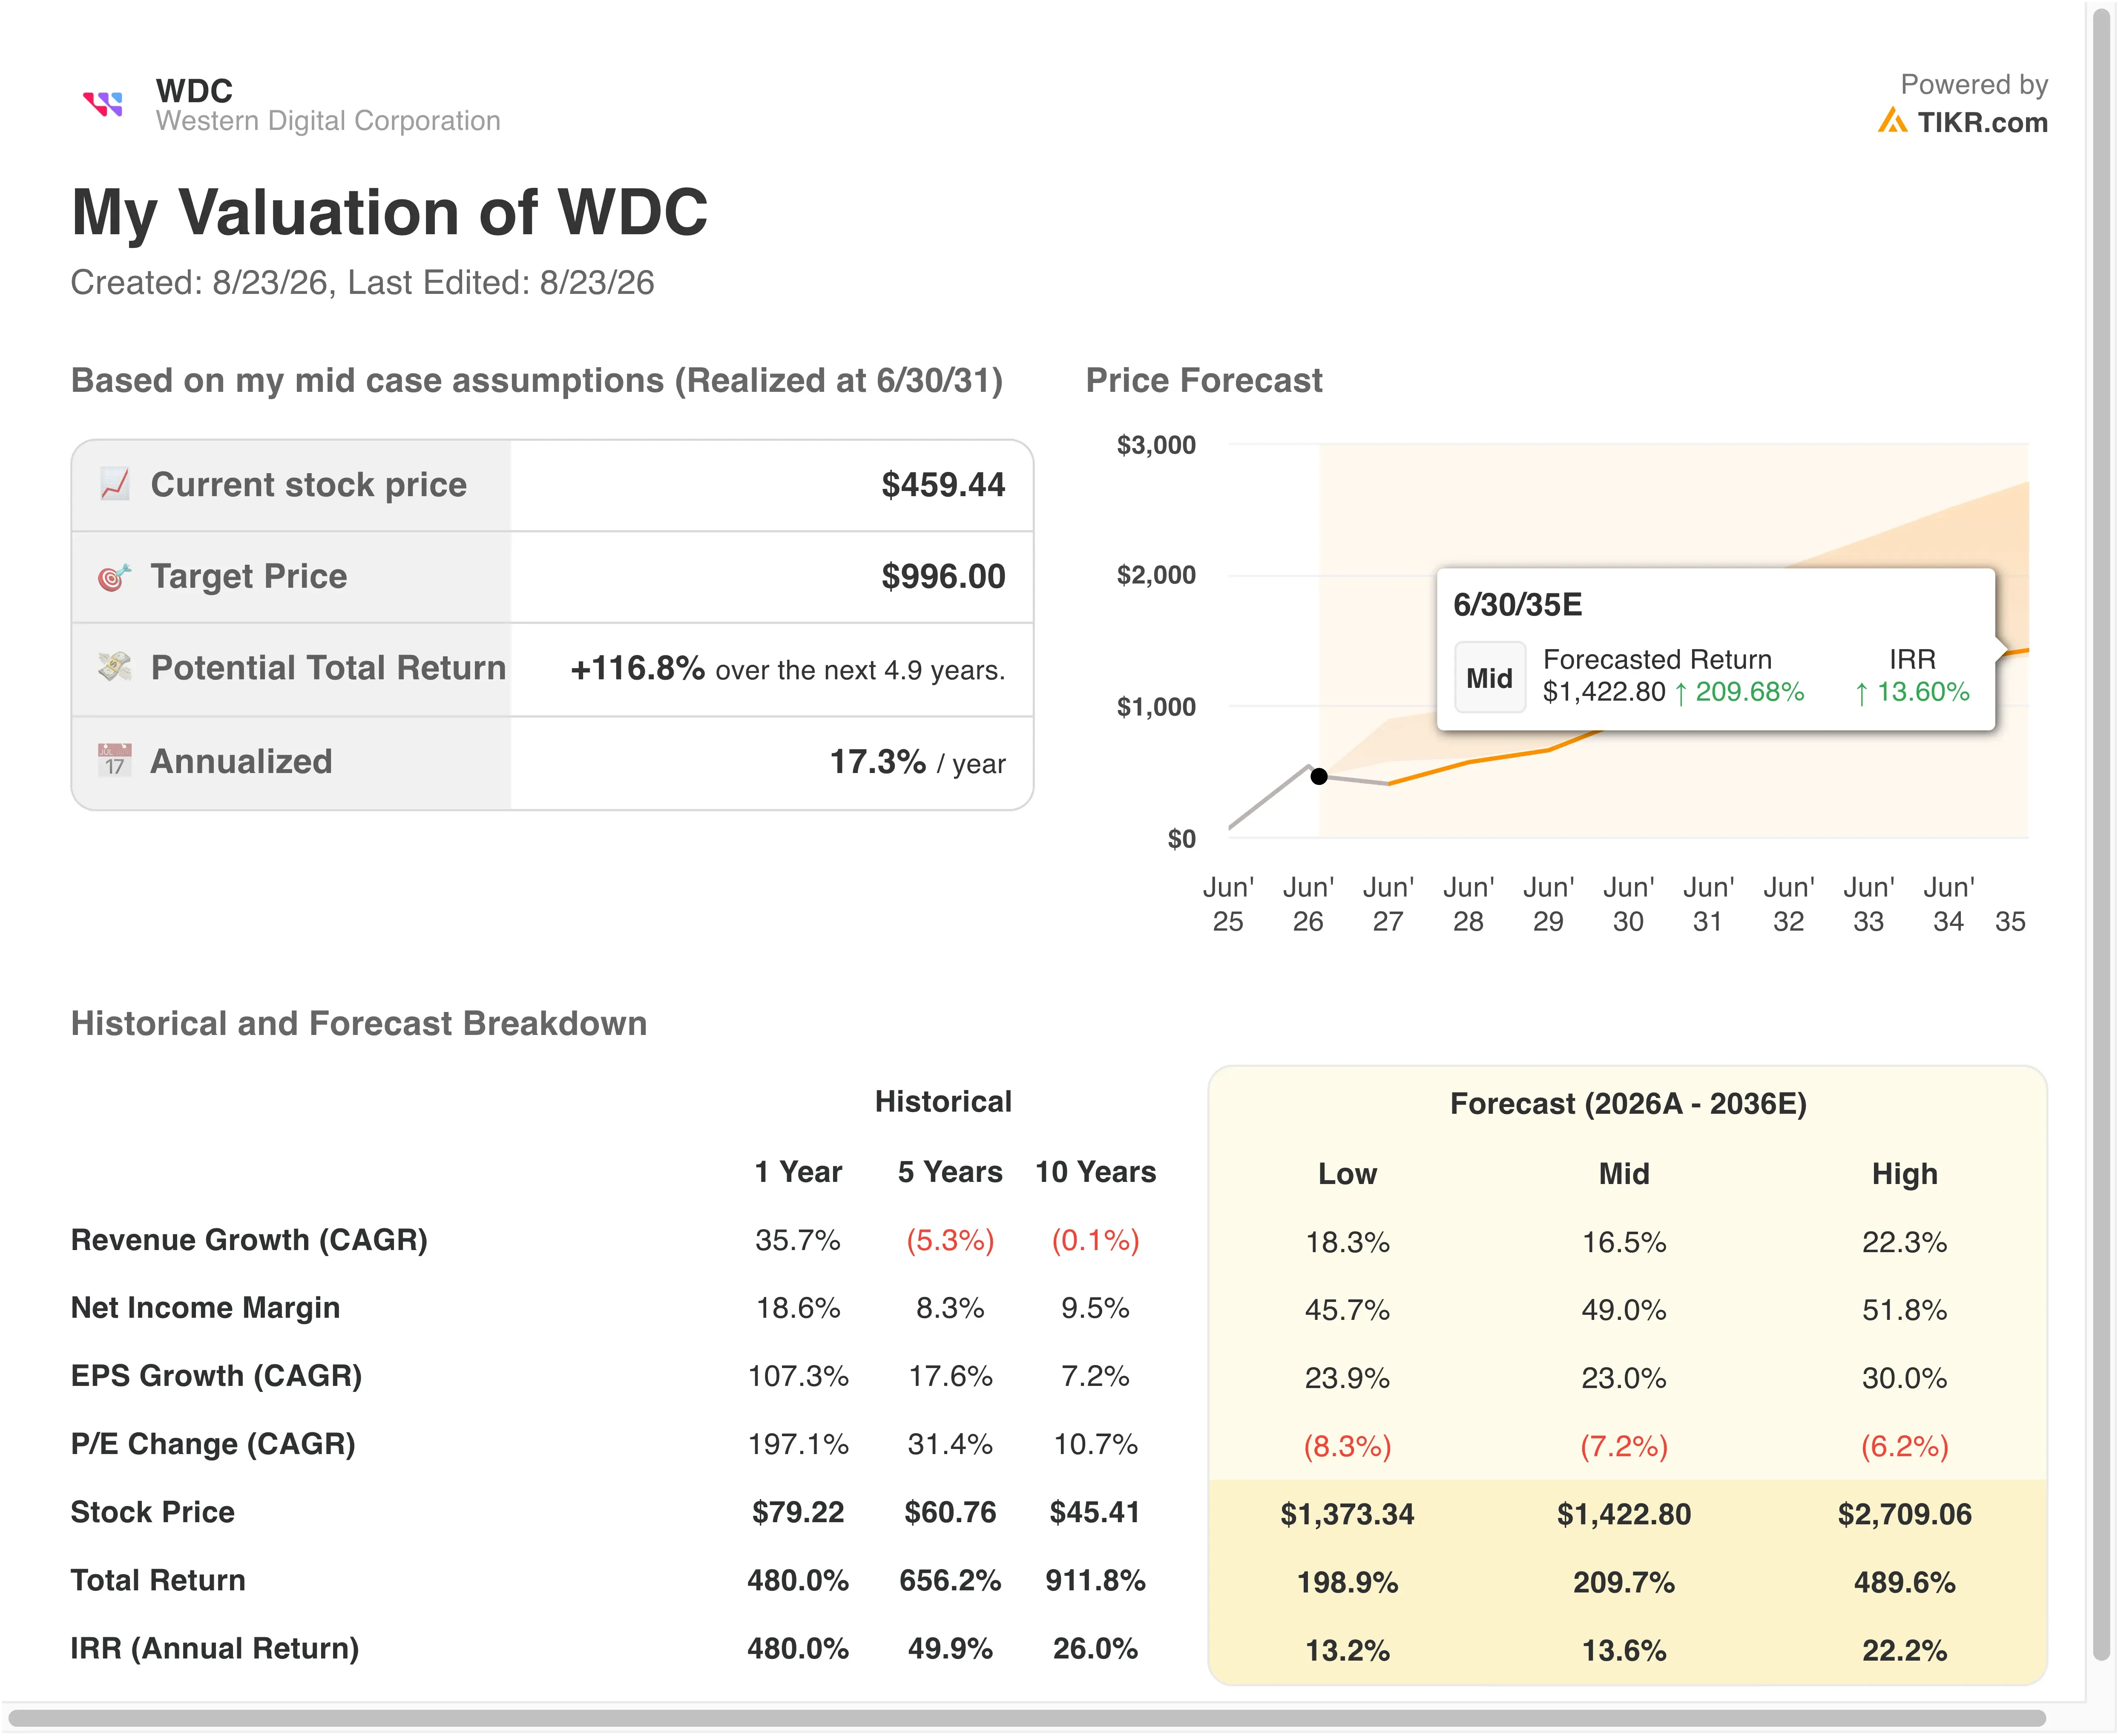
The 35.2% revenue growth assumption is aggressive but not unreasonable, since Western Digital just posted 44% growth this quarter. Operating margins near 37.3% would represent a significant step up from historical norms, reflecting the pricing power AI-driven demand has unlocked across the storage sector.
The 17.4x exit multiple looks conservative next to Western Digital’s current NTM P/E near 22.9x, which suggests the model isn’t assuming investors keep paying today’s premium. That gap is exactly why the stock sold off this week: any wobble in near-term guidance runs headfirst into a valuation that already assumes some multiple compression.
Estimate a company’s fair value instantly (Free with TIKR) >>>
How Western Digital Stacks Up Against Seagate and Micron
Western Digital’s 44% revenue growth this quarter trailed Seagate Technology (STX), which posted 48% year-over-year growth to $3.6 billion with a non-GAAP gross margin of 52.7%, its 13th consecutive quarter of margin expansion. That comparison highlights how competitive the mass-capacity storage market has become as AI demand lifts pricing across the board.
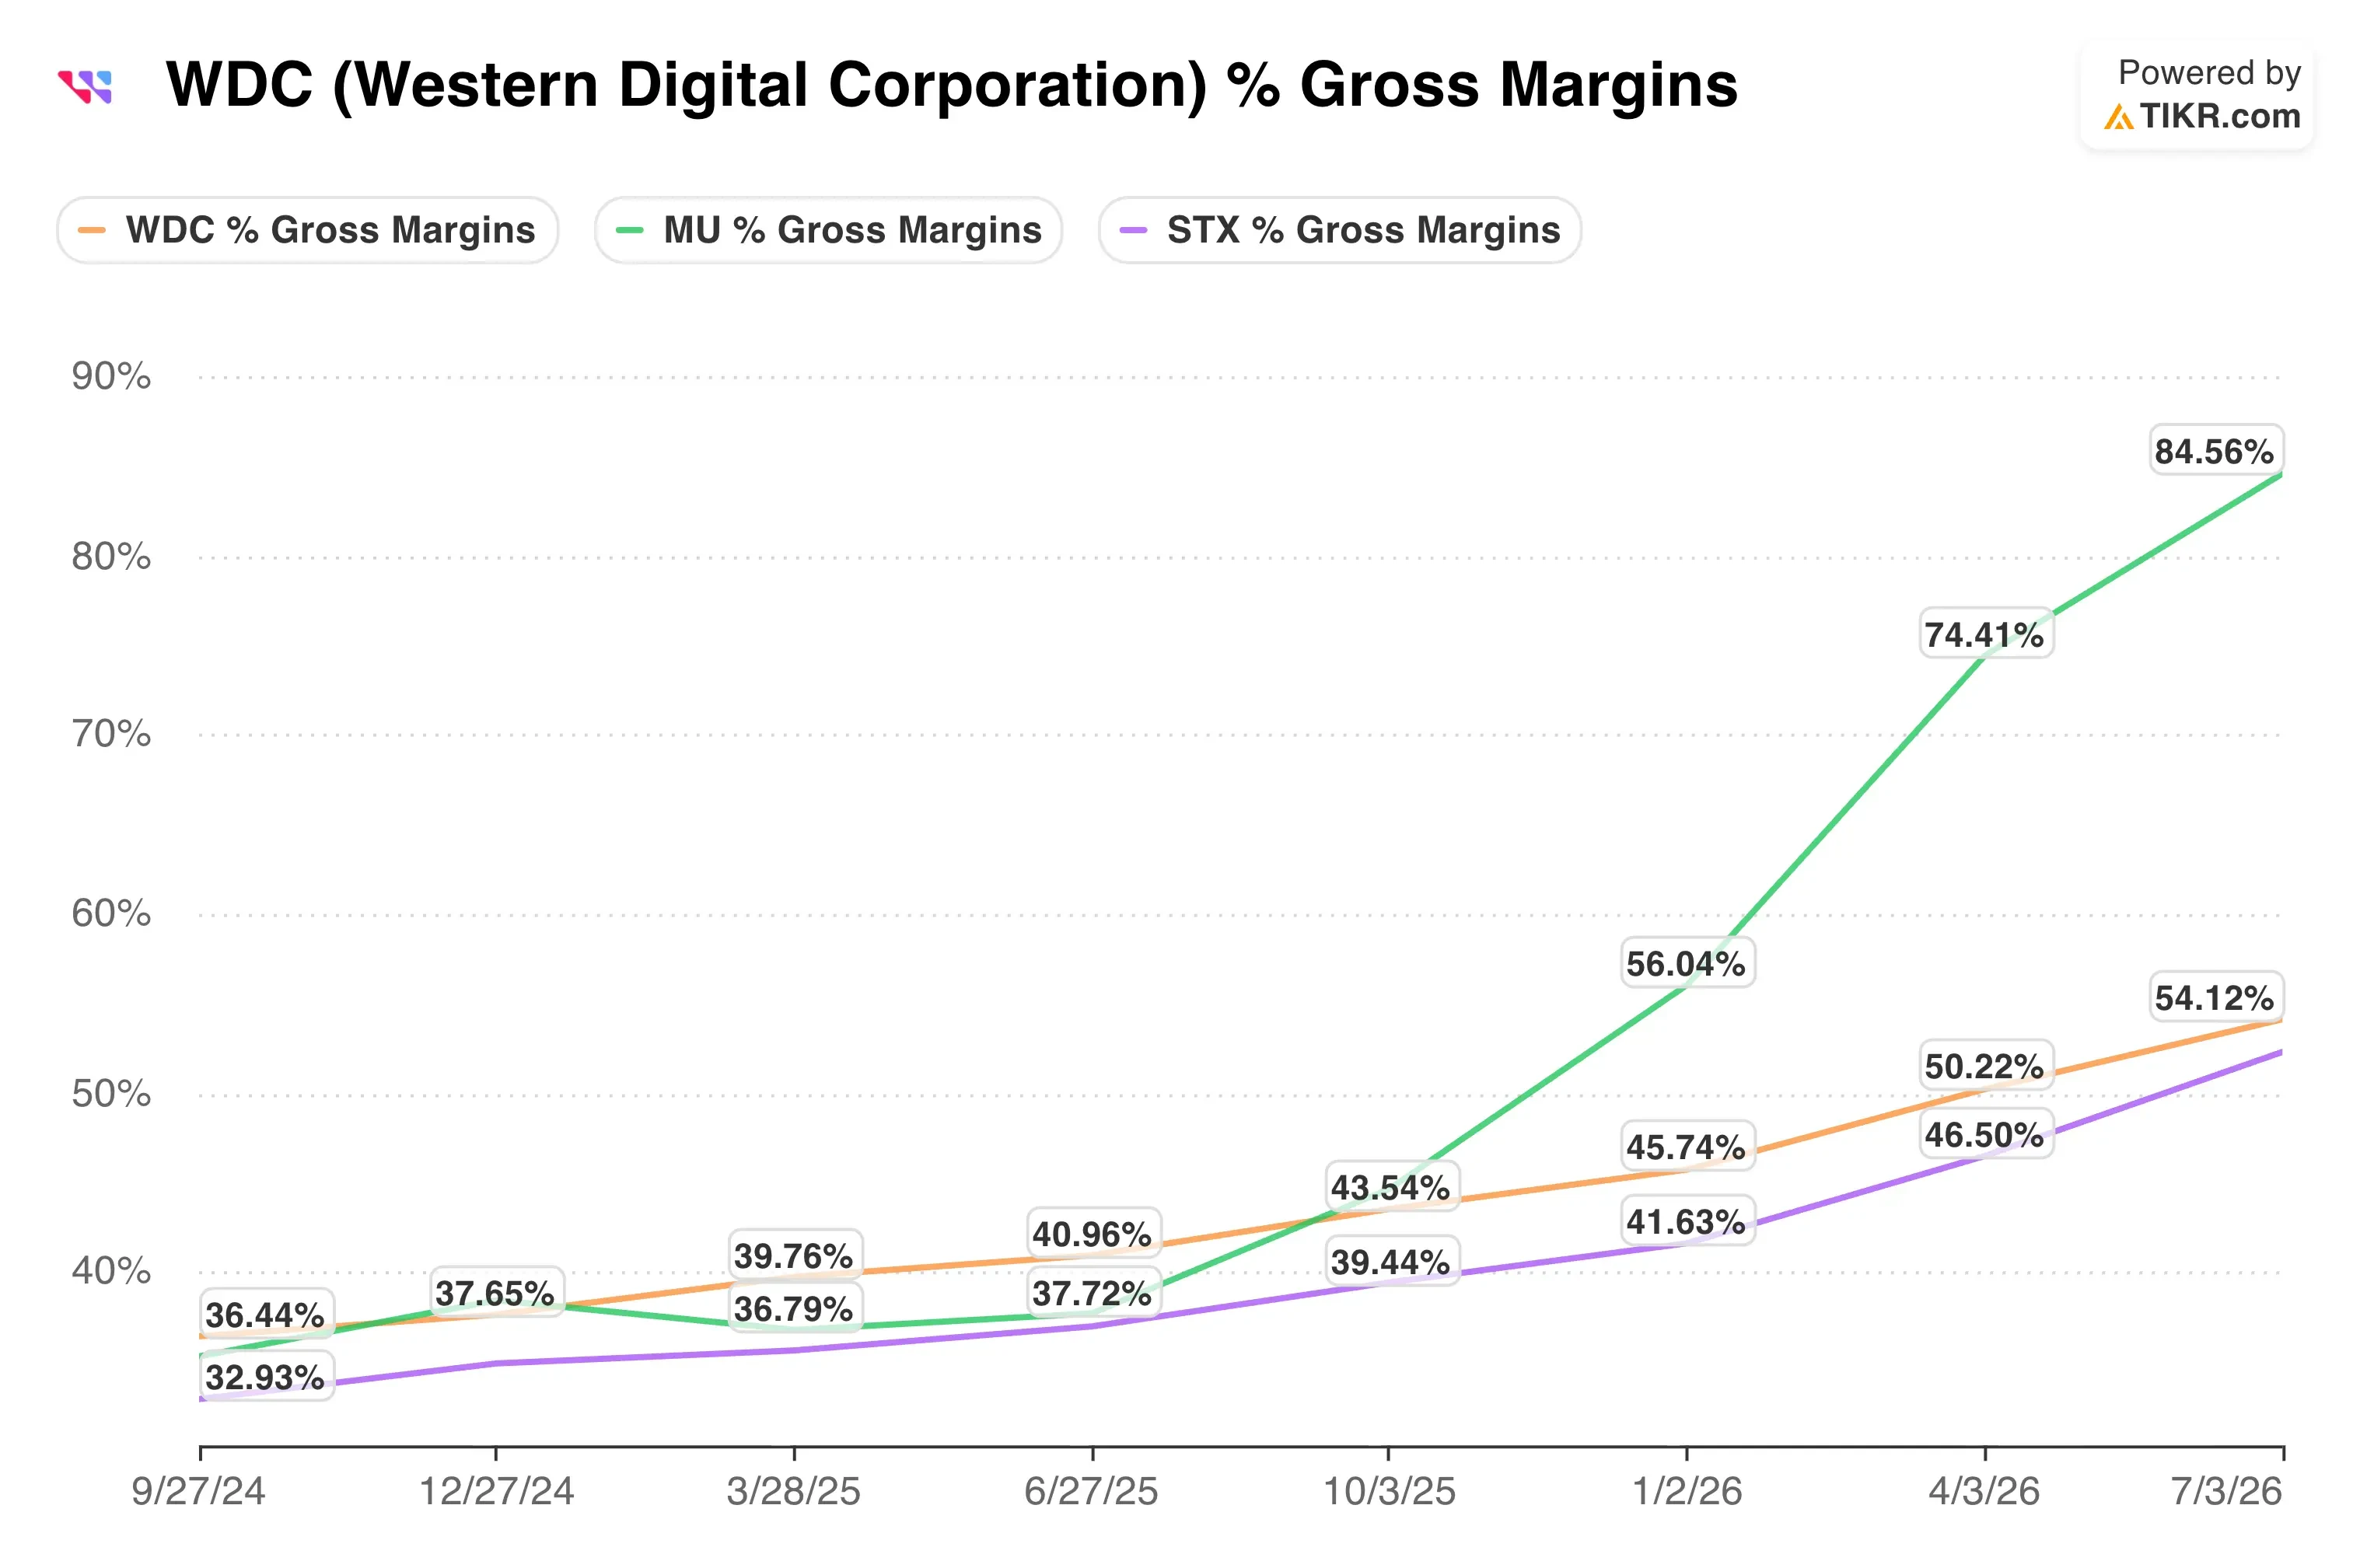
Micron Technology (MU), while more DRAM-focused, posted staggering NAND growth of 361% year over year with a consolidated gross margin of 84.9%, underscoring just how tight memory and storage supply has gotten industry-wide. Western Digital’s margins remain lower than either peer, but its growth rate keeps pace with the broader AI storage supercycle.
The competitive moat in this sector increasingly comes down to technology roadmap execution. Seagate’s HAMR-based Mozaic platform now represents 40% of nearline exabyte shipments, while Western Digital is ramping its own 40 terabyte ePMR drives and preparing 44 terabyte HAMR products for fiscal 2027. Whichever company scales next-generation capacity fastest is likely to capture outsized pricing gains.
What’s Driving WDC Stock Going Forward?
The 40 terabyte ePMR drive ramp is the most immediate catalyst. Management expects a strong ramp over the next few quarters, and any acceleration beyond current guidance could quickly reverse this week’s selloff.
AI storage demand broadening beyond training is the bigger multi-year story. As inference, agentic workflows, and physical AI applications generate more persistent data, Western Digital’s cloud customers will likely need to keep expanding capacity regardless of near-term pricing swings.
Competition from Seagate remains the key risk to watch. Seagate’s stronger near-term margin outlook and faster HAMR ramp mean Western Digital needs to execute cleanly on its own roadmap to avoid losing share in high-capacity nearline drives.
The next earnings report in late October will show whether the 40 terabyte platform is translating into faster exabyte growth. If Western Digital stock is going to reclaim its 2026 highs, a guidance beat that clears elevated expectations will likely be the trigger.
Should You Invest in Western Digital?
The only way to really know is to look at the numbers yourself. TIKR gives you free access to the same institutional-quality financial data that professional analysts use to answer exactly that question.
Pull up WDC, and you’ll see years of historical financials, what Wall Street analysts expect for revenue and earnings in the quarters ahead, how valuation multiples have moved over time, and whether price targets are trending up or down.
You can build a free watchlist to track WDC alongside every other stock on your radar. No credit card required. Just the data you need to decide for yourself.
Analyze WDC stock on TIKR Free→
Disclaimer:
Please note that the articles on TIKR are not intended to serve as investment or financial advice from TIKR or our content team, nor are they recommendations to buy or sell any stocks. We create our content based on TIKR Terminal’s investment data and analysts’ estimates. Our analysis might not include recent company news or important updates. TIKR has no position in any stocks mentioned. Thank you for reading, and happy investing!