Key Stats for Intel Stock
- 52-Week Range: $23.68 – $142.35
- Street Mean Target: ~$115
- Market Cap: ~$473.3B
- NTM P/E: 54.2x
- LTM EBIT Margin: 7.8%
- Q2 2026 Revenue: $13.1B (beat estimates)
- Q3 2026 Guidance: $13.8B – $14.8B revenue; $0.38 non-GAAP EPS
Now Live: Discover how much upside your favorite stocks could have using TIKR’s new Valuation Model (It’s free) >>>
The Rise, the Fall, and the CEO Who Bought the Dip
Intel’s (INTC) 2026 has been one of the most dramatic stories in the semiconductor sector. The stock started the year near $39, rocketed to a 52-week high of $142.35 by late June, then reversed sharply. By July 29, the day Q2 earnings landed, INTC had shed 41.90% from its peak.
It has since recovered partially, sitting at around $90, still down 36% from the high. Investors who bought at the top are sitting on serious losses. Those who bought in January are still up more than 100%.
Under CEO Lip-Bu Tan, Intel delivered six consecutive quarters of revenue beats, hit major manufacturing milestones on its 18A process node, signed partnerships with Nvidia, SoftBank, and Terafab, and sparked speculation that Apple might engage Intel Foundry for US-made chips.
The drawdown chart captures the year’s character precisely. Through the first half, the stock repeatedly touched new highs and pulled back modestly.
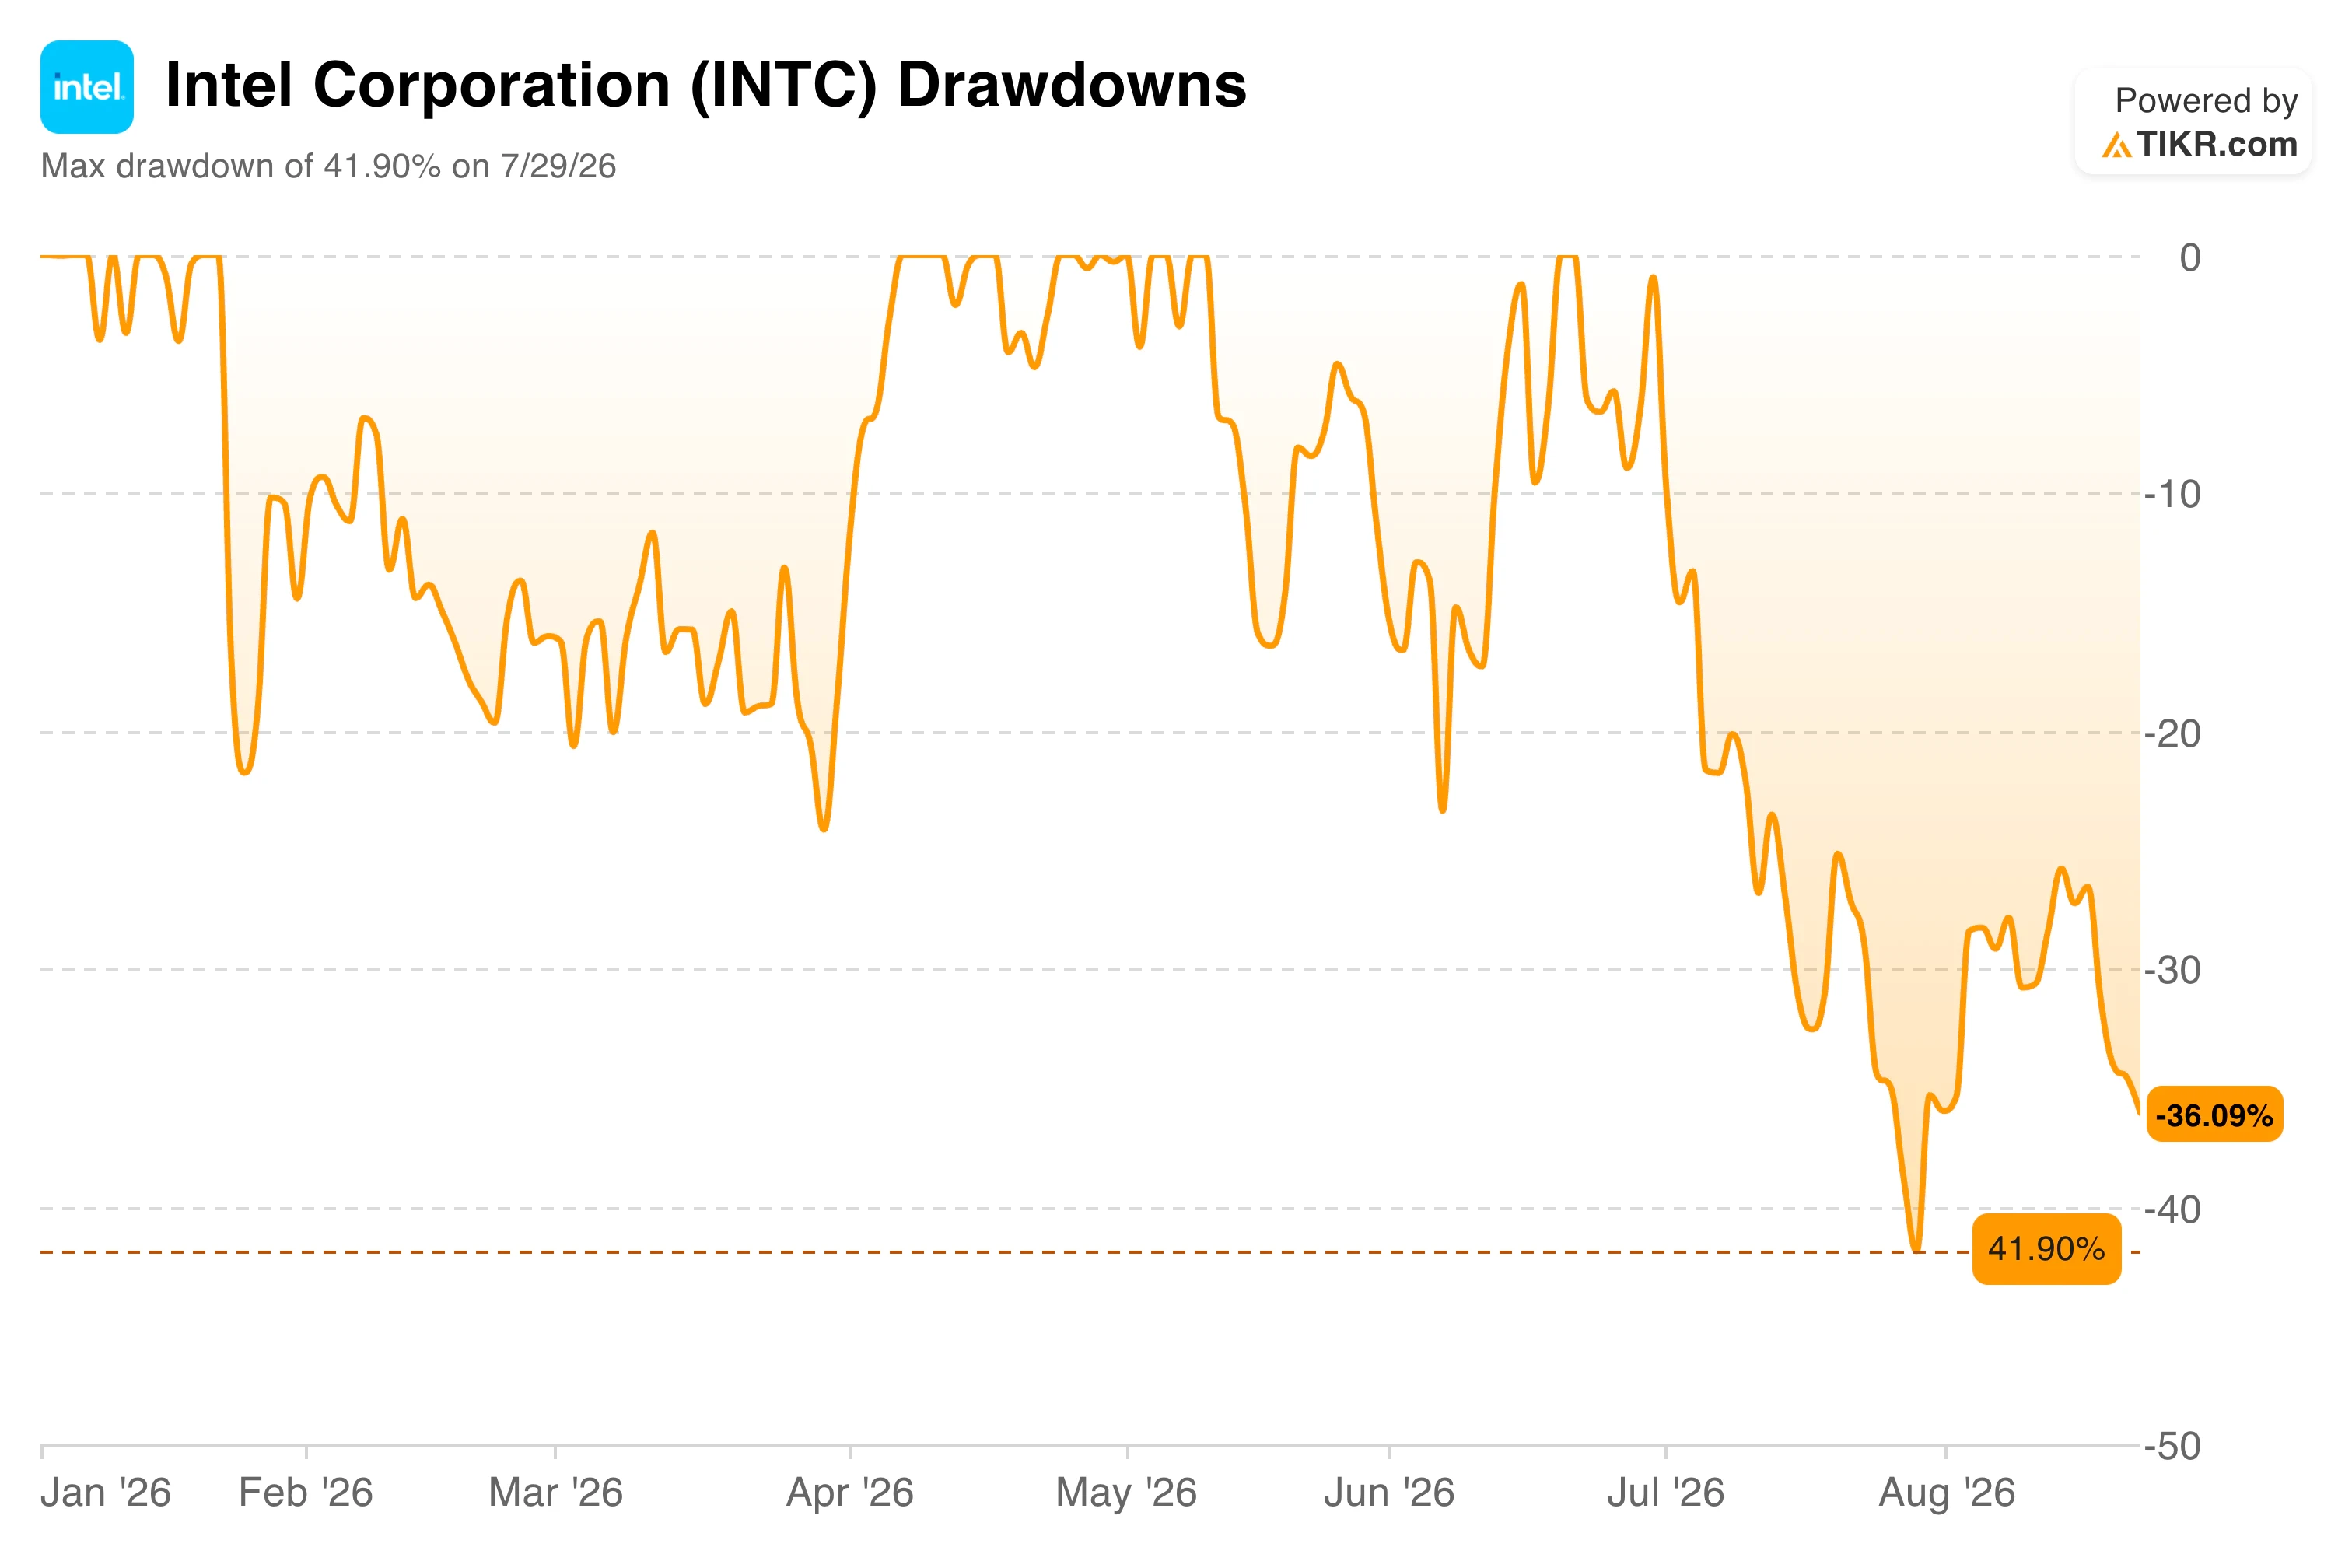
Then July arrived, and the mood shifted. Q2 earnings delivered a revenue beat and Q3 guidance above expectations, with revenue projected at $13.8 billion to $14.8 billion and non-GAAP EPS of $0.38. Markets did not reward it. Investors reassessed how much turnaround progress was already priced in at $142 and sold sharply.
Just days after the selloff, Tan filed an SEC disclosure showing he had personally purchased 105,623 shares at $95, roughly $10 million of his own money, at a price above where the stock trades today.
See historical and forward estimates for Intel stock (It’s free!) >>>
Five Years of Decline, One Recovery Path
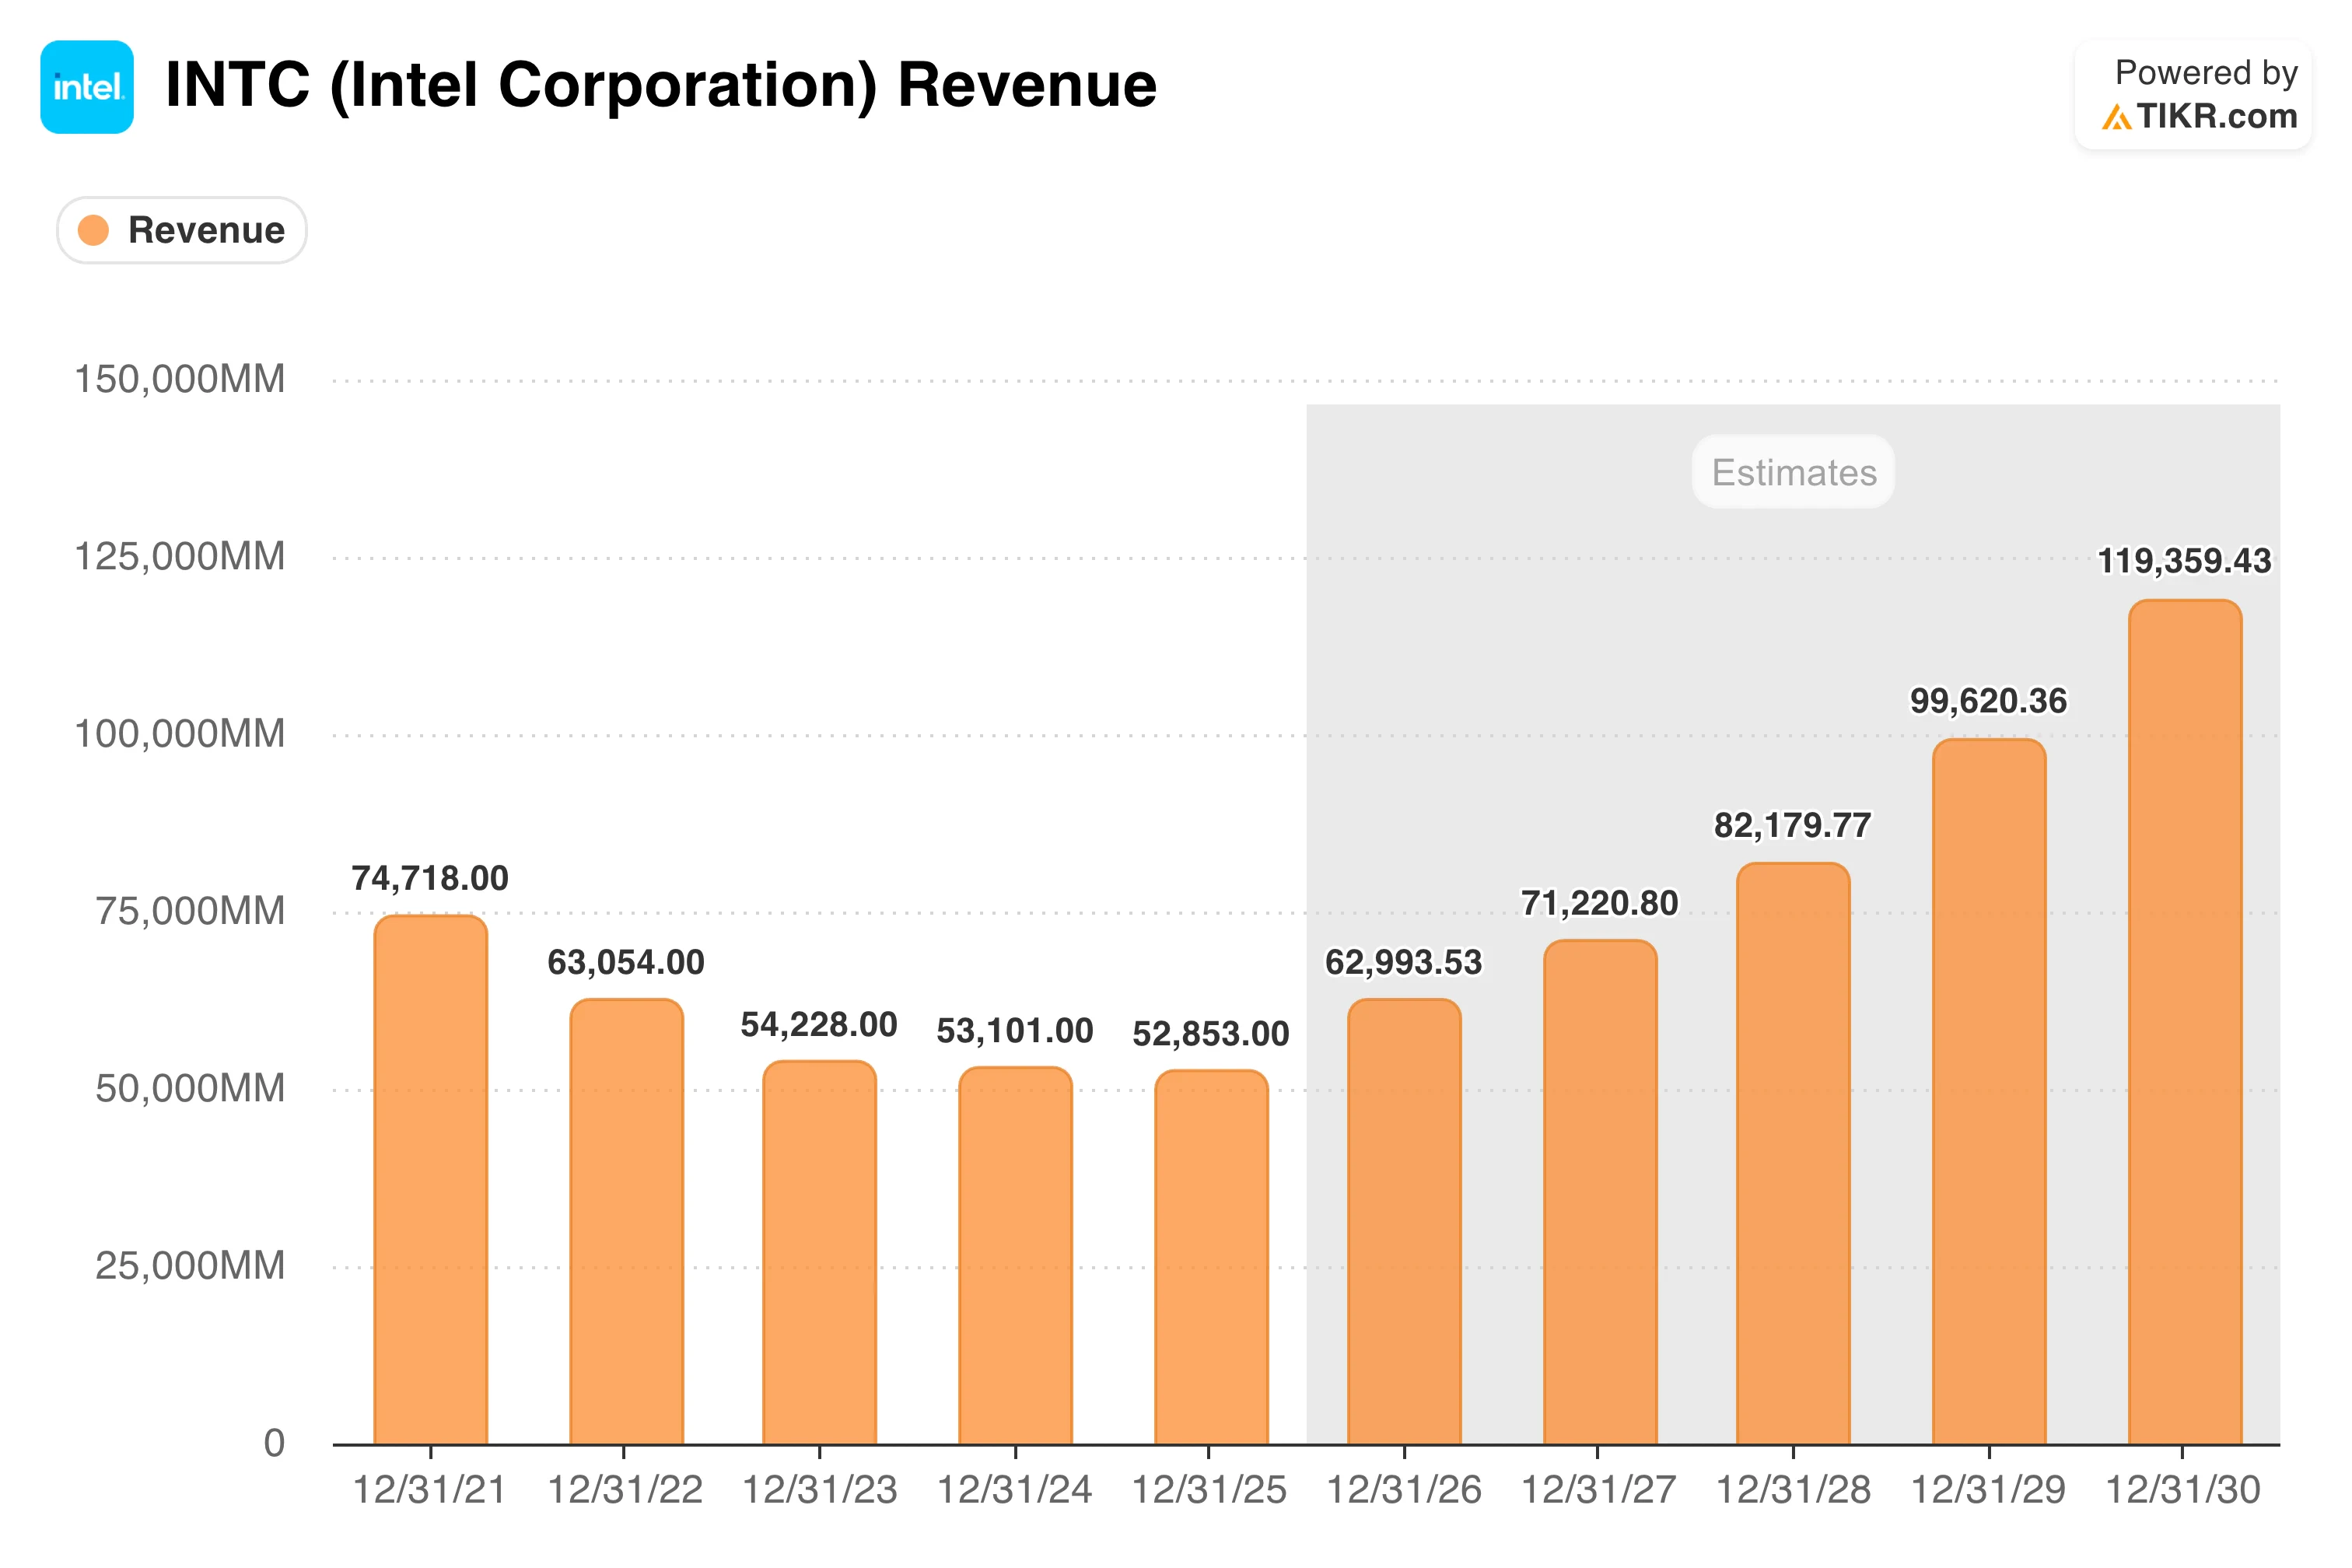
The revenue chart tells the honest story of what Intel is recovering from. At its peak in 2021, Intel generated $74.7 billion in revenue. Then came five consecutive years of decline: $63.1 billion in 2022, $54.2 billion in 2023, $53.1 billion in 2024, and $52.9 billion in 2025.
The business shed nearly $22 billion in annual revenue over four years as AMD took CPU market share and TSMC pulled ahead on manufacturing.
Consensus estimates project that the recovery is underway. Analysts model revenue climbing back to around $63 billion in 2026, $71 billion in 2027, and accelerating toward $82 billion in 2028, with the trajectory continuing toward $120 billion by 2030.
Driving that recovery thesis are two distinct engines. The first is Intel’s product business, where Data Center and AI revenue jumped 22% year over year to $5.05 billion in Q2, beating estimates of $4.41 billion. CEO Tan has highlighted that the shift toward “agentic AI” is expanding demand for advanced CPUs and wafer packaging.
The second is Intel Foundry, where the 18A process node has entered volume production with yields running ahead of internal targets. Intel also raised $23 billion through a recent share sale, providing additional capital runway for foundry expansion.
See how Intel performs against its peers in TIKR (It’s free!) >>>
What the Valuation Model Says About Intel Stock
Intel’s valuation is genuinely difficult to assess because the company sits between two different business profiles.
Based on current earnings, the stock is expensive at 54 times forward earnings, but that multiple reflects a company in transition rather than a steady-state business. On the turnaround thesis, a very different picture emerges.
TIKR’s valuation model targets around $202 per share based on mid-case assumptions, implying roughly a 124% total return from current levels over approximately four and a half years.
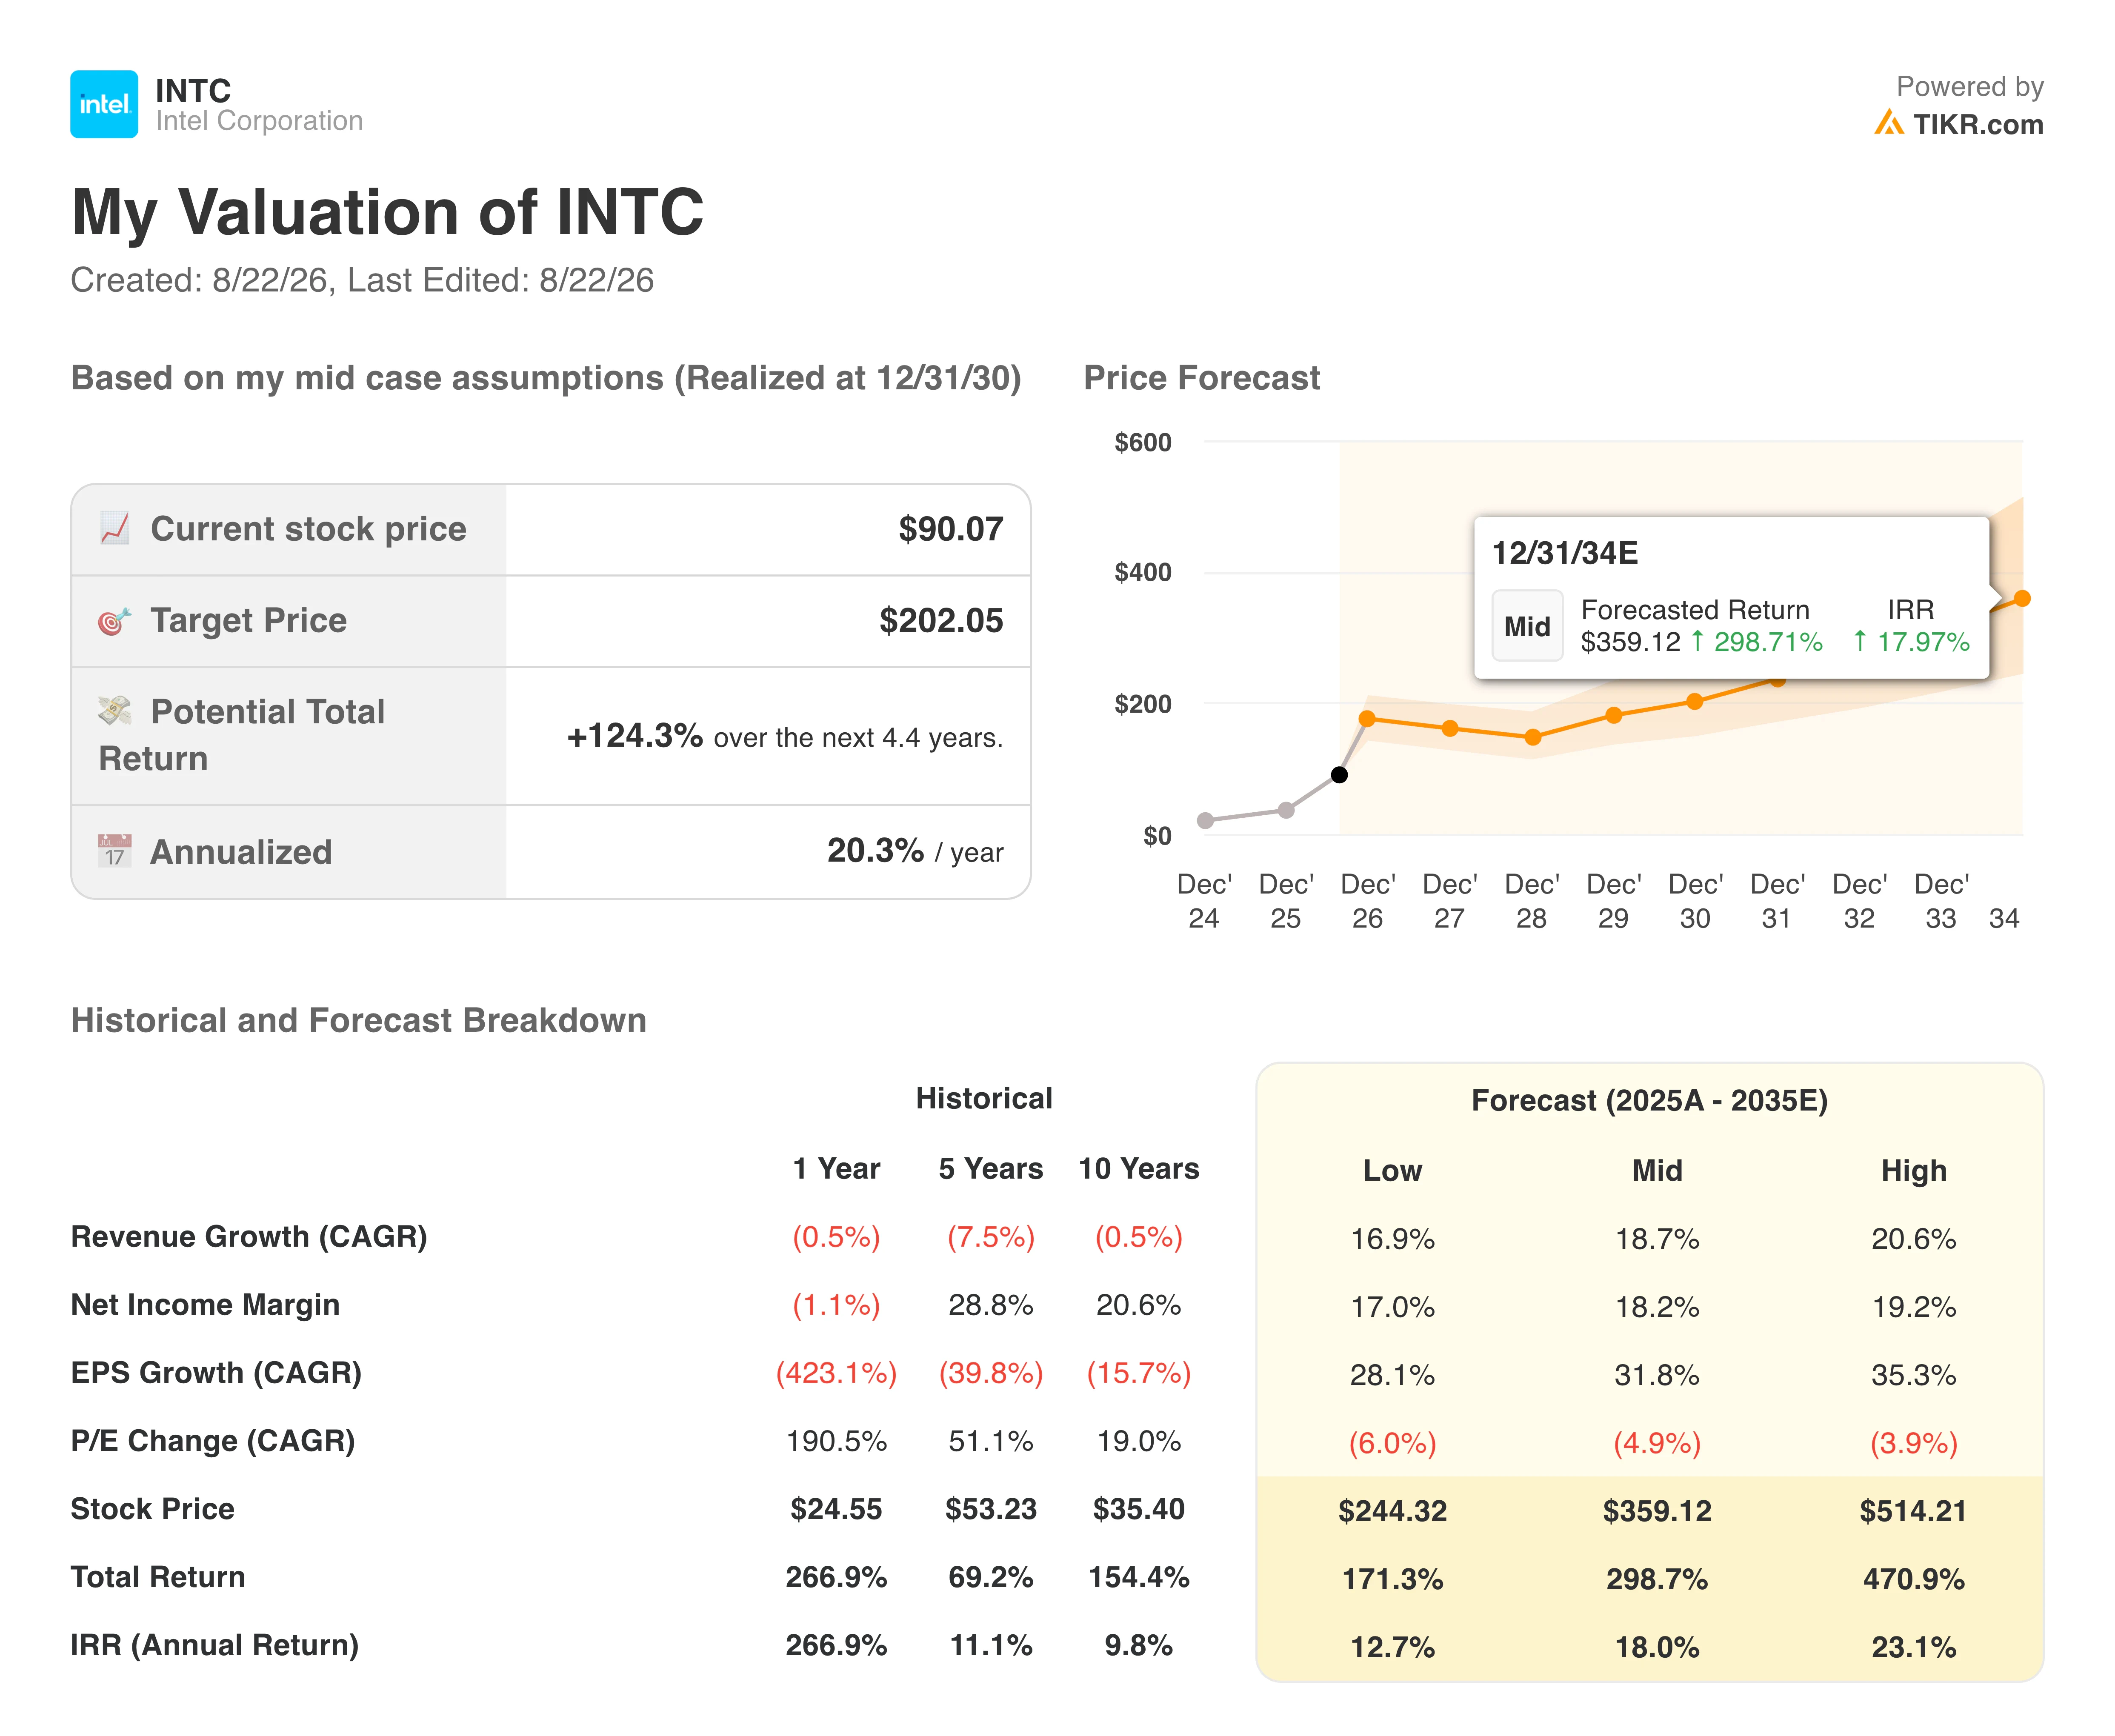
The annualized return works out to around 20% per year. Investors should understand what those assumptions require: mid-case revenue growth of around 19% annually, net income margins recovering to roughly 18%, and continued foundry scaling toward profitability.
These are not small asks for a company that lost $0.73 per share in Q1 2026 on a GAAP basis and still runs its foundry segment at an operating loss.
A more extended scenario to 2034 puts the mid-case price near $359 at roughly an 18% annualized IRR. The bull case is real, but it demands execution that Intel has not yet fully demonstrated.
Should You Buy Intel Stock?
Intel is one of the most genuinely polarizing stocks in the market. The turnaround progress is real. Lip-Bu Tan has stabilized the company, secured major partnerships, demonstrated 18A production yields improving ahead of schedule, and guided Q3 revenue well above the prior consensus.
The fact that the CEO bought $10 million of stock below current prices signals confidence that the selloff has been overdone. Wall Street consensus is Hold across 45 analysts, with 9 Strong Buys and a mean target near $115, implying roughly 28% upside from here.
The risks are equally substantial. Intel Foundry is still losing billions of dollars per quarter. The company has not yet landed a major anchor external customer committed to volume production on 18A.
GAAP losses continue. PC demand is expected to weaken in the second half of 2026. The valuation model’s return assumptions require a revenue trajectory that Intel has not historically been close to achieving.
For investors with high conviction in the foundry thesis and patience for multi-year execution risk, the pullback to $90 may represent an opportunity. For everyone else, this remains a speculative position in a company still in the early stages of proving its most important bet.
See analysts’ growth forecasts and price targets for Intel stock (It’s free!) >>>
Looking for New Opportunities?
- See which stocks billionaire investors are buying to follow the smart money.
- Analyze stocks in as little as 5 minutes with TIKR’s all-in-one, easy-to-use platform.
- The more rocks you overturn… the more opportunities you’ll uncover. Search 100K+ global stocks, global top investor holdings, and more with TIKR.
Disclaimer:
Please note that the articles on TIKR are not intended to serve as investment or financial advice from TIKR or our content team, nor are they recommendations to buy or sell any stocks. We create our content based on TIKR Terminal’s investment data and analysts’ estimates. Our analysis might not include recent company news or important updates. TIKR has no position in any of the stocks mentioned. Thank you for reading, and happy investing!