Key Takeaways for Intel Stock as of August 2026
- Revenue grew 25% year-over-year to $16.13 billion in the quarter ended June 27, 2026.
- Operating margins expanded to 12.2%, a sharp reversal from a 2.9% operating loss margin in the year-ago quarter.
- TIKR’s model values Intel stock at approximately $199 by late 2030, implying roughly 121% total return from the current price.
Intel’s Data Center Segment Grows 59% as AI Demand Outpaces Supply

Intel (INTC) delivered its seventh consecutive quarter of exceeding financial guidance, with second quarter 2026 revenue of $16.1 billion landing $1.8 billion above the midpoint of the company’s own forecast. CEO Lip-Bu Tan told investors the company is now seeing its strongest revenue growth in more than 15 years, a claim that lines up with what the income statement shows.
The engine behind that growth was demand for AI infrastructure. Collectively, Intel’s AI-driven businesses grew more than 70% year over year and now make up roughly 70% of total revenue, spanning everything from data center CPUs to purpose-built silicon.
Tan opened the Q2 earnings call by framing the quarter plainly: “Revenue, gross margin, earnings per share were above our guidance. This marks the seventh consecutive quarter of exceeding our financial expectations.” That framing matters because it signals the beat was broad-based rather than the product of one standout segment.
Data Center AI Group (DCAI), the unit selling server processors and infrastructure silicon to cloud and enterprise customers, posted 59% year-over-year revenue growth as hyperscale and enterprise demand accelerated. CFO David Zinsner said server CPU demand has “improved again since our last earnings report,” with double-digit unit growth now expected for both this year and next.
Client Computing and Physical AI Group (CCPG), Intel’s renamed PC business now covering AI at the edge, grew 15% sequentially as AI PC revenue rose to represent two-thirds of the client mix. Intel Foundry, the company’s chip manufacturing arm that also produces wafers for outside customers, generated $5.8 billion in revenue as its newest 18A manufacturing process ran roughly 25% above its internal output target.
The company’s core tension going forward is supply, not demand. Zinsner was explicit that even as wafer output improves through the third quarter, Intel “will not catch up” with customer orders before the fourth quarter. That shortfall means the revenue growth investors just saw likely understates true demand for Intel’s products.
Intel’s Operating Margin Just Flipped Positive: Is the Leverage Real?
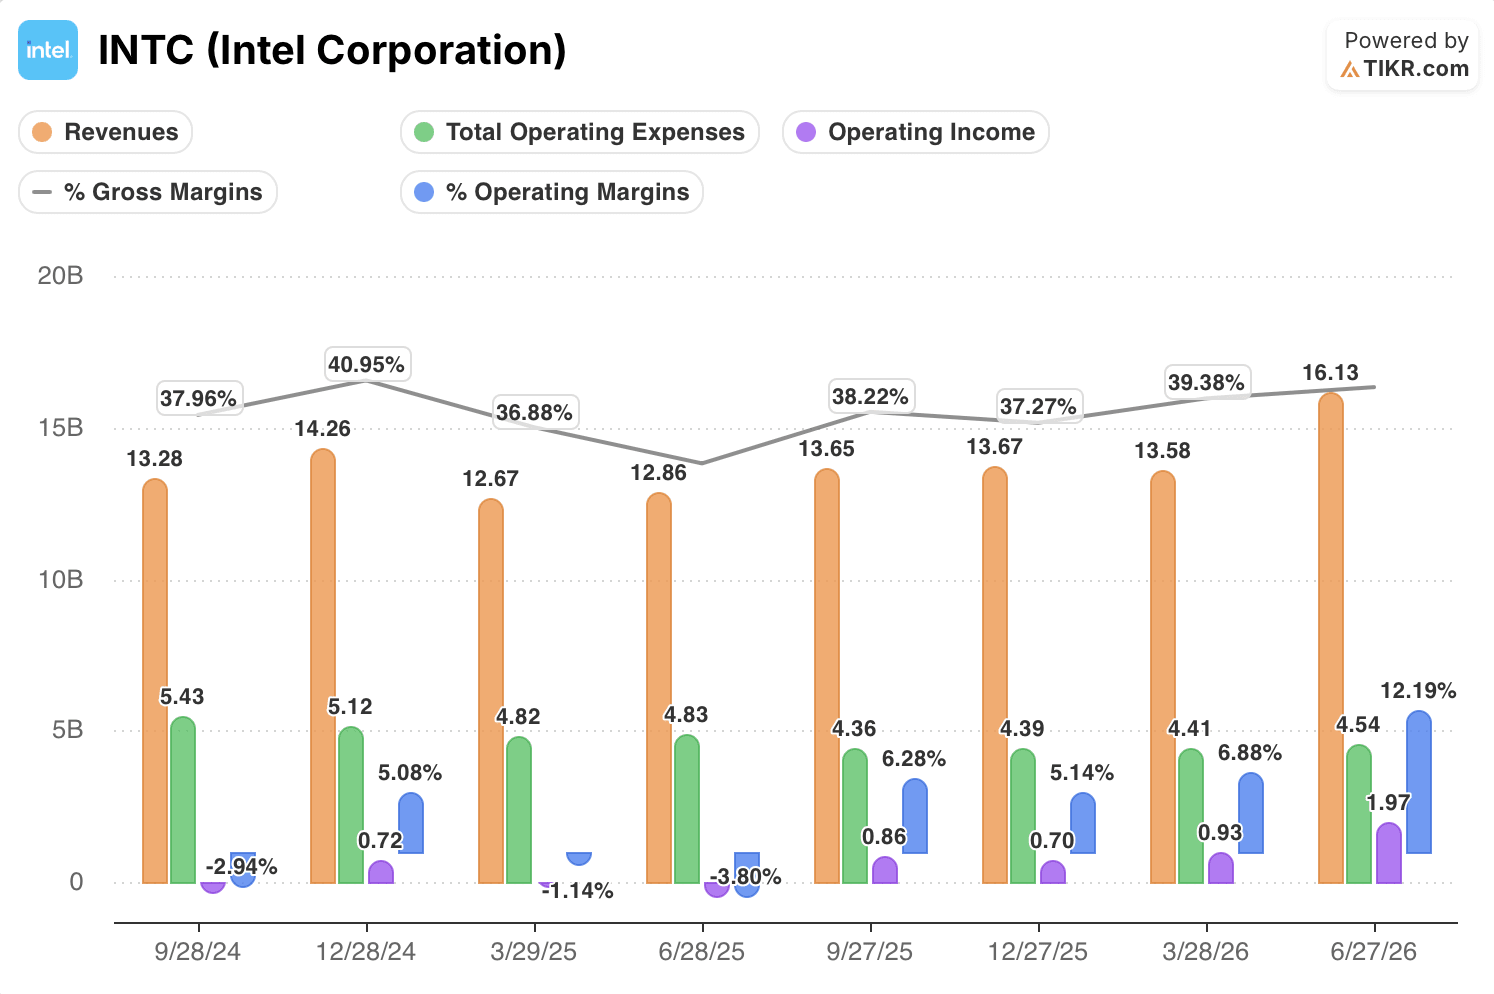
Revenue climbed 25% year over year in the quarter ended June 27, 2026, the sharpest growth rate anywhere in the dataset examined here.
Total operating expenses, spanning selling costs, R&D, and other overhead, totaled $4.54 billion for the same period, a figure management has kept remarkably contained.
That expense base has barely moved across seven consecutive quarters, even as the top line just posted its steepest single-quarter acceleration in recent memory, the exact dynamic that defines operating leverage.
Pricing power showed up directly in the gross line, with margin reaching 40.4% in the quarter, the strongest reading anywhere in the data provided.
That strength flowed straight to the bottom line, as operating income totaled $1.97 billion for the period rather than getting absorbed into higher spending.
Operating margin landed at 12.2%, a decisive swing from the negative 2.9% margin the company posted in the same quarter a year earlier.
Intel Closes the Margin Gap With Qualcomm While Nvidia Still Leads by a Wide Margin
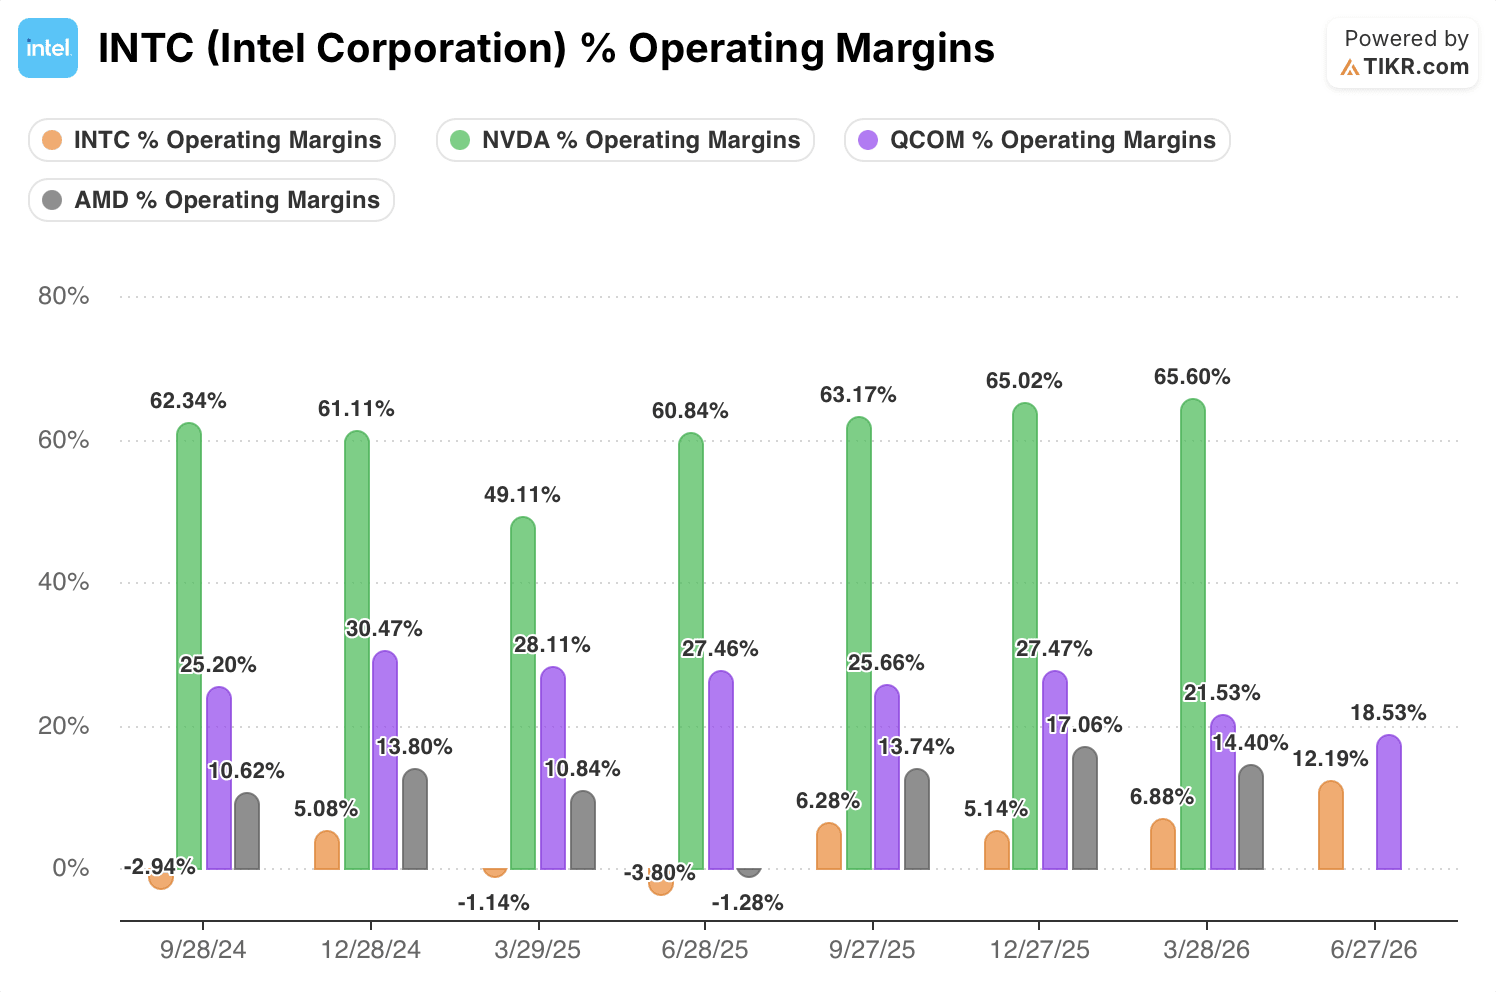
Intel’s operating margin reached 12.19% in the quarter ended June 27, 2026, the most recent period with results on the board. Qualcomm (QCOM) posted an 18.53% operating margin over that same quarter, keeping Intel behind on pure profitability even after its own recovery.
Nvidia (NVDA) and Advanced Micro Devices (AMD) have not yet reported that same quarter, so the clearest available comparison sits one period back: Nvidia’s operating margin stood at 65.60% in the quarter ended March 28, 2026, more than nine times Intel’s own 6.88% margin from that same stretch.
AMD posted a 14.40% operating margin in that same quarter, also its most recent reported period, still well ahead of Intel’s contained recovery. Intel’s inflection is real, but it is closing a gap against peers whose margins already sit in a different tier entirely.
TIKR’s $199 Target on Intel Stock: Does the Operating Leverage Hold Up?
TIKR’s model values Intel stock at approximately $199 by the end of 2030, implying around 121% total return from the current price of $90, or roughly 20% per year.
That same data center surge is the exact growth vector TIKR’s model is betting will keep compounding through 2030.

That target depends on the operating leverage already visible in the income statement continuing rather than reversing.
Operating margin has now moved from a loss into double digits within roughly seven quarters, and TIKR’s target assumes that trajectory keeps extending outward.
For the target to hold, revenue growth needs to keep outrunning the growth in operating expenses the way it did in the most recent quarter.
Should You Invest in Intel Corporation?
The only way to really know is to look at the numbers yourself. TIKR gives you free access to the same institutional-quality financial data that professional analysts use to answer exactly that question.
Pull up Intel Corporation stock and you’ll see years of historical financials, what Wall Street analysts expect for revenue and earnings in the quarters ahead, how valuation multiples have moved over time, and whether price targets are trending up or down.
You can build a free watchlist to track Intel Corporation alongside every other stock on your radar. No credit card required. Just the data you need to decide for yourself.
Access Professional Tools to Analyze INTC stock on TIKR for Free →
Looking for New Opportunities?
- See what stocks billionaire investors are buying so you can follow the smart money.
- Analyze stocks in as little as 5 minutes with TIKR’s all-in-one, easy-to-use platform.
- The more rocks you overturn… the more opportunities you’ll uncover. Search 100K+ global stocks, global top investor holdings, and more with TIKR.
Disclaimer:
Please note that the articles on TIKR are not intended to serve as investment or financial advice from TIKR or our content team, nor are they recommendations to buy or sell any stocks. We create our content based on TIKR Terminal’s investment data and analysts’ estimates. Our analysis might not include recent company news or important updates. TIKR has no position in any stocks mentioned. Thank you for reading, and happy investing!