


Key Stats for Ford Stock
- 52-Week Range: $11.06 – $17.78
- Current Price: $14.24
- Street Target Price: ~$15.78
- NTM P/E: ~8x
- YTD Return: +6.7%
- Dividend Yield: 4.2%
- Market Cap: ~$57B
- Fwd 2-Yr Revenue CAGR: ~2%
Now Live: Discover how much upside your favorite stocks could have using TIKR’s new Valuation Model (It’s free)>>>
The Business Is Improving. The Headwinds Are Real Too
Strip away the noise, and Ford’s (F) story in 2026 comes down to something fairly clear: the commercial vehicle business is healthy, the traditional consumer lineup is holding its own, and the EV unit is losing money at a pace that has no quick fix. Q2 2026 adjusted EBIT came in at $2.5 billion, beating estimates by a meaningful margin, and full-year guidance was raised to $10-$11 billion.
Ford Pro, the division that serves contractors, municipalities, and fleet operators with trucks and vans, delivered $1.7 billion in EBIT despite a meaningful constraint, the Novelis shortage, which limited F-Series body panel production through most of the quarter. Ford Blue, the consumer ICE business, added $1.1 billion in EBIT, up 72% year over year.
Three headwinds are active simultaneously and worth naming directly. Tariffs on imported vehicles and components added an estimated $1.5 billion in costs during the first half of 2026.
The Novelis aluminum shortage is expected to continue limiting F-Series volume through year-end, which stings given the F-Series is Ford’s highest-margin product line. And Model e, the EV division, is on track to lose roughly $4 billion for the full year, a drag management has said will persist until 2029.
The revenue chart puts those dynamics in honest context.
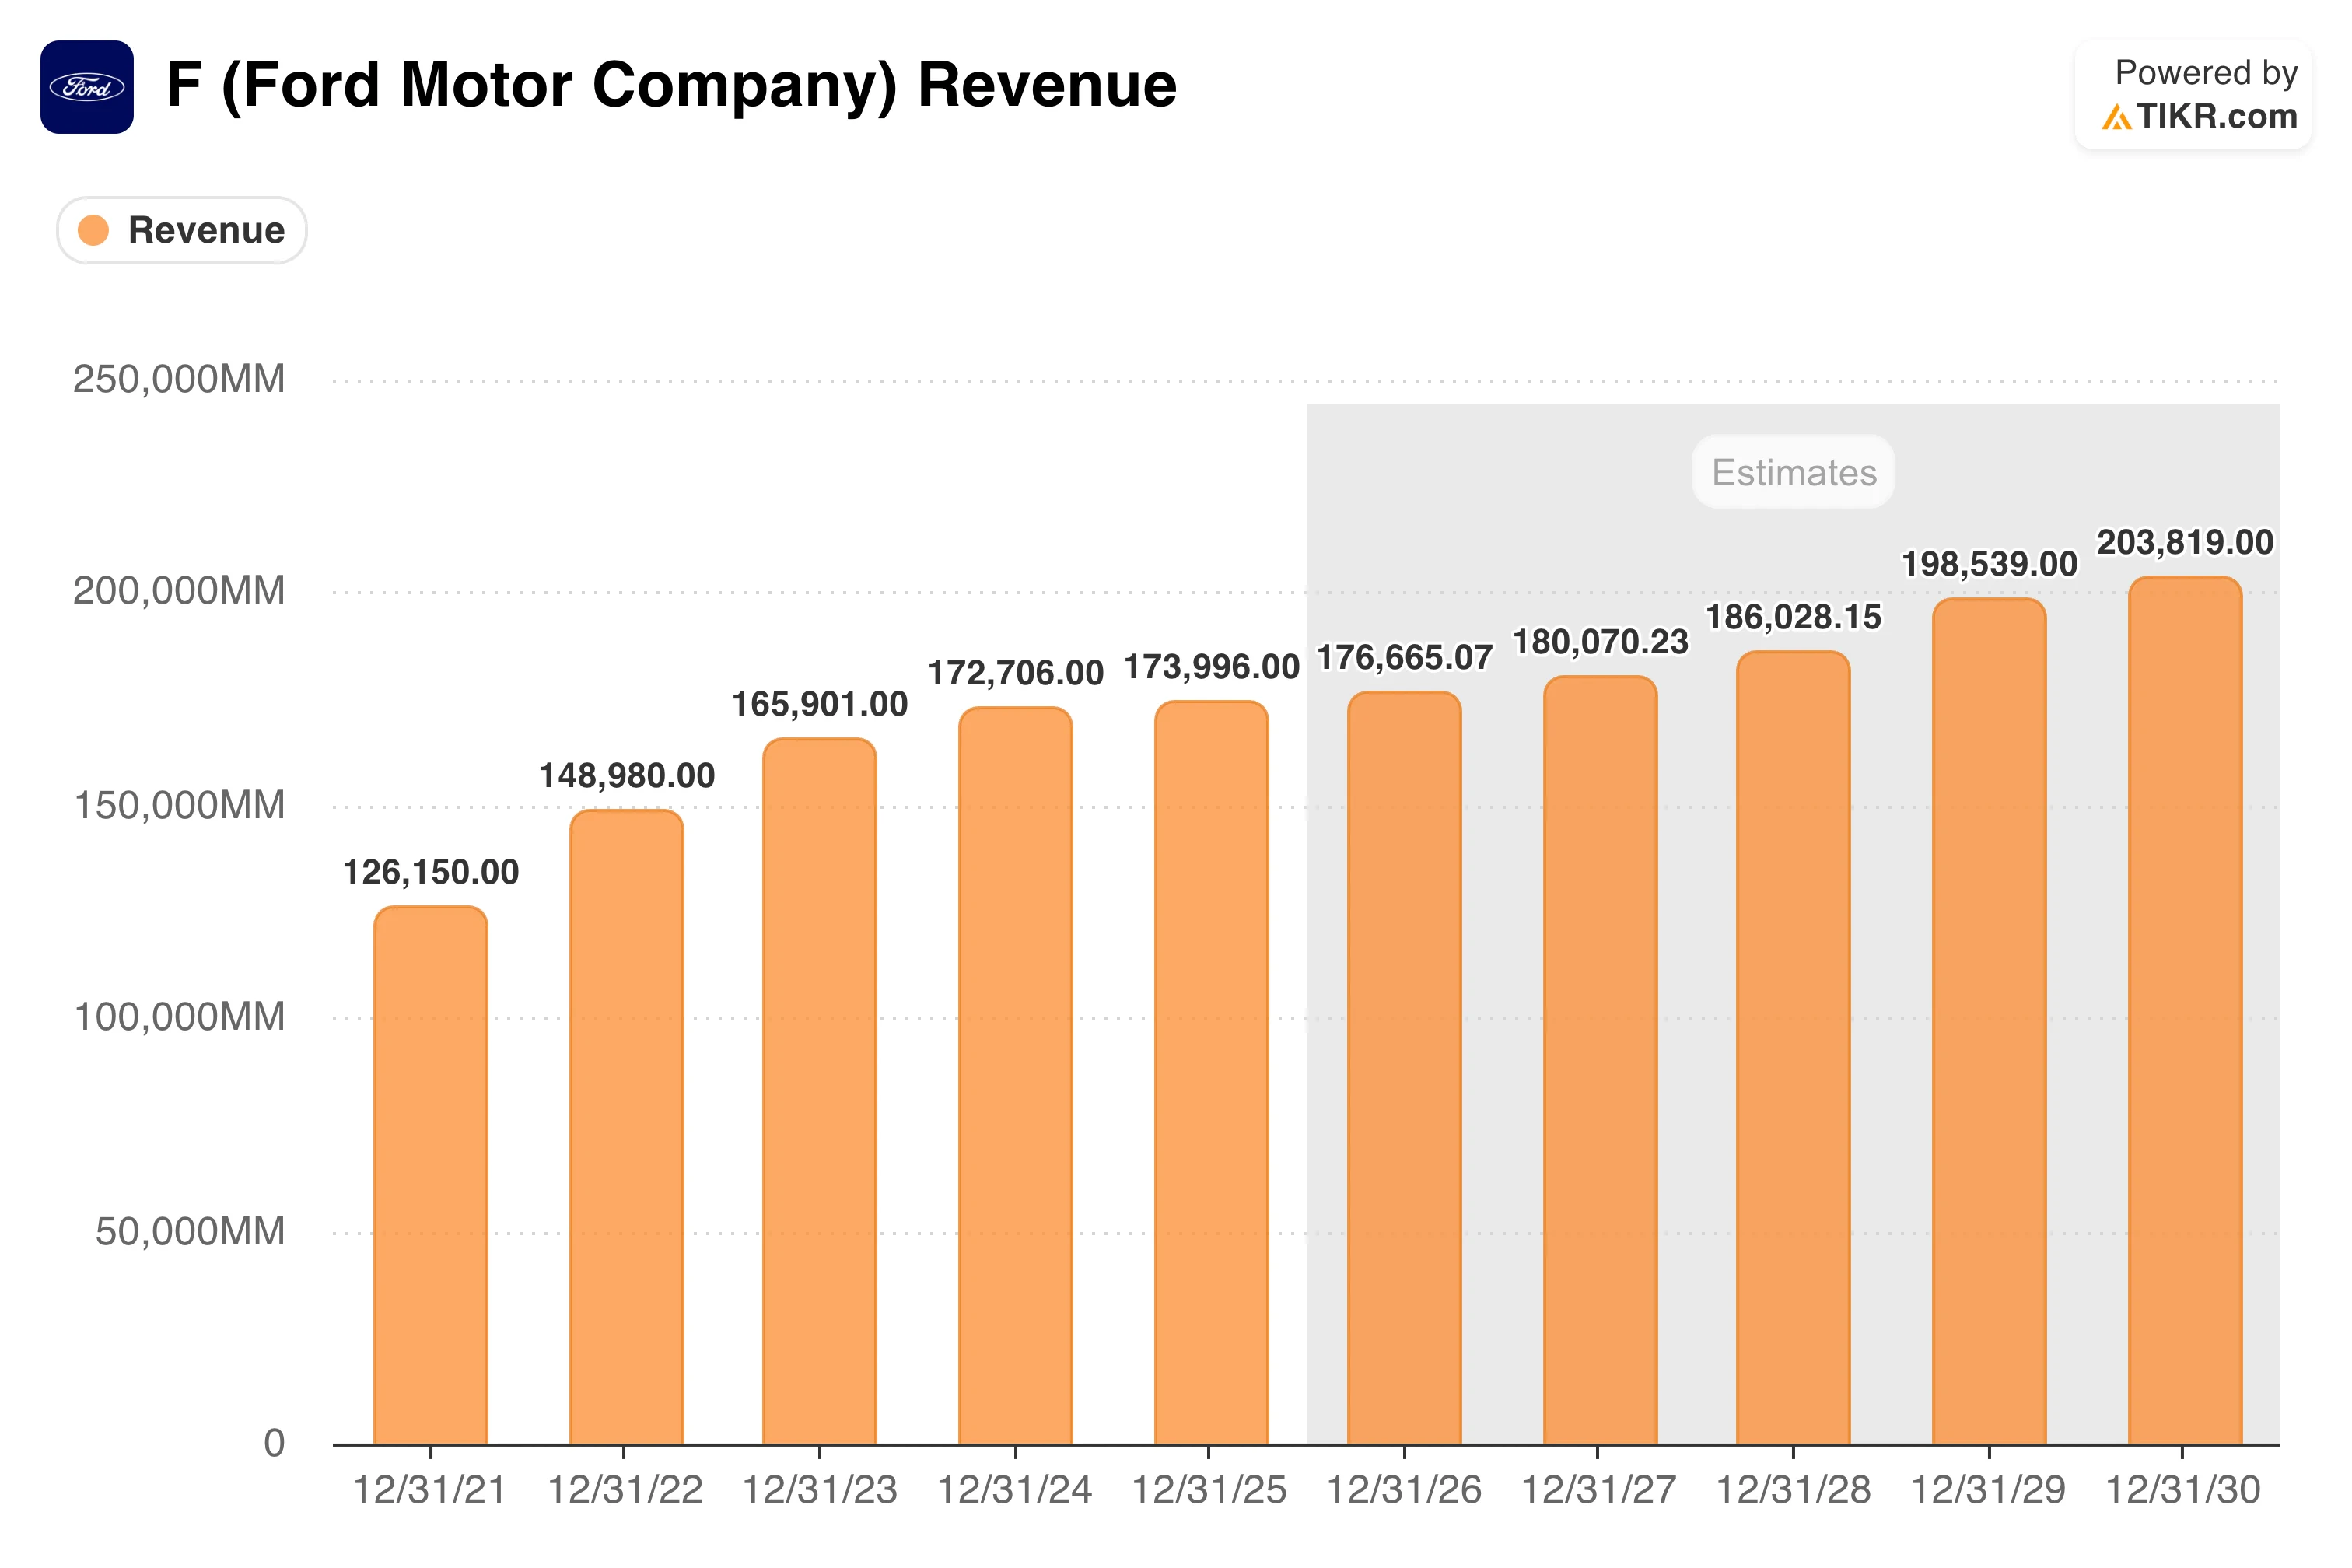
Ford generated $174 billion in revenue in 2025, with consensus pointing to $177 billion in 2026 and around $204 billion by 2030. Growth of roughly 2% annually is not an expansion story. It reflects a mature manufacturer trying to hold its position while managing a technology transition, trade exposure, and supply constraints simultaneously.
See analysts’ growth forecasts and price targets for AMD stock (It’s free) >>>
Free Cash Flow Is What Dividend Investors Should Watch
Revenue tells part of the story, but for a capital-intensive manufacturer paying a 4.2% dividend through an expensive EV buildout, cash generation is what actually matters. The FCF picture here is more interesting than the flat revenue trajectory suggests.
FCF was $9.6 billion in 2021, fell to essentially zero in 2022 as supply chain chaos and early EV investment collided, then stabilized around $6.7 billion in both 2023 and 2024.
The 2025 figure jumped to $12.5 billion, well above what most observers expected, reflecting genuine improvement in capital discipline across the business.

The catch is that full-year 2026 FCF guidance sits at $6-$7 billion, roughly half the 2025 level. Some of the 2025 strength came from working capital timing that will not repeat.
The Novelis constraint is limiting F-Series output, which directly reduces cash generation from Ford’s most profitable line, and continued Model e losses compound the pressure. Even at the low end of guidance, though, the $3 billion annual dividend obligation is covered comfortably.
See analysts’ growth forecasts and price targets for Ford Motor stock (It’s free) >>>
What the Valuation Model Says About Ford Stock
The TIKR valuation model mid-case target comes out to around $21, representing a potential total return of roughly 46% at around 9% annualized over 4.4 years. The model assumes revenue growing at around 2% annually, net income margins near 4.5%, and EPS compounding at around 9% per year.
Multiple compression of about 4% annually is baked in, meaning earnings growth has to overcome a shrinking multiple to deliver those returns.

Adding the 4.2% dividend yield lifts the total annual return picture into the 10-12% range, which is the more complete picture of what Ford actually offers investors. The Street consensus of around $15.78 implies only modest price upside from current levels.
The high case reaches around $30 at roughly 9.4% on price appreciation alone, a scenario requiring clean execution through 2029 with no additional supply or tariff surprises.
Should You Buy Ford Stock?
Ford’s improving profitability and durable FCF make the 4.2% yield look sustainable, and the TIKR mid-case suggests reasonable total returns if EV losses stay on their guided trajectory and F-Series supply normalizes.
Getting there requires navigating a more complex operating environment than the headline numbers imply, though.
Tariff exposure is among the highest of any major U.S. automaker, the aluminum shortage has no immediate fix, and Model e losses run well into the decade. At 8x forward earnings, Ford is priced for modest expectations, and meeting them is harder than it looks.
Estimate a company’s fair value instantly (Free with TIKR) >>>
Looking for New Opportunities?
- See which stocks billionaire investors are buying to follow the smart money.
- Analyze stocks in as little as 5 minutes with TIKR’s all-in-one, easy-to-use platform.
- The more rocks you overturn… the more opportunities you’ll uncover. Search 100K+ global stocks, global top investor holdings, and more with TIKR.
Disclaimer:
Please note that the articles on TIKR are not intended to serve as investment or financial advice from TIKR or our content team, nor are they recommendations to buy or sell any stocks. We create our content based on TIKR Terminal’s investment data and analysts’ estimates. Our analysis might not include recent company news or important updates. TIKR has no position in any of the stocks mentioned. Thank you for reading, and happy investing!


