Key Stats for Walmart Stock
- Current Price: $120.59
- Target Price (Mid): ~$145
- Street Target: ~$138
- Potential Total Return: ~20%
- Annualized IRR: ~4% / year
- Earnings Reaction: -0.88% (May 21, 2026)
- Max Drawdown: -15.75% (June 2, 2026)
Now Live: Discover how much upside your favorite stocks could have using TIKR’s new Valuation Model (It’s free) >>>
What Happened?
Walmart Inc. (WMT) handed investors a confusing May. The company beat Q1 revenue estimates, grew e-commerce 26% globally for the fourth consecutive quarter above 25%, and held its full-year guidance steady. The stock still fell 12% in May, according to data from S&P Global Market Intelligence, and hit a max drawdown of 15.75% from its all-time high. When you are priced at 40x forward earnings, guidance that comes in even slightly below consensus is enough to trigger real selling. For investors building a Walmart stock 2026 outlook, the question is whether the market is now underpricing what management disclosed at two consecutive investor conferences.
On June 9 and June 10, Walmart U.S. CEO David Guggina and Chief Growth Officer Seth Dallaire presented back-to-back fireside chats at the Oppenheimer Consumer Growth and E-Commerce Conference and the Evercore Consumer and Retail Conference. Both sessions included operational disclosures that went well beyond what the earnings release covered. For investors deciding whether $120 is a buying opportunity or a warning, those two days are worth a careful read.
The Selloff The Market Created
The Q1 FY2027 report, covering the quarter ended April 30, was strong by most measures. Revenue came in at $177.75 billion against a $174.84 billion consensus, a 1.7% beat per TIKR’s Beats and Misses data. Walmart U.S. comparable sales, excluding fuel, grew 4.1% per the company’s investor relations materials. Global e-commerce expanded 26%, pushing digital sales to roughly 25% of Walmart’s U.S. segment revenue.
The problem was Q2 guidance. Management guided adjusted EPS to $0.72–$0.74, slightly below Street consensus near $0.75 per the company’s SEC filing. Operating income also absorbed a 250-basis-point headwind from higher fuel costs in distribution and fulfillment, per the same filing. The stock fell roughly 7% on earnings day per TradingView data, eventually pulling Walmart’s market cap below $1 trillion by week’s end. A June 5 downgrade by Erste Group analyst Hans Engel from Buy to Hold, citing Walmart’s valuation as significantly elevated versus retail peers per Investing.com, extended the full-month decline to 12% per S&P Global Market Intelligence data.
The stock sold off on guidance anxiety. The business itself kept accelerating, which is what both conference sessions documented.

See historical and forward estimates for Walmart stock (It’s free!) >>>
What Guggina Told Oppenheimer That the Earnings Release Did Not
Oppenheimer Senior Food, Grocery and Consumer Products Analyst Rupesh Parikh pressed Walmart U.S. CEO David Guggina for specifics on June 9 that the earnings release did not cover.
The 26% headline e-commerce growth understates the momentum in the underlying businesses. Store-fulfilled delivery grew nearly 50% in Q1. The third-party marketplace grew nearly 50%. Fast delivery sales grew more than 50%. Walmart can now reach 60% of U.S. households within 30 minutes and 95% within three hours. “Our stores are one of Walmart’s greatest competitive advantages,” Guggina said. “About 90% of U.S. households live within 10 miles of a Walmart.”
Sparky, Walmart’s AI shopping agent, was the most consequential new disclosure. Weekly active users grew more than 110% quarter-over-quarter. Sparky-attributed GMV (the total value of goods transacted through the agent) grew more than 150% from the start to the end of Q1, and units purchased through Sparky rose more than 4x year-over-year. The commercial signal is clear: customers using Sparky build baskets roughly 35% larger than non-Sparky users.
On the fulfillment side, same-day and next-day units shipped through Walmart Fulfillment Services (WFS, Walmart’s third-party seller logistics arm) grew approximately 150% in Q1. When marketplace sellers earn a two-day-or-faster delivery badge, conversion rates lift roughly 50%. WFS also costs sellers approximately 15% less than the industry average, giving it a structural advantage in attracting new marketplace participants.
General merchandise, a multi-year soft spot, also turned. Q1 delivered the highest category share gains in five years, led by fashion, hard lines, and private-label brands. Marketplace growth in general merchandise exceeded 40% across home, apparel, and hard lines. A SoHo fashion pop-up earlier in 2026 generated more than 70% higher sales than the prior event, showing that Walmart’s higher-income customer gains are extending into categories the brand previously did not own.

What Dallaire Told Evercore About the Flywheel
Seth Dallaire, Walmart’s EVP and Chief Growth Officer, covered advertising, marketplace, membership, and the VIZIO connected-TV business at the Evercore Consumer and Retail Conference on June 10. These businesses are the core argument for why a traditional retailer trades at 40x earnings.
Walmart Connect, Walmart’s retail media platform, grew 44% in Q1 excluding VIZIO. Dallaire described the roughly $6 billion advertising business as structurally tied to marketplace expansion: more sellers automatically create more advertising demand. Walmart runs continuous A/B tests digitally before committing any format change across its 4,600-plus stores. His argument is that contextual advertising in Walmart’s environment functions more like merchandising than interruption, introducing customers to brands they would not otherwise encounter. That matters for margin: if advertising scales without degrading the experience, it adds operating income without sacrificing traffic.
VIZIO, acquired roughly 1.5 years ago, extends Walmart’s first-party retail data into living rooms via connected TV. Dallaire noted the value is in the post-sale operating system and advertising inventory, not the hardware itself, complementing Walmart Connect’s digital ad capabilities.
Walmart+ continued its momentum. Members spend 4x more than non-members with Walmart overall, make roughly 7x more e-commerce visits, and visit stores approximately 2x more frequently. The Q1 “Who Knew?” campaign drove 50% more paid memberships and delivery trials versus average marketing returns on those topics, and net adds hit a new Q1 high.
What both sessions established is that these are not separate bets. They are one compounding flywheel. More assortment attracts customers. More customers attract advertisers. Advertising revenue funds price investment. Lower prices attract more customers. Each turn tightens Walmart’s cost structure and widens the competitive gap.
See how Walmart performs against its peers in TIKR (It’s free!) >>>
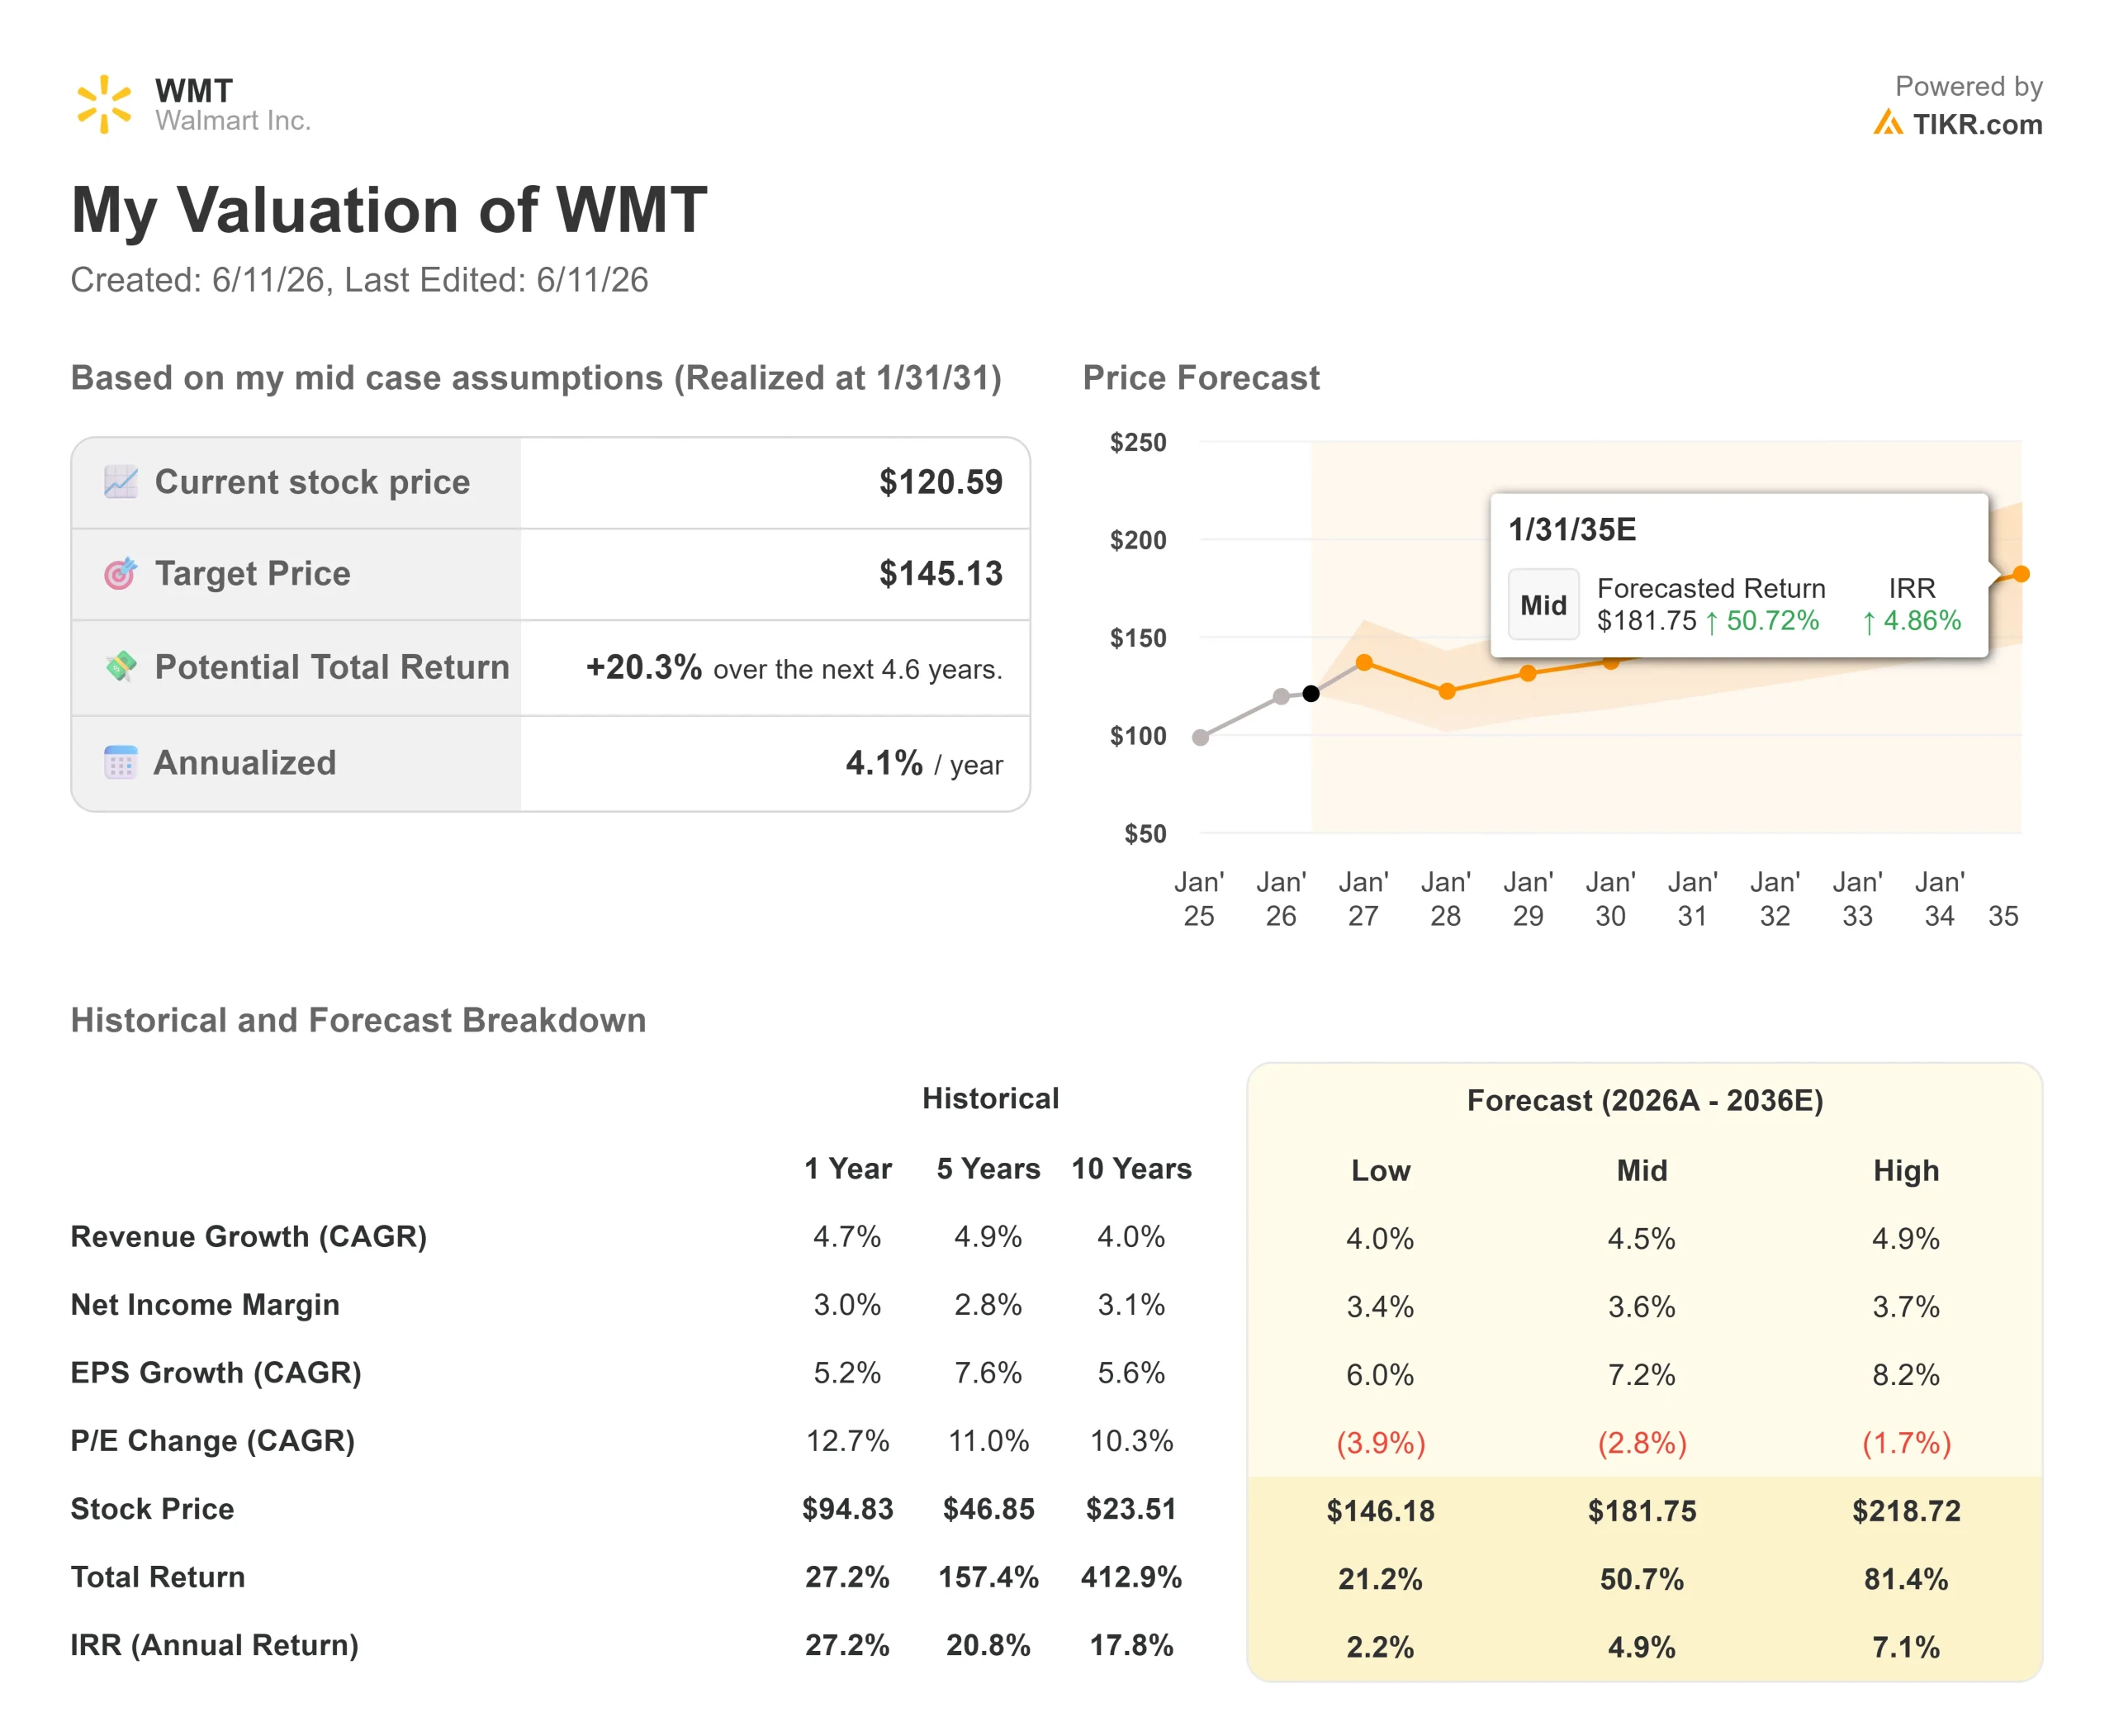
TIKR Advanced Model Analysis
- Current Price: $120.59
- Target Price (Mid): ~$145
- Potential Total Return: ~20%
- Annualized IRR: ~4% / year
See analysts’ growth forecasts and price targets for Walmart stock (It’s free!) >>>
The TIKR mid-case model projects a revenue compound annual growth rate (CAGR) of around 4.5% through January 2031, conservative against Q1’s 7.3% reported revenue growth but appropriate for a business of Walmart’s scale. The two primary CAGR drivers are continued e-commerce penetration in Walmart U.S., currently around 25% of segment sales, and international revenue stabilizing as the global platform strategy matures. The margin driver is operating leverage from advertising, membership, and WFS, all of which carry better profit margins than core grocery. The model reflects net income margins expanding from around 3.0% in FY2026 toward around 3.6% by FY2031.
The mid-case target of around $145 implies approximately 20% total return from $120.59, or about 4% annualized. That is a modest return for a premium stock. Walmart’s NTM EV/EBITDA of 20.57x and NTM P/E of 40.44x leave little room for multiple expansion. In the high case, where advertising and marketplace outgrow the model and margins reach around 3.7%, the target rises to near $219 and around 81% total return. In the low case, where free cash flow growth stalls from sustained fuel pressure and tariff-driven margin compression, the annualized return falls to roughly 2%, a poor outcome for a stock at this valuation multiple.
The Street’s mean target is $138.37 across 41 price target estimators, with a total of 44 analyst recommendations: 29 Buys, 9 Outperforms, 4 Holds, 1 No Opinion, and 1 Sell. Oppenheimer’s Rupesh Parikh, who hosted the June 9 fireside chat, lists Walmart as a top pick. The primary risk is not operational. It is multiple compression: a market reassessing whether a 40x earnings multiple is sustainable for a low-margin, high-revenue retailer, however fast its platform businesses are growing.
Conclusion
The next test is August 20, when Walmart reports Q2 FY2027 results. The metric to watch is Q2 operating income growth. Management guided 7%–10% in constant currency. If the result lands at the high end, the Q1 fuel cost headwind looks transitory, and the path from $120 back toward the Street’s $138 mean target opens. If it comes in at the low end and Q3 guidance turns cautious, the case for owning a 40x multiple retailer becomes harder to sustain. The June conferences showed the platform accelerating on every operational metric. August shows whether the income statement is keeping up.
See what stocks billionaire investors are buying so you can follow the smart money with TIKR.
Should You Invest in Walmart?
The only way to really know is to look at the numbers yourself. TIKR gives you free access to the same institutional-quality financial data that professional analysts use to answer exactly that question.
Pull up Walmart, and you’ll see years of historical financials, what Wall Street analysts expect for revenue and earnings in the quarters ahead, how valuation multiples have moved over time, and whether price targets are trending up or down.
You can build a free watchlist to track Walmart alongside every other stock on your radar. No credit card required. Just the data you need to decide for yourself.
Analyze Walmart on TIKR Free →
Looking for New Opportunities?
- See what stocks billionaire investors are buying so you can follow the smart money.
- Analyze stocks in as little as 5 minutes with TIKR’s all-in-one, easy-to-use platform.
- The more rocks you overturn… the more opportunities you’ll uncover. Search 100K+ global stocks, global top investor holdings, and more with TIKR.
Disclaimer:
Please note that the articles on TIKR are not intended to serve as investment or financial advice from TIKR or our content team, nor are they recommendations to buy or sell any stocks. We create our content based on TIKR Terminal’s investment data and analysts’ estimates. Our analysis might not include recent company news or important updates. TIKR has no position in any stocks mentioned. Thank you for reading, and happy investing!