Key Stats for V Stock
- Past week performance: +1.7%
- 52-week range: $294 to $386
- Valuation model target price: $502
- Implied upside: 36.5% over 2.0 years
Map Visa’s next two years with 5 years of analyst forecasts in TIKR’s Valuation Model (It’s free) >>>
Visa Stakes Its Claim in Stablecoins and the Gulf
Visa (V) shares gained about 1.7% over the past week, closing near $368 on Monday. The stock now trades within 5% of its 52-week high of $386. Investors seem comfortable holding shares into fiscal year results on October 27, since recent news reinforced Visa’s growth runway.
A new Visa study grabbed attention this week. It found U.S. intent to use stablecoins for cross-border transfers jumps from 36% to 56% when bank style protections are added. Stablecoins are digital tokens pegged to a currency such as the U.S. dollar. So the real barrier looks like trust, which plays directly to Visa’s strength as a regulated network.
Visa also pushed deeper into Saudi Arabia. It expanded Visa Direct, its real time money transfer service, with three major Saudi banks. Card transactions on Visa Direct in the country grew more than 50% from a year earlier. And the Saudi central bank certified Visa’s platform to process online payments locally.
Those moves build on a strong fiscal Q3, when net revenue rose 14% to $11.6 billion and adjusted EPS climbed 11% to $3.32. On the earnings call, CEO Ryan McInerney said, “Quarterly payments volume grew 10% year-over-year in constant dollars to cross $4 trillion, the first time in Visa’s history.” If V stock holds these gains, October results will likely need to confirm that momentum.
Preview Visa’s fiscal 2027 consensus estimates before October 27 on TIKR (It’s free) >>>
Visa Looks Cheaper Than Its Own History

Under valuation model assumptions realized through 9/30/28, the stock is modeled using:
- Revenue Growth (CAGR): 11.9%
- Operating Margins: 67.7%
- Exit P/E Multiple: 25.1x
Based on these inputs, the model estimates a target price of $502, implying a 36.5% total return from the current share price of $368 and a 16.7% annualized return over the next 2.0 years.
A 16.7% annual return clears the 15% mark, which signals a genuinely undervalued stock. That is unusual for a company trading near record highs. The explanation is simple: earnings have grown faster than the share price, so the valuation has compressed.
Visa trades at 25.4x next year’s earnings. That compares with a five-year average P/E of 26.7x and a 10-year average of 28.5x. The model assumes the multiple holds at 25.1x rather than recovering, so the return comes almost entirely from earnings growth.
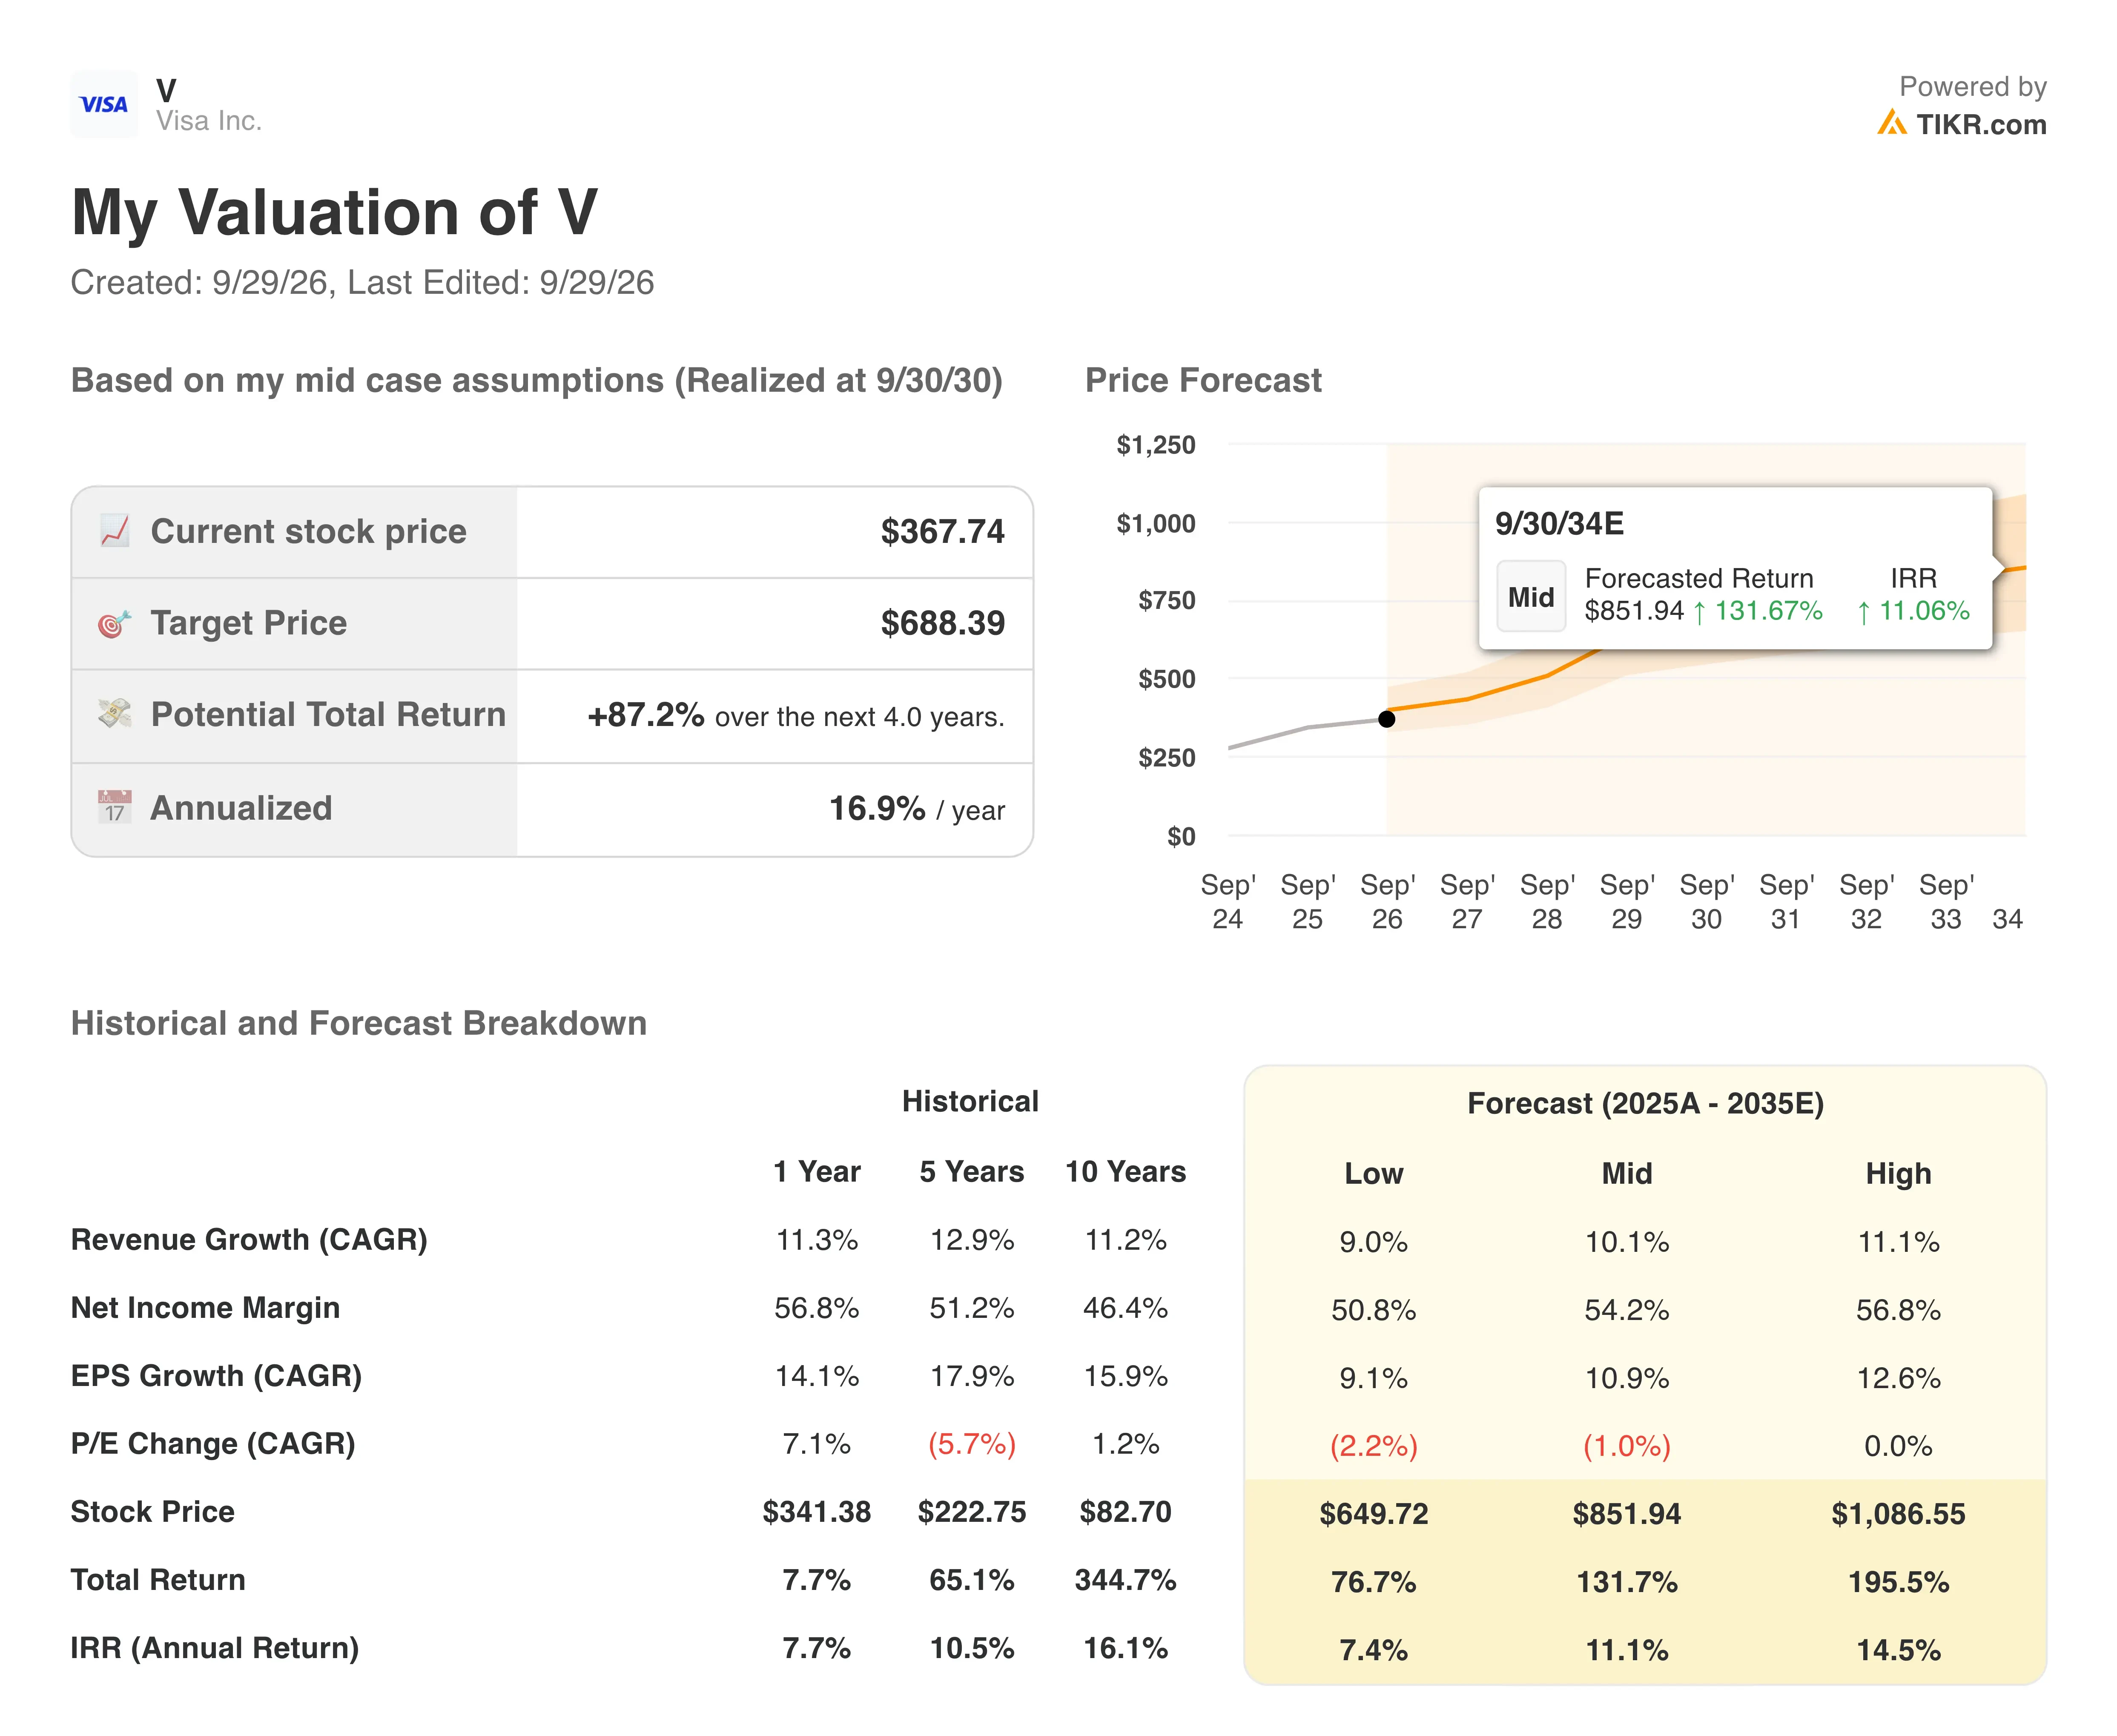
Revenue growth of 11.9% a year matches Visa’s recent record. Sales grew 11.3% over the past year and 12.9% a year over five years. Analysts project 12.7% annual growth over the next two years, because value added services are expanding quickly. Those services, like fraud tools and data analytics, grew 34% last quarter.
Margins leave little room for error, however. A 67.7% operating margin means Visa keeps about 68 cents of every revenue dollar as operating profit. By comparison, Mastercard (MA) posted a 61.1% adjusted operating margin last quarter. The model keeps Visa’s margin flat, which looks reasonable after this year’s 7% workforce reduction.
Estimate a company’s fair value instantly (Free with TIKR) >>>
Mastercard Matches Visa’s Pace, While AmEx Widens Its Reach
Mastercard is Visa’s closest competitor, and the two are growing almost in lockstep. In Q2, Mastercard’s net revenue rose 14% to $9.3 billion, or 12% on a currency neutral basis. Visa posted the same 14% headline growth in its fiscal Q3. However, Visa generated $11.6 billion in net revenue, about 25% more than Mastercard.
The clearest gap shows up in services. Visa’s value added services revenue grew 34% to $3.8 billion, while Mastercard’s equivalent segment grew 20% to about $3.8 billion. Both units are now roughly the same size, yet Visa’s is growing faster. And Mastercard’s 61.1% adjusted operating margin still trails Visa’s 66.9% over the past twelve months.
American Express (AXP) competes differently, because it issues cards and lends money directly. This week it said card acceptance topped 190 million merchant locations worldwide. That narrows one of Visa’s longtime advantages. Meanwhile, Visa, Mastercard, and Ant International are jointly building a trust framework for AI agents that make payments, so the rivals clearly see shared rules as good for the whole industry.
Uncover if resilient payments volume and cross-border growth can revive the stock >>>
What’s Driving V Stock Going Forward?
Fiscal year results on October 27 are the next catalyst. Visa guided for fiscal Q4 net revenue growth at the high end of the low double digits, adjusted for currency. Investors will also want a first look at fiscal 2027 guidance. A confident outlook could push shares back toward the $386 high.
Agentic commerce is the biggest long term theme. The term describes AI assistants that shop and pay on behalf of users. Visa is collaborating with OpenAI, while Mastercard is rolling out its own agentic payment option. Whoever sets the security rules could capture a large share of that future spending.
Costs are the near term swing factor. Visa booked $563 million in severance charges tied to cutting about 2,600 jobs, roughly 7% of its workforce. Management plans to reinvest those savings in stablecoins and agentic commerce, so margins may not jump right away.
Regulation remains a constant background risk. The UK’s Payment Systems Regulator plans to consult on profitability reporting for Visa and Mastercard. Although not immediately costly, that kind of scrutiny can cap pricing power over time.
Keep tabs on Visa’s earnings revisions and price targets in real time (Free with TIKR) >>>
Should You Invest in Visa?
The only way to really know is to look at the numbers yourself. TIKR gives you free access to the same institutional-quality financial data that professional analysts use to answer exactly that question.
Pull up V, and you’ll see years of historical financials, what Wall Street analysts expect for revenue and earnings in the quarters ahead, how valuation multiples have moved over time, and whether price targets are trending up or down.
You can build a free watchlist to track V alongside every other stock on your radar. No credit card required. Just the data you need to decide for yourself.
Disclaimer:
Please note that the articles on TIKR are not intended to serve as investment or financial advice from TIKR or our content team, nor are they recommendations to buy or sell any stocks. We create our content based on TIKR Terminal’s investment data and analysts’ estimates. Our analysis might not include recent company news or important updates. TIKR has no position in any stocks mentioned. Thank you for reading, and happy investing!