Key Stats for INTC Stock
- Past week performance: -5.4%
- 52-week range: $33 to $142
- Valuation model target price: $141
- Implied upside: 21.6% over 2.3 years
Size up Intel’s turnaround math with 5 years of analyst forecasts in TIKR’s free Valuation Model (It’s free) >>>
Intel Cools Off After a Historic Comeback Run
Intel (INTC) shares fell about 5.4% over the past week, closing near $116 on Monday. Most of the damage came in one session, when the stock dropped 5.7%. No change to guidance or demand triggered the move. Instead, investors appear to be locking in gains after a 246% climb over the past year.
That rally rests on a simple idea: AI needs more than graphics chips. At the AI Infra Summit, CEO Lip-Bu Tan said CPU demand is high because of agentic AI, which is software that plans and acts on its own. CPUs are the general brains of a server, so they coordinate that work. Intel is therefore pitching an open, full system approach rather than one hero chip.
The numbers back up that pitch. Q2 revenue rose 25% to $16.1 billion, while data center revenue jumped 59% to $6.3 billion. On the earnings call, CFO David Zinsner said, “Customers continue to signal a strong and sustainable spending environment.” And Intel has signed 10 multiyear agreements with server customers because supply still trails demand.
Sentiment also got a jolt from the memory world. Solidigm, the storage business Intel sold to SK Hynix in a deal completed in 2021, is reportedly weighing an IPO at up to $150 billion. That figure shows how richly investors value AI data center assets, although Intel captures none of it directly. If INTC stock is going to resume its climb, October earnings must show supply catching up with demand.
Compare Intel’s Q3 guidance with Wall Street’s estimates before October 22 (It’s free) >>>
Intel’s Valuation Already Prices In a Big Recovery
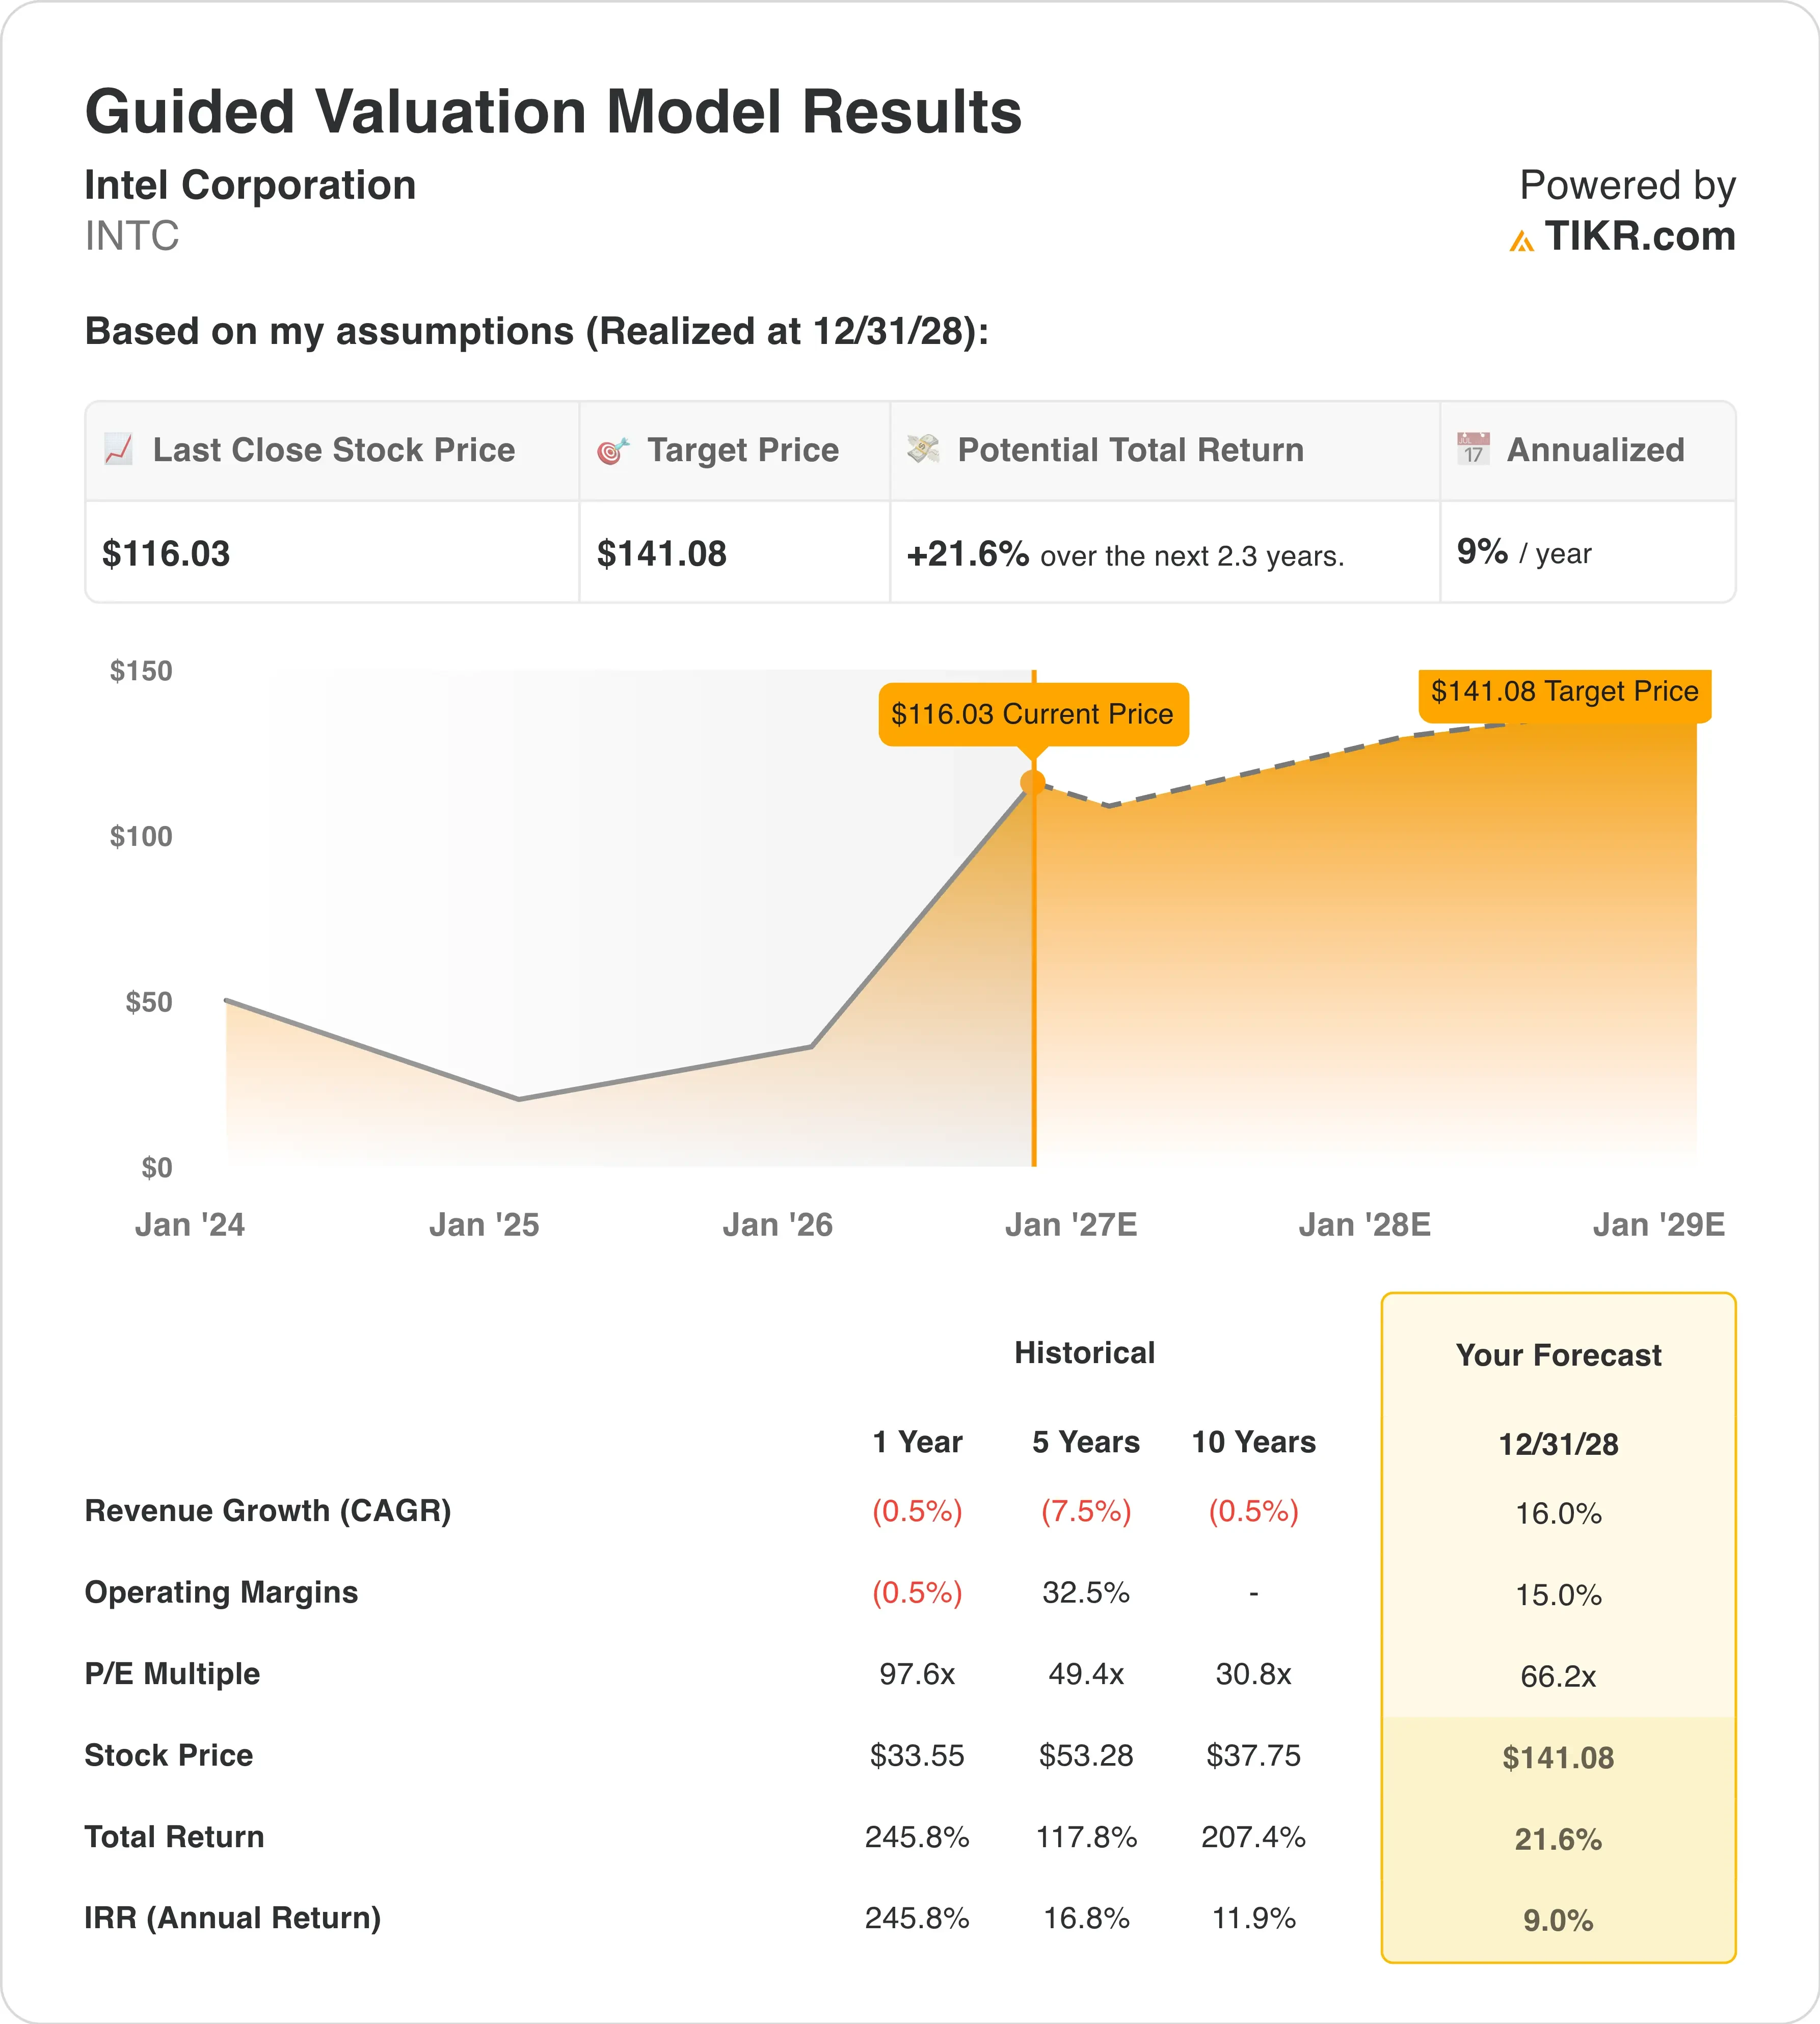
Under valuation model assumptions realized through 12/31/28, the stock is modeled using:
- Revenue Growth (CAGR): 16.0%
- Operating Margins: 15.0%
- Exit P/E Multiple: 66.2x
Based on these inputs, the model estimates a target price of $141, implying a 21.6% total return from the current share price of $116 and a 9.0% annualized return over the next 2.3 years.
A 9.0% annual return is respectable, but it falls just short of the 10% bar for a clearly attractive stock. That modest figure reflects how much good news the market already expects. Intel trades at 68.9x next year’s earnings, and the model’s 66.2x exit multiple assumes investors stay that generous.

Revenue is the swing factor. Sales shrank 7.5% a year over the past five years, so 16.0% growth would mark a sharp reversal. However, analysts already expect 16.7% annual growth over the next two years, since AI servers are pulling CPU demand higher.
Margins tell a similar turnaround story. Intel’s operating margin, the share of sales left after running costs, was negative 0.5% over the past year. Yet it averaged 32.5% over five years, back when Intel led in manufacturing. Reaching 15.0% depends on 18A factories running at higher yields and fuller capacity.
By comparison, AMD (AMD) grew revenue 50% last quarter and recently topped a $1 trillion market value. Intel, worth about $610 billion, is priced like a company catching up rather than one already leading. So the stock looks fairly valued today, with upside tied to steady execution.
Build Intel bull and bear cases in under 60 seconds (Free with TIKR) >>>
AMD Is Setting the Pace, and Intel Is Chasing
Advanced Micro Devices (AMD) is the benchmark investors use to judge Intel’s progress. In Q2, AMD’s revenue rose 50% to $11.5 billion, while its data center segment more than doubled to $6.7 billion. Intel’s data center revenue grew 59% to $6.3 billion in the same period. So Intel is growing fast, yet AMD is still pulling ahead in the most profitable part of the market.
Profitability shows an even wider gap. AMD posted a 54% gross margin in Q2, meaning it kept 54 cents of each sales dollar after production costs. Intel’s Non-GAAP gross margin was 41.8%, because its factories are still absorbing heavy startup costs. And Intel is spending more than $20 billion on capital projects this year, while AMD outsources its manufacturing.
Nvidia (NVDA) sets the tone for the whole sector. This week it announced its biggest share buyback plan ever, even as AI chip competition weighed on its stock. Intel’s angle is different, since it sells CPUs, custom chips, and foundry capacity rather than leading in GPUs. That foundry business, which builds chips for other companies, becomes Intel’s real moat if 18A and 14A deliver.
Examine if 18A execution can turn the 30% pullback into a recovery >>>
What’s Driving INTC Stock Going Forward?
Q3 earnings on October 22 are the next big test. Intel guided for revenue of $15.8 billion to $16.8 billion and adjusted EPS of $0.38. Adjusted EPS strips out one-time items to show underlying profit per share. A result near the top of that range would signal that supply is finally loosening.
Manufacturing milestones come next. Intel expects its 14A 0.9 process design kit in October and version 1.0 in Q1 2027. A design kit is the rulebook outside customers use to build chips on a new process. Therefore, every early or late delivery directly shapes how fast foundry revenue can grow.
Spending is the other lever to watch. Intel raised its 2026 capital spending outlook to more than $20 billion and expects 2027 to be significantly higher. That money buys tools and clean rooms, but it also pressures free cash flow until factories fill up. However, management said 18A yields are trending ahead of targets, which should help margins over time.
PCs remain the soft spot. Intel expects PC consumption to fall by a low double digit percentage in 2026 because rising memory prices are squeezing supply. While data centers carry the growth story, a weak PC market limits how fast total revenue can compound.
Track Intel’s foundry progress and analyst revisions in one dashboard (Free with TIKR) >>>
Should You Invest in Intel?
The only way to really know is to look at the numbers yourself. TIKR gives you free access to the same institutional-quality financial data that professional analysts use to answer exactly that question.
Pull up INTC, and you’ll see years of historical financials, what Wall Street analysts expect for revenue and earnings in the quarters ahead, how valuation multiples have moved over time, and whether price targets are trending up or down.
You can build a free watchlist to track INTC alongside every other stock on your radar. No credit card required. Just the data you need to decide for yourself.
Analyze INTC stock on TIKR Free→
Disclaimer:
Please note that the articles on TIKR are not intended to serve as investment or financial advice from TIKR or our content team, nor are they recommendations to buy or sell any stocks. We create our content based on TIKR Terminal’s investment data and analysts’ estimates. Our analysis might not include recent company news or important updates. TIKR has no position in any stocks mentioned. Thank you for reading, and happy investing!