Key Stats for WMT Stock
- Past week performance: -1.6%
- 52-week range: $99 to $135
- Valuation model target price: $128
- Implied upside: 17.5% over 2.3 years
Weigh Walmart’s premium valuation against 5 years of analyst forecasts with TIKR (It’s free) >>>
Walmart’s Earnings Beat Hasn’t Won Back Investors Yet
Walmart (WMT) shares slipped about 1.6% over the past week, closing near $109 on Monday. The stock now sits roughly 20% below its 52-week high of $135. That gap opened in August, when shares fell 8.9% to $104 on the day Walmart reported Q2 results. Since then, the recovery has been slow and uneven.
The August selloff was not about weak sales. Revenue rose 5.9% to $187.9 billion, adjusted EPS jumped 19.1% to $0.81, and global eCommerce grew 23%. Yet investors questioned the quality of that beat, because tariff refunds flattered profits. These refunds are one-time repayments of import duties collected under emergency trade powers.
Management still sounds confident. On the earnings call, CEO John Furner said, “I’m even more bullish today as we see the pieces increasingly powering each other.” He meant faster businesses like advertising, marketplace, and membership now reinforce the core stores. And Walmart raised its full-year outlook, guiding for adjusted EPS of $2.80 to $2.87.
Recent headlines added texture rather than direction. Walmart is upgrading Scintilla, its supplier data platform, into an AI tool that flags problems like empty shelves. Meanwhile, two senators asked the Federal Trade Commission (FTC) to probe how its Sparky chatbot handles “Made in USA” claims. Going forward, the stock needs proof that profits can keep growing once tariff refunds fade.
Check how Walmart’s Q3 estimates have moved since August on TIKR (It’s free) >>>
Is WMT Stock Undervalued?
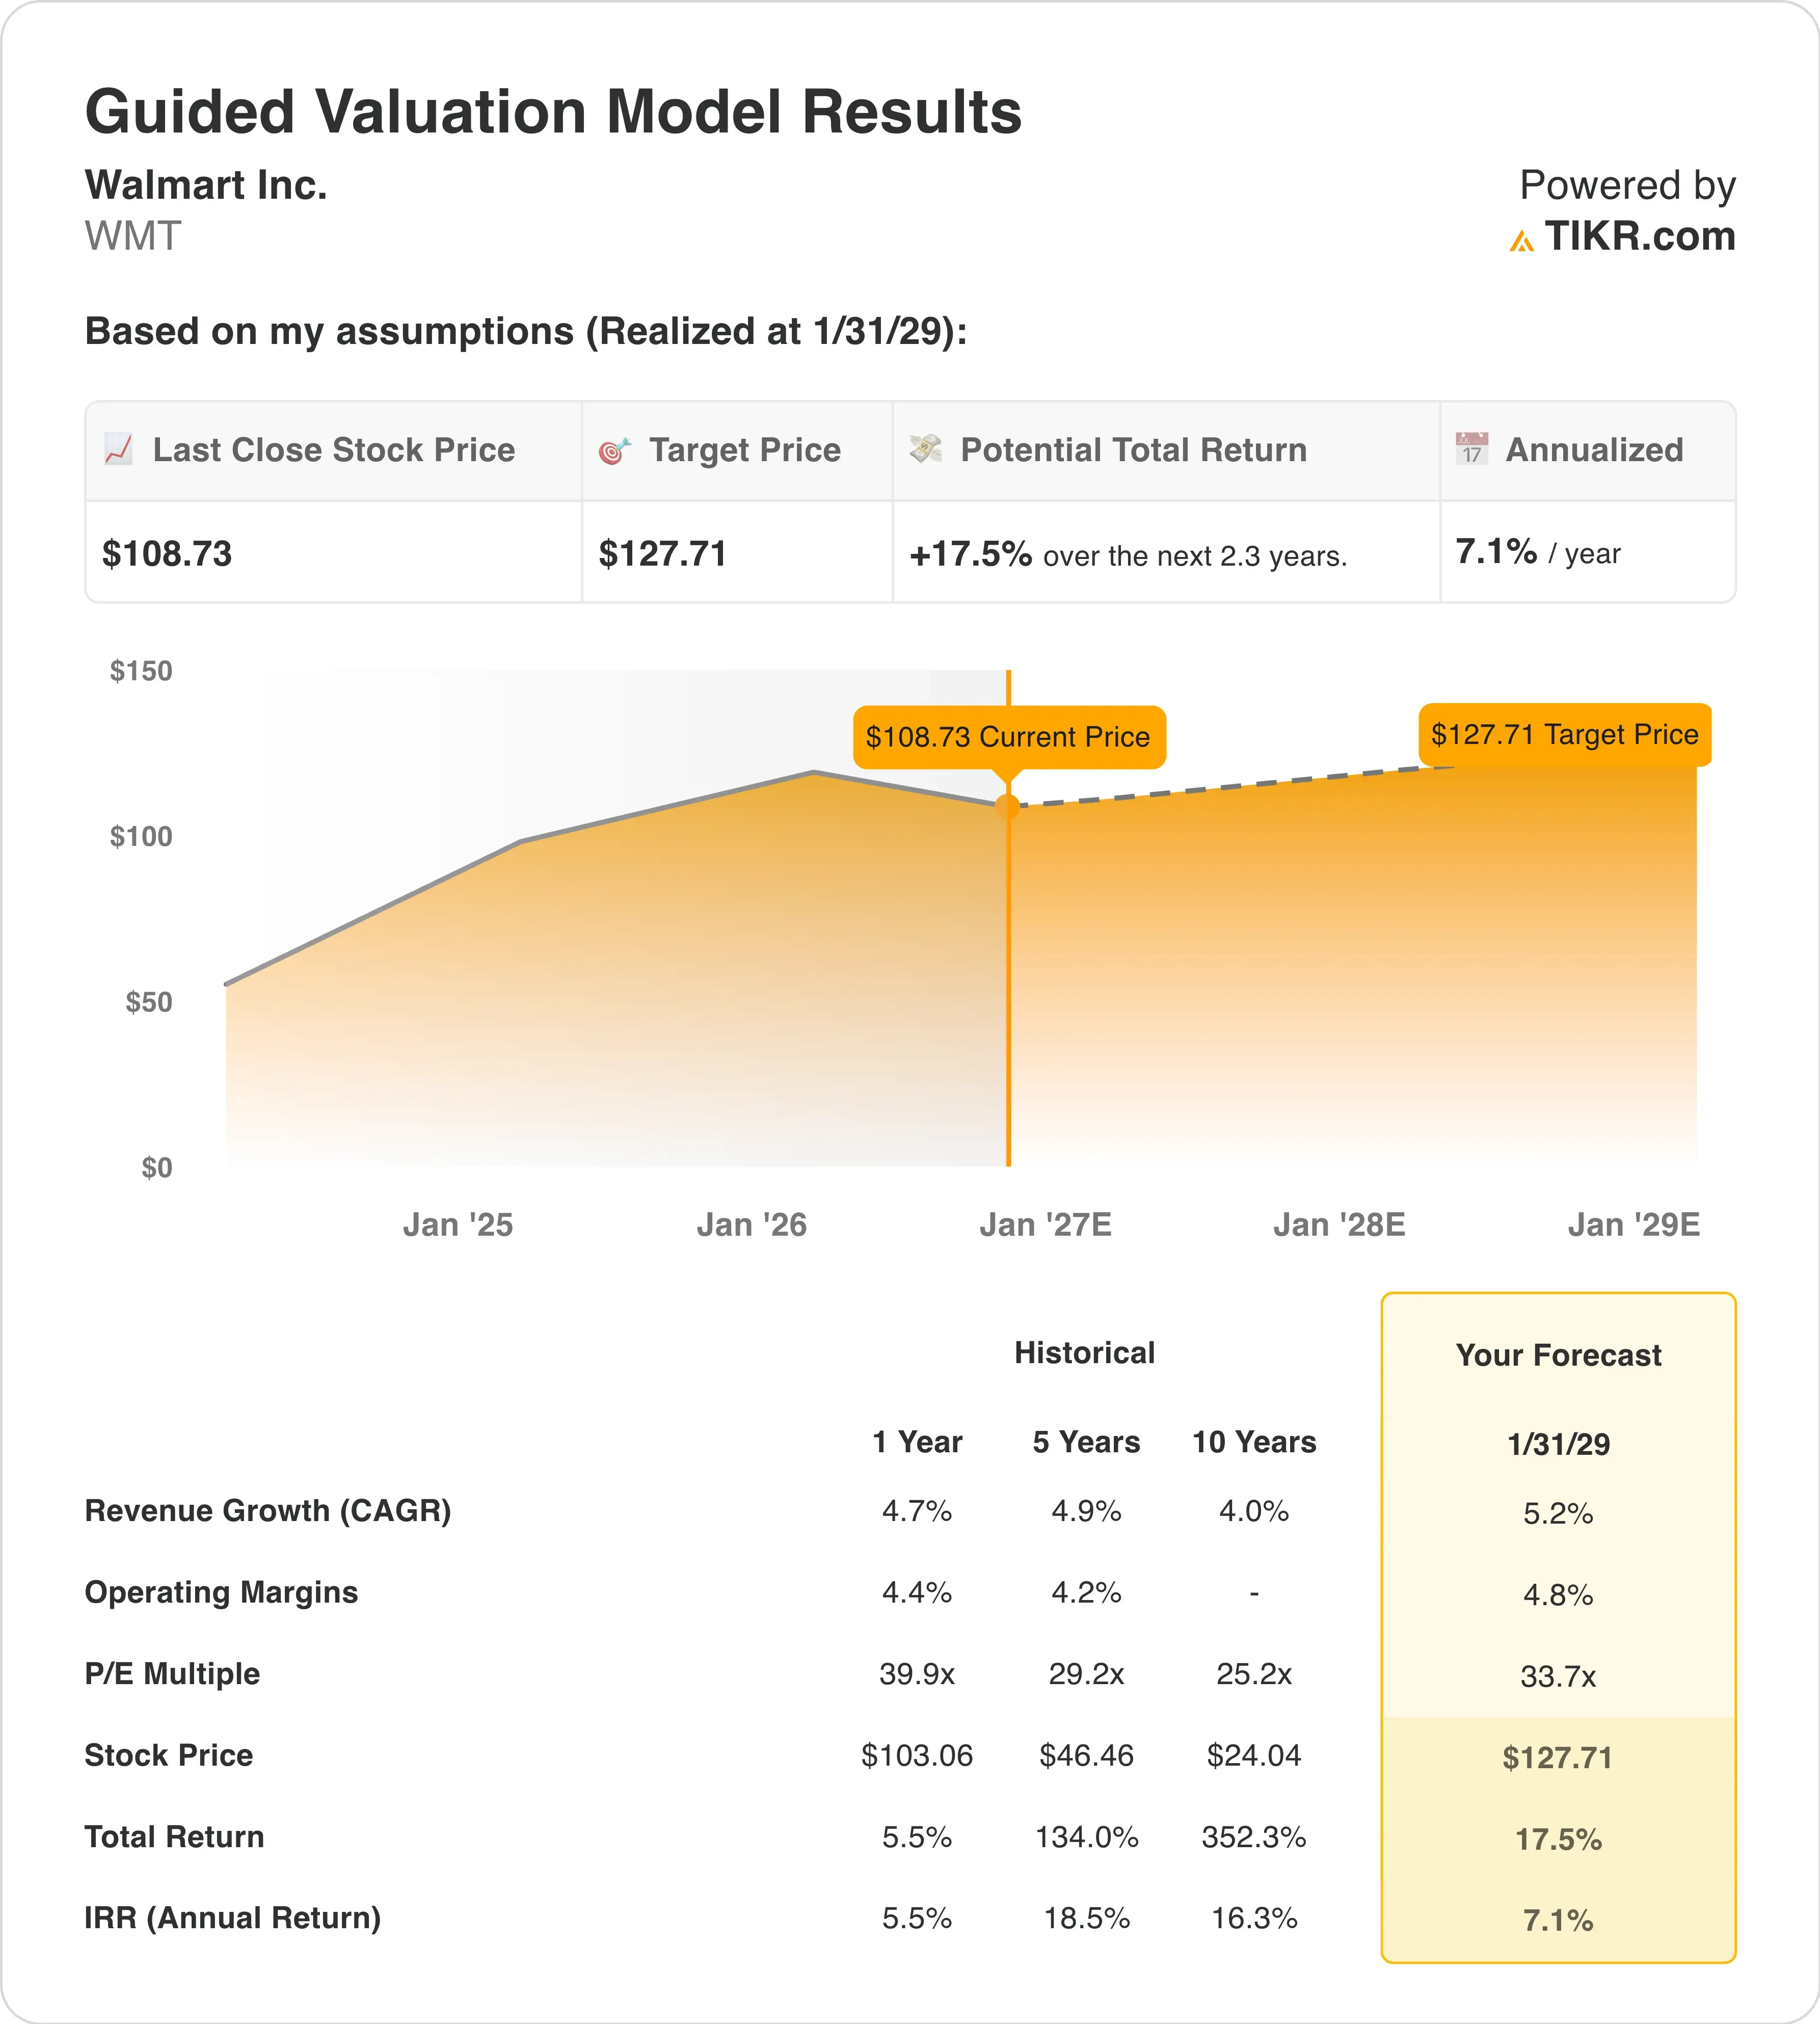
Under valuation model assumptions realized through 1/31/29, the stock is modeled using:
- Revenue Growth (CAGR): 5.2%
- Operating Margins: 4.8%
- Exit P/E Multiple: 33.7x
Based on these inputs, the model estimates a target price of $128, implying a 17.5% total return from the current share price of $109 and a 7.1% annualized return over the next 2.3 years.
A 7.1% annual return falls below the 10% bar, so Walmart looks fully valued at today’s price. The problem is not the business but the entry multiple. Walmart trades at 36.3x next year’s earnings, compared with a 10-year average P/E of 25.2x.
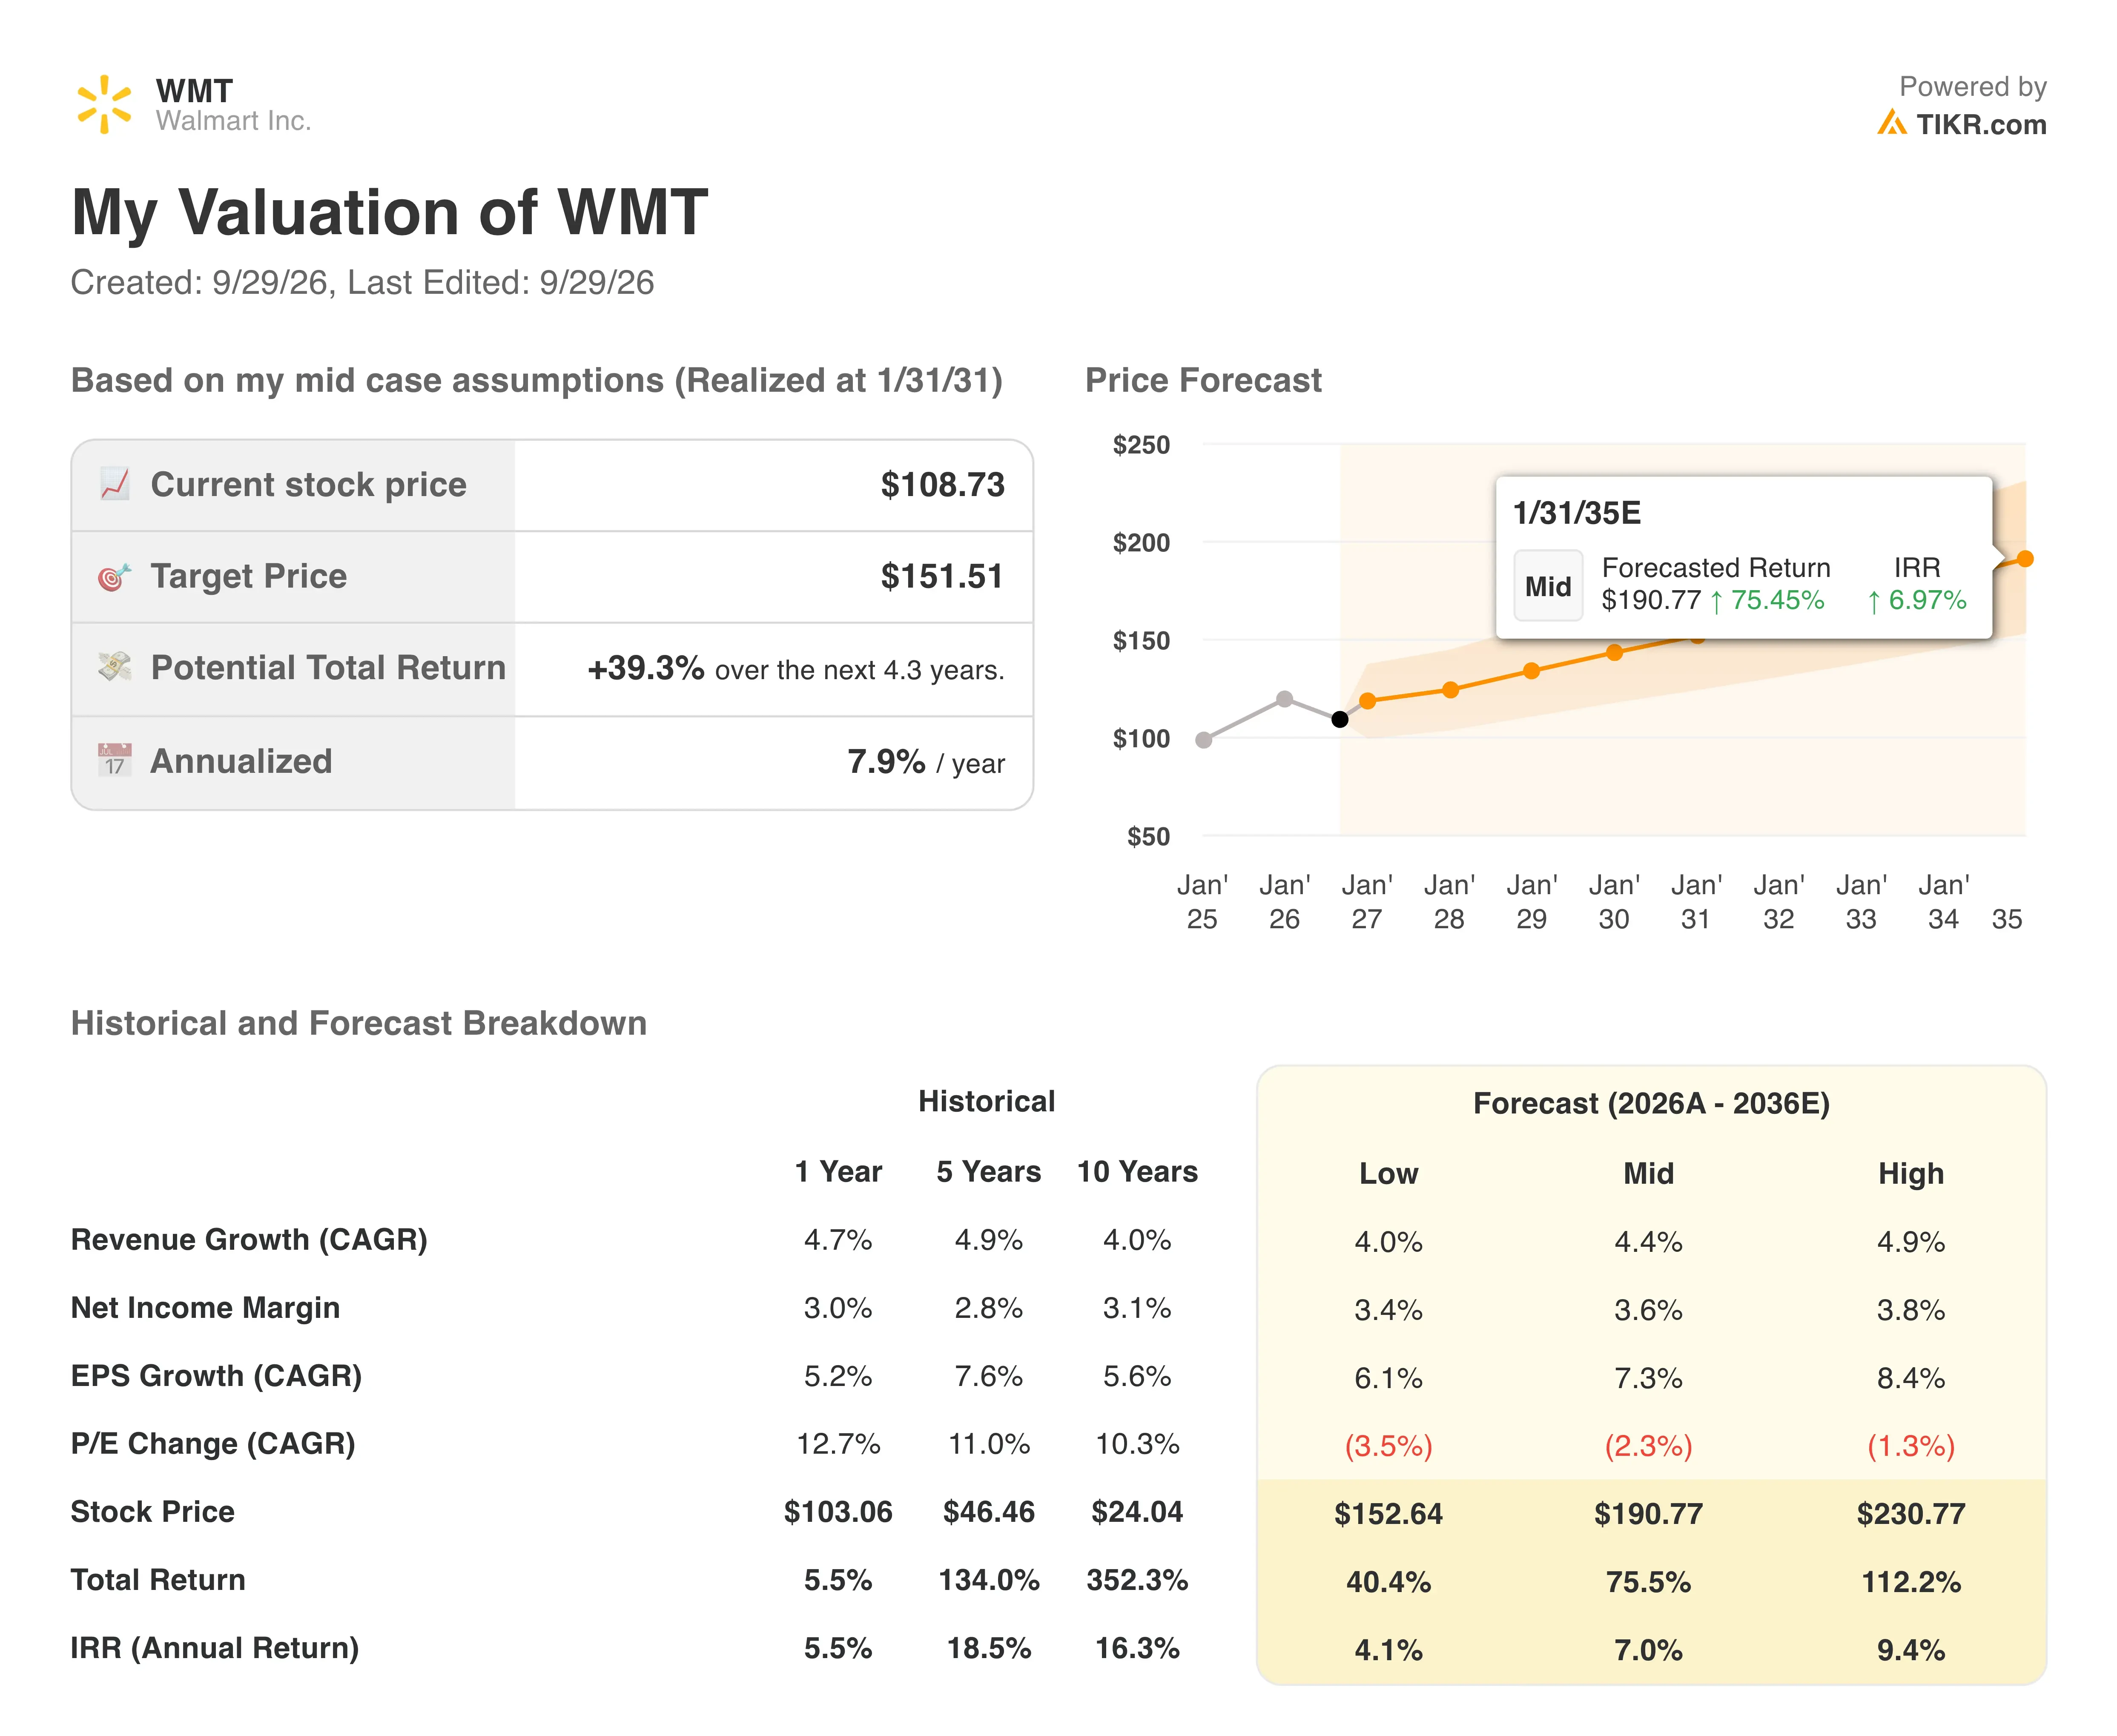
The model assumes that premium shrinks to 33.7x by early 2029. That still sits well above the five-year average of 29.2x, because investors now reward Walmart’s advertising and membership income. Those streams earn far higher margins than groceries, so they justify some premium.
Revenue growth of 5.2% a year is close to Walmart’s five-year record of 4.9%. Meanwhile, the operating margin rises to 4.8% from 4.4% over the past year. That improvement depends on eCommerce becoming more profitable as delivery routes get denser.
By comparison, Costco (COST) trades at 40.5x forward earnings, while Target (TGT) grew comparable sales 3.8% last quarter. Walmart sits between them on price, yet its U.S. growth looks closer to Target’s. So the stock needs margin expansion, not just steady sales, to earn a double digit return.
Estimate a company’s fair value instantly (Free with TIKR) >>>
Costco and Target Are Setting a Higher Bar
Costco is the rival that shares Walmart’s premium valuation. Its forward P/E of 40.5x tops Walmart’s 36.3x, but analysts also expect faster growth. Costco’s revenue is projected to grow 7.9% a year over the next two years, versus 5.5% for Walmart. And Costco’s adjusted comparable sales rose 6.7% in its latest quarter, excluding gas and currency effects.
Target is staging a comeback. Its Q2 comparable sales rose 3.8%, beating Walmart U.S. growth of 2.6%, while store traffic increased 3.6%. Target also expects its operating margin to reach about 5.1% this year, excluding refunds. That compares with Walmart’s 3.9% operating margin over the past twelve months.
Amazon (AMZN) adds pressure on labor costs and speed. It raised minimum hourly pay for U.S. operations workers by $1 to $20 this month. That forces rivals, including Walmart, to balance wage costs against service levels. Still, Walmart’s moat remains its scale, since thousands of stores double as delivery hubs for its fast growing online business.
Decode whether Walmart’s e-commerce and advertising growth can offset slowing comparable sales >>>
What’s Driving WMT Stock Going Forward?
Q3 earnings on November 19 are the next checkpoint. Walmart guided for sales growth of 3.0% to 3.75% and adjusted operating income growth of 2.0% to 4.0%. That slower profit pace reflects tariff refunds being reinvested into lower prices. A timing shift in Flipkart’s Big Billion Days sale, India’s biggest shopping event, also trims more than 1 point from sales growth.
Holiday demand looks supportive. Adobe forecasts U.S. online holiday sales will grow 6.7% as discounts attract shoppers. Because Walmart’s eCommerce grows far faster than its stores, a strong digital season could lift both sales and margins.
Healthcare is a newer growth avenue. Walmart and SCAN Health Plan plan a jointly branded Medicare Advantage product in two states, with enrollment expected to start October 15. Medicare Advantage is private insurance that seniors can choose instead of traditional Medicare. Although small today, it deepens Walmart’s reach into higher value services.
Cost headwinds remain a risk. Walmart expects just over $2 billion in extra fuel costs this year. So investors will watch whether advertising and membership growth can offset that pressure.
Follow Walmart’s holiday quarter estimates as they update (Free with TIKR) >>>
Should You Invest in Walmart?
The only way to really know is to look at the numbers yourself. TIKR gives you free access to the same institutional-quality financial data that professional analysts use to answer exactly that question.
Pull up WMT, and you’ll see years of historical financials, what Wall Street analysts expect for revenue and earnings in the quarters ahead, how valuation multiples have moved over time, and whether price targets are trending up or down.
You can build a free watchlist to track WMT alongside every other stock on your radar. No credit card required. Just the data you need to decide for yourself.
Analyze WMT stock on TIKR Free→
Disclaimer:
Please note that the articles on TIKR are not intended to serve as investment or financial advice from TIKR or our content team, nor are they recommendations to buy or sell any stocks. We create our content based on TIKR Terminal’s investment data and analysts’ estimates. Our analysis might not include recent company news or important updates. TIKR has no position in any stocks mentioned. Thank you for reading, and happy investing!