
Key Stats for COST Stock
- Past week performance: +2.0%
- 52-week range: $844 to $1,097
- Valuation model target price: $1,210
- Implied upside: 31.1% over 2.9 years
Measure Costco’s premium against 5 years of analyst forecasts in TIKR’s Valuation Model (It’s free) >>>
Record Sales, Quiet Stock: Inside Costco’s Q4
Costco Wholesale (COST) shares rose about 2.0% over the past week, closing near $923 on Monday. The gain followed fiscal Q4 results on September 24 that beat Wall Street estimates. Still, the stock trades roughly 16% below its 52-week high of $1,097, and it is essentially flat over the past year.
The quarter itself was strong. Net sales rose 11.2% to $93.9 billion, while EPS reached $6.75, up from $5.87 a year earlier. That figure included a $0.15 per share one-time benefit from IEEPA tariff refunds. IEEPA refers to emergency powers used to impose tariffs that importers later got back. Excluding it, EPS still grew 12.4%.
Membership, the core of Costco’s profit engine, kept growing. Paid members rose 3.8% to 84.1 million, and higher tier Executive members climbed 9.4% to 42.3 million. Rather than pocket its refund cash, Costco is recycling most of it into lower prices. On the earnings call, CFO Gary Millerchip said, “Our goal is to be the first to lower prices where we see opportunities to do so.”
So why the muted reaction? Several brokerages trimmed price targets after the report, since the stock already trades at a steep premium. Investors also noticed that 9.4% comparable sales growth was boosted by gas prices and currency, with the adjusted figure at 6.7%. Going forward, Costco needs to show it can grow members faster than its valuation cools.
Break down Costco’s fiscal 2027 estimates line by line on TIKR (It’s free) >>>
Costco’s Premium Multiple Is Doing the Heavy Lifting
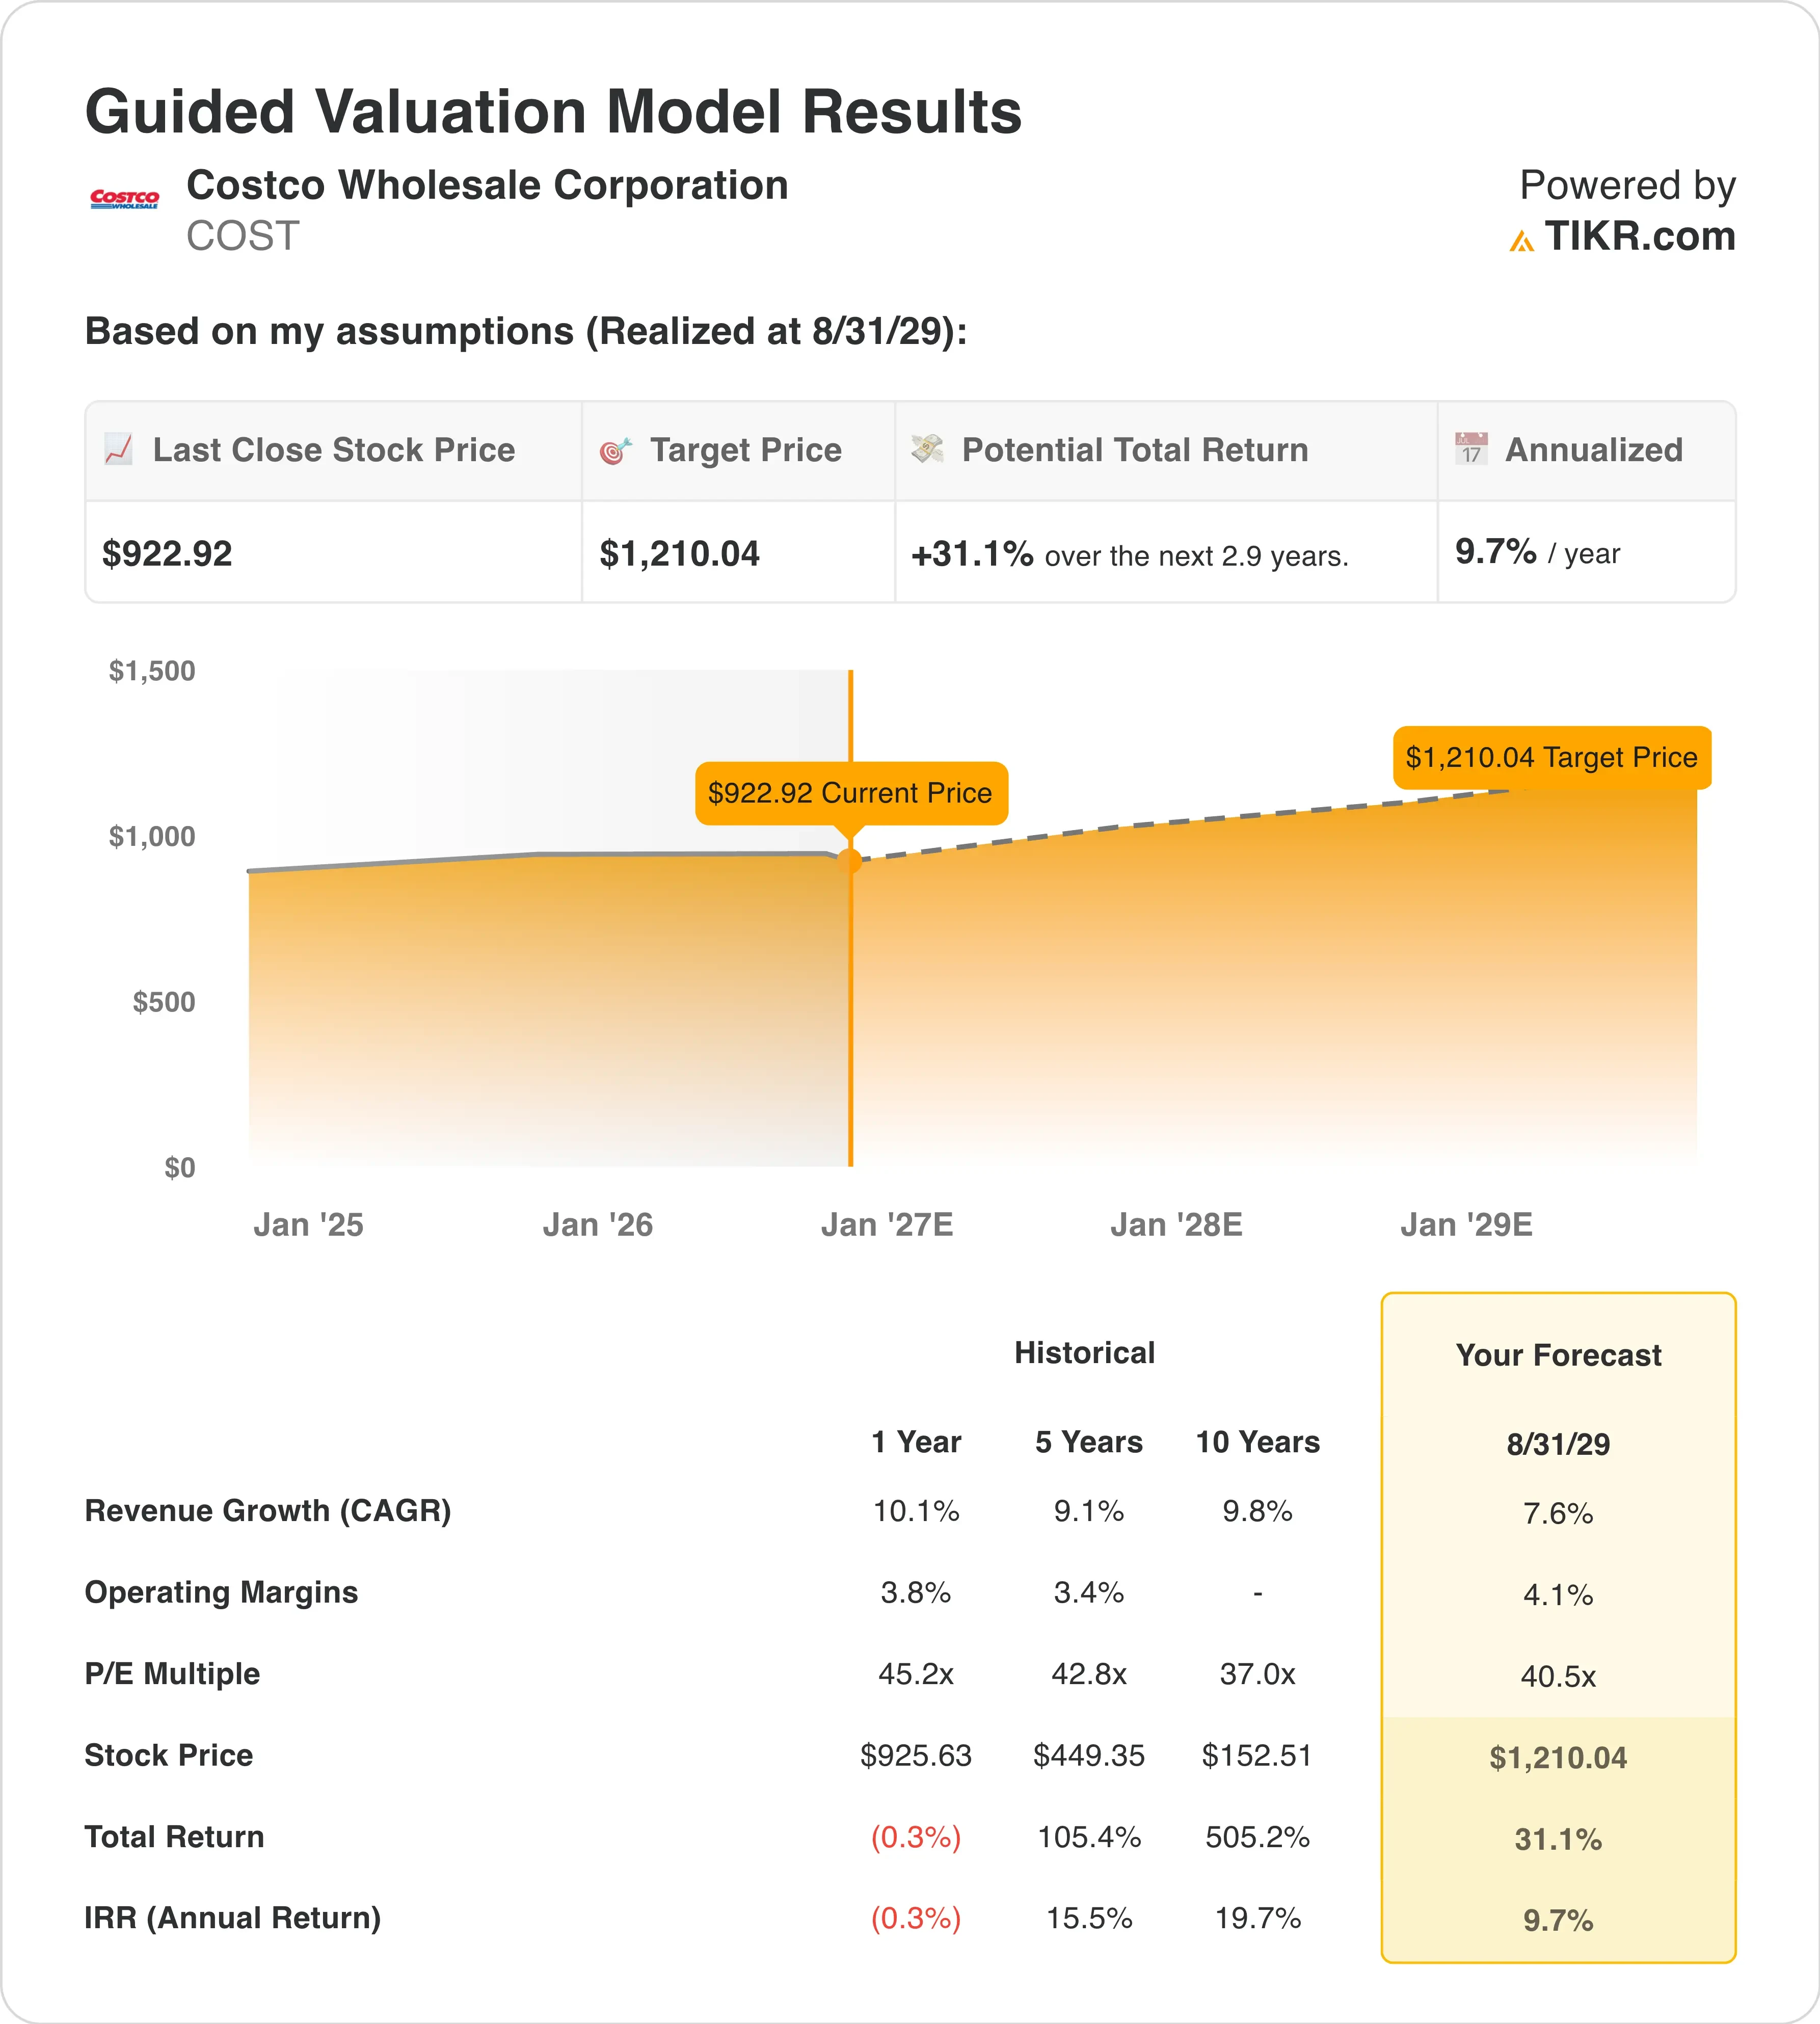
Under valuation model assumptions realized through 8/31/29, the stock is modeled using:
Based on these inputs, the model estimates a target price of $1,210, implying a 31.1% total return from the current share price of $923 and a 9.7% annualized return over the next 2.9 years.
A 9.7% annual return is decent, but it sits just below the 10% threshold for a clearly attractive stock. That tells you Costco looks roughly fairly valued. Investors are paying 40.5x next year’s earnings for a retailer with a 3.9% operating margin.
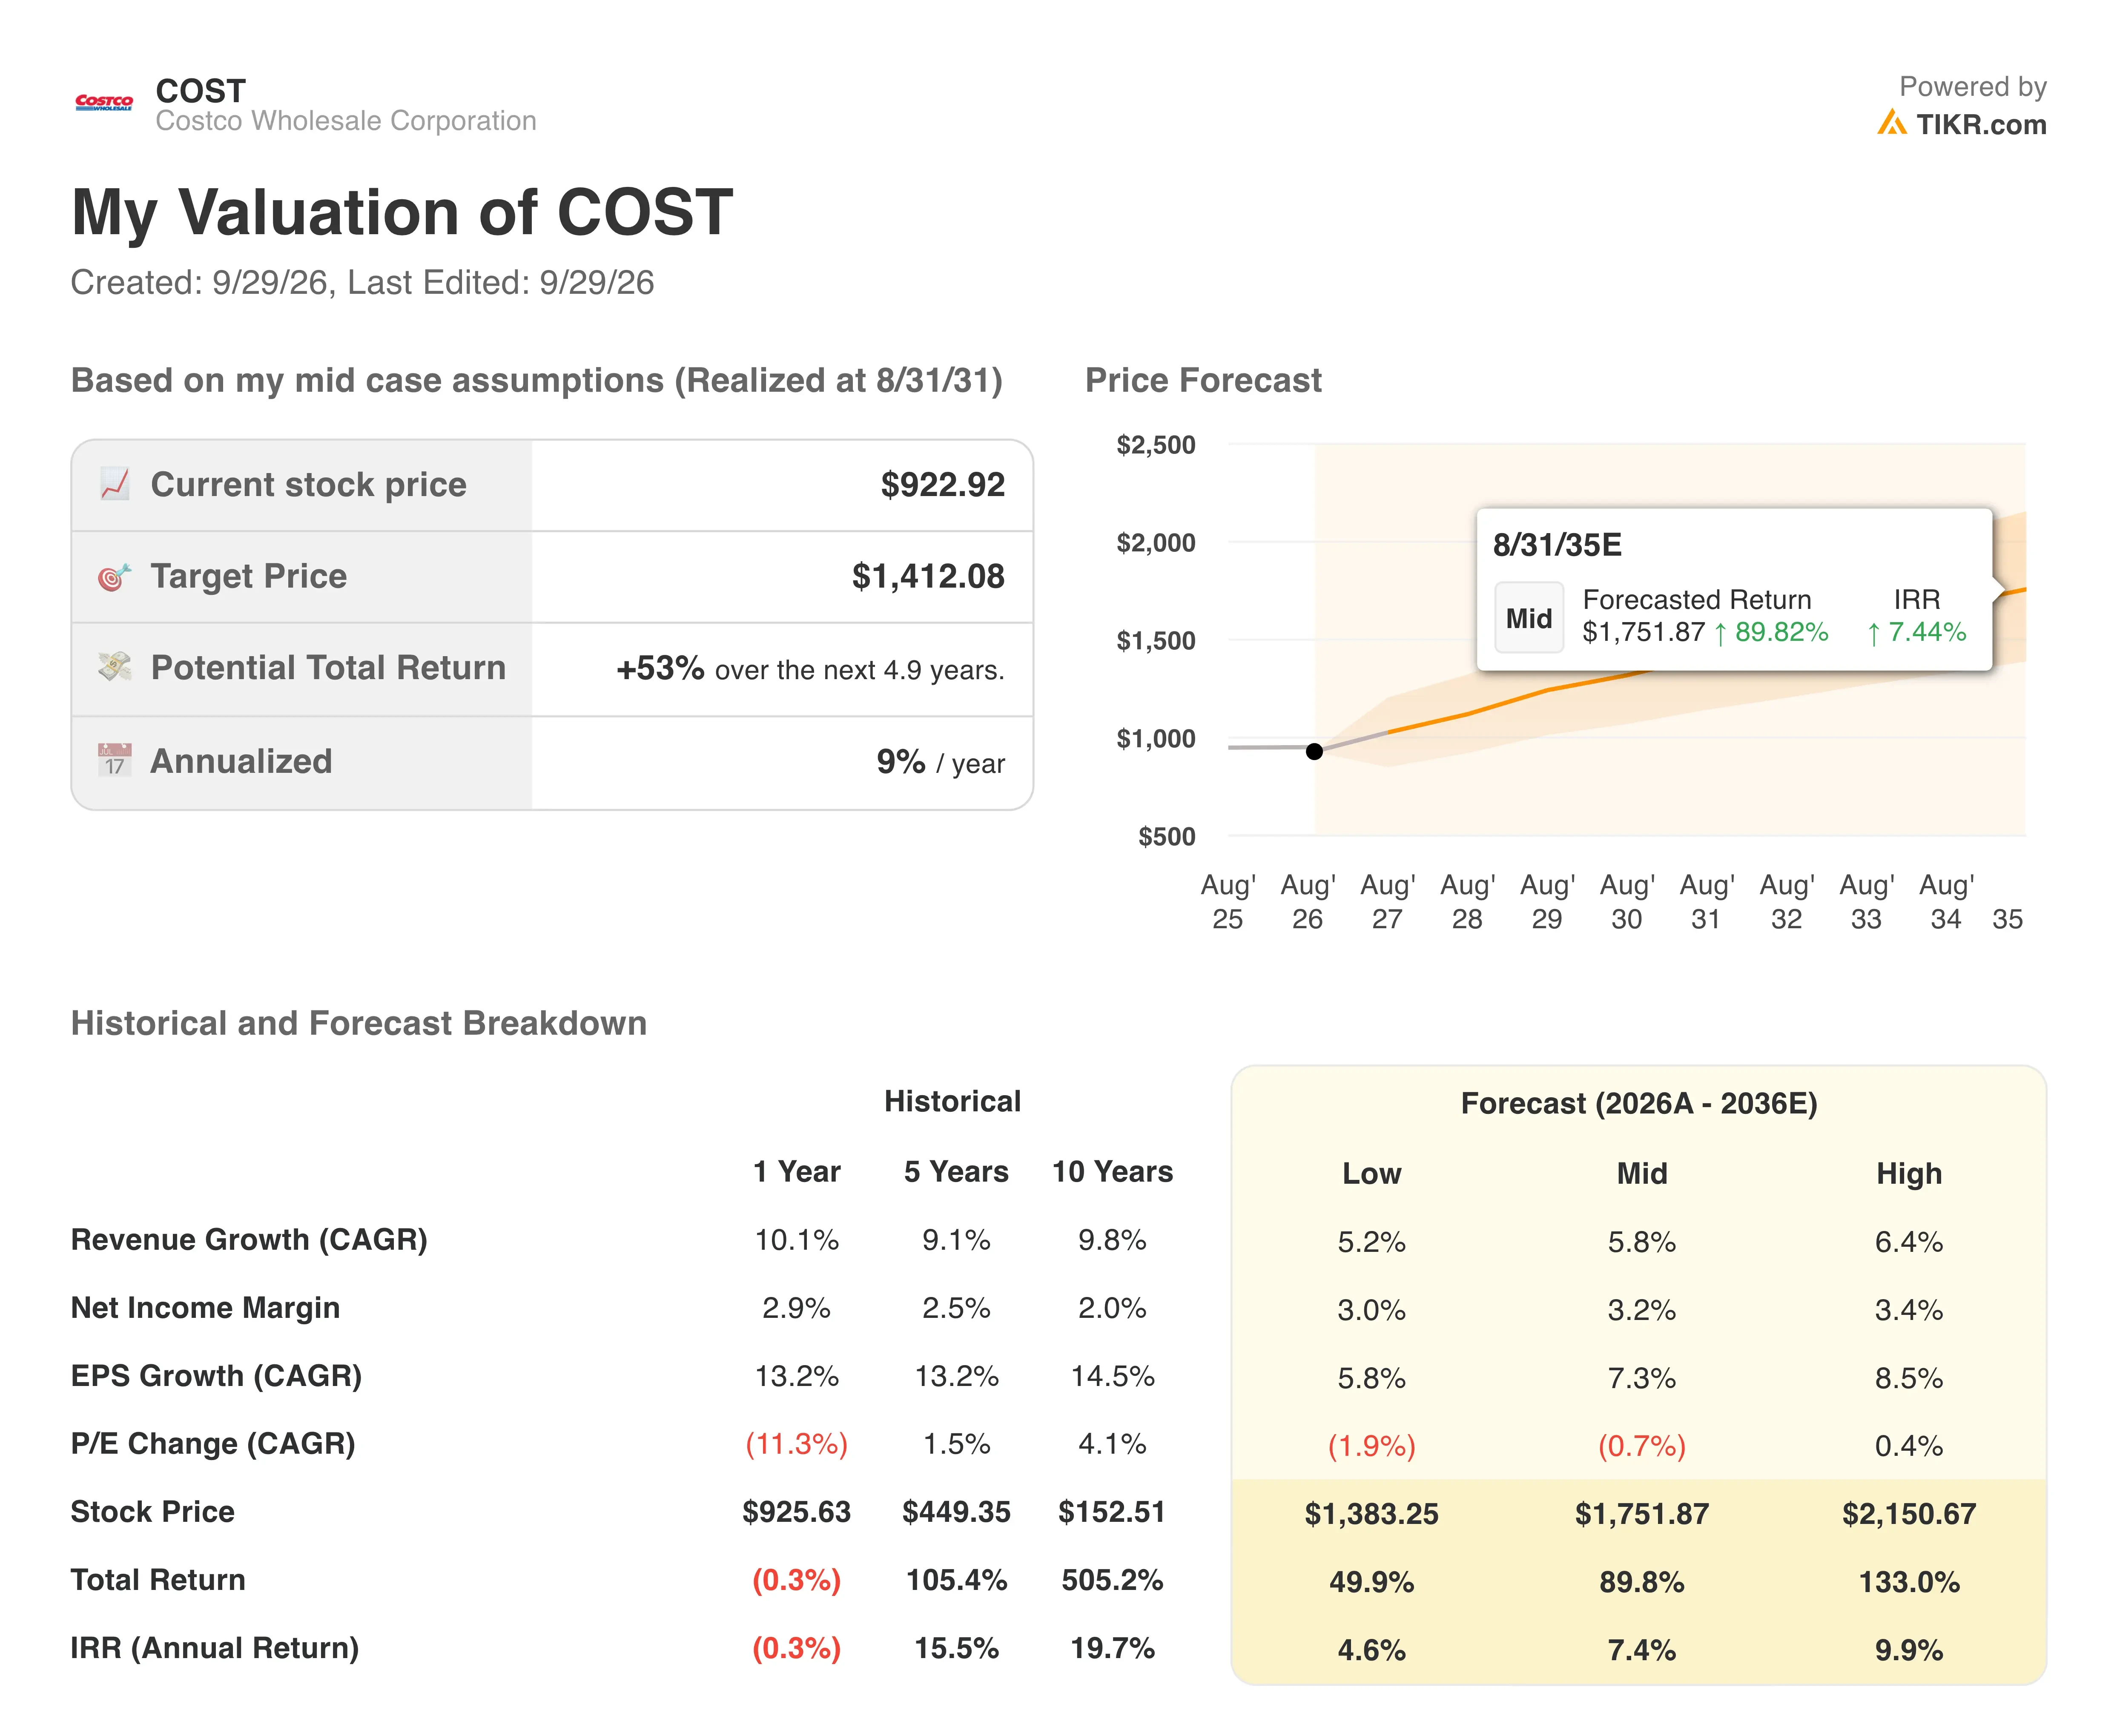
The model keeps that multiple close to today’s level. An exit P/E of 40.5x sits below the 45.2x of the past year, but above the 10-year average of 37.0x. So the forecast assumes investors keep paying up for Costco’s consistency without expanding the premium.
Growth assumptions look conservative. Revenue has compounded 9.1% a year over five years, while the model uses 7.6%, close to analysts’ forward estimate of 7.9%. Margins rise only slightly to 4.1%, because Costco deliberately passes savings back to members.
Balance sheet strength adds a cushion. Costco holds about $12.7 billion more cash than debt, which helps fund 33 openings planned for fiscal 2027. By comparison, Walmart (WMT) trades at 36.3x forward earnings with slower expected growth, so Costco’s premium reflects its faster unit expansion.
Test how a lower exit multiple changes Costco’s return in seconds (Free with TIKR) >>>
Walmart and Target Are Fighting for the Same Value Shopper
Walmart is Costco’s closest rival, especially through Sam’s Club. Walmart U.S. comparable sales rose 2.6% in its latest quarter, well below Costco’s adjusted 6.7%. However, Walmart’s global eCommerce grew 23%, slightly ahead of Costco’s 19.5% digital sales growth. So Walmart is gaining on delivery reach, while Costco still leads on comparable sales.
Valuation separates the two more sharply. Costco trades at 40.5x forward earnings, compared with 36.3x for Walmart. Analysts expect Costco’s revenue to grow 7.9% a year over the next two years, versus 5.5% for Walmart. That faster growth explains part of the premium, but not all of it.
Target (TGT) is the recovering challenger. Its Q2 comparable sales rose 3.8%, and it has cut prices on more than 10,000 items over the past year. Target also benefited from tariff refunds, which added $1.65 to its quarterly EPS. Yet Costco’s membership model gives it a steadier profit base, since fees arrive regardless of how much members spend.
Spotlight membership growth and digital sales as the next catalysts >>>
What’s Driving COST Stock Going Forward?
Warehouse growth is the clearest long term driver. Costco plans 33 openings in fiscal 2027, including 5 relocations, as it works toward 30 net new warehouses a year. Capital spending should rise to about $7.5 billion from $6.4 billion to support that expansion. More warehouses mean more members paying annual fees.
Tariff refunds will keep shaping near term results. Costco received $184 million in Q4, a little more than a third of its expected refunds. Management said it already received a similar amount in fiscal Q1 2027, and it plans to reinvest most of it into member value. So reported margins may look lumpy even while underlying growth stays steady.
Convenience is another lever. Costco expanded Uber Eats delivery to 47 states from 17, bringing nearly 600 warehouses into on demand service. Because delivery customers skew younger, this could help Costco recruit its next generation of members.
Monthly sales reports offer frequent checkpoints. September sales arrive October 7, followed by Q1 fiscal 2027 earnings on December 10.
Watch Costco’s monthly sales trends alongside analyst targets (Free with TIKR) >>>
Should You Invest in Costco Wholesale?
The only way to really know is to look at the numbers yourself. TIKR gives you free access to the same institutional-quality financial data that professional analysts use to answer exactly that question.
Pull up COST, and you’ll see years of historical financials, what Wall Street analysts expect for revenue and earnings in the quarters ahead, how valuation multiples have moved over time, and whether price targets are trending up or down.
You can build a free watchlist to track COST alongside every other stock on your radar. No credit card required. Just the data you need to decide for yourself.
Analyze COST stock on TIKR Free→
Disclaimer:
Please note that the articles on TIKR are not intended to serve as investment or financial advice from TIKR or our content team, nor are they recommendations to buy or sell any stocks. We create our content based on TIKR Terminal’s investment data and analysts’ estimates. Our analysis might not include recent company news or important updates. TIKR has no position in any stocks mentioned. Thank you for reading, and happy investing!