Key Stats for TXN Stock
- Past week’s performance: +18.6%
- 52-week range: $153 to $288
- Valuation model target price: $324
- Implied upside: 16.9% over 2.7 years
Value your favorite stocks like TXN with 5 years of analysts’ forecasts using TIKR’s new Valuation Model (It’s free) >>>
What Happened?
Texas Instruments (TXN) stock surged this week after the company reported stronger-than-expected first-quarter results and issued upbeat second-quarter guidance. Investors viewed the report as a sign that demand is improving across several semiconductor markets. Shares closed near $277 on April 24 after the post-earnings rally.
The company reported Q1 revenue of $4.83 billion, up 19% year over year, while earnings per share came in at $1.68. Both figures topped Wall Street expectations. Management said growth was led by industrial markets and data center demand, which matters because those are high-volume end markets for analog chips.
Texas Instruments also guided Q2 revenue to $5.0 billion to $5.4 billion and EPS to $1.77 to $2.05. That was above analyst estimates, so investors quickly reset expectations higher. CEO Haviv Ilan said data center revenue grew about 90% year over year, showing that AI infrastructure spending is now benefiting TI as well.
The rally also came during a broader semiconductor surge. Chip stocks moved higher after strong signals from Intel and continued enthusiasm around AI-related infrastructure spending. That broader sector momentum likely added to TXN’s gains this week.
See analysts’ growth forecasts and price targets for TXN (It’s free) >>>
Is TXN Stock Undervalued?
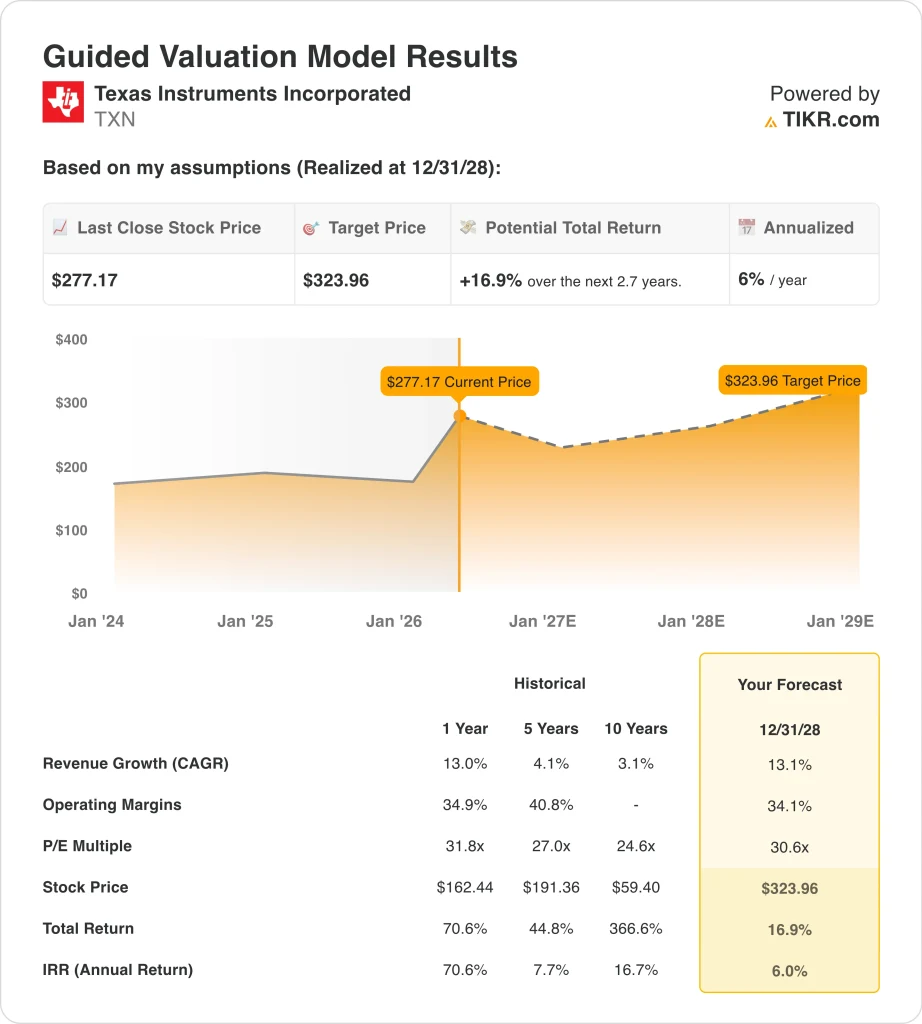
Under valuation model assumptions realized through 12/31/28, the stock is modeled using:
- Revenue growth (CAGR): 13.1%
- Operating Margins: 34.1%
- Exit P/E Multiple: 30.6x
Based on these inputs, the model estimates a target price of $324, implying 16.9% total upside from the current share price and a 6.0% annualized return over the next 2.7 years.
At about $277 per share, TXN trades near 47.4x trailing earnings and about 34.0x next-twelve-month earnings. That is above many historical semiconductor averages, but investors often pay premiums for TI because of its durable margins, broad customer base, and strong free cash flow profile.

The business has already begun recovering from a cyclical downturn. Revenue rose 13.0% in 2025 after falling in 2023 and 2024, while LTM operating margin improved to 35.9%. That suggests the earnings trough may be passing, which can justify a richer valuation.
Still, the model’s 6.0% annualized return implies shares are no longer deeply discounted after this week’s rally. Investors appear to be pricing in a meaningful recovery already. Future upside may depend more on execution than multiple expansion.
Texas Instruments also returns substantial cash to shareholders. The dividend yield is about 2.1%, but the payout ratio is near 94.1% means future dividend growth may depend on faster earnings growth.
What’s Driving TXN Stock Going Forward?
The next major catalyst is whether second-quarter results confirm a broader recovery in analog chips. If revenue lands near the high end of the $5.0 billion to $5.4 billion range, investors may gain confidence that demand is strengthening beyond a one-quarter bounce. That would be important because analog cycles often last several quarters.
Data centers are another key driver. Texas Instruments does not sell the most expensive AI processors, but it supplies power management and signal chips used throughout servers and infrastructure. If AI data center spending stays strong, TI can benefit without competing directly in GPUs.
Industrial and automotive markets also matter. These segments have faced inventory corrections, but management noted improving trends. If customers resume normal ordering patterns, TXN could see broader-based growth rather than relying only on AI-linked demand.
Finally, investors will watch cash generation and capital spending. Texas Instruments has invested heavily in manufacturing capacity, with $4.1 billion in capital expenditures over the last 12 months. If that spending starts to produce stronger margins and higher free cash flow, the market could reward the shares further.
Estimate a company’s fair value instantly (Free with TIKR) >>>
Should You Invest in Texas Instruments Incorporated?
The only way to really know is to look at the numbers yourself. TIKR gives you free access to the same institutional-quality financial data that professional analysts use to answer exactly that question.
Pull up TXN, and you’ll see years of historical financials, what Wall Street analysts expect for revenue and earnings in the quarters ahead, how valuation multiples have moved over time, and whether price targets are trending up or down.
You can build a free watchlist to track TXN alongside every other stock on your radar. No credit card required. Just the data you need to decide for yourself.
Analyze Texas Instruments stock on TIKR Free→
Looking for New Opportunities?
- See what stocks billionaire investors are buying so you can follow the smart money.
- Analyze stocks in as little as 5 minutes with TIKR’s all-in-one, easy-to-use platform.
- The more rocks you overturn… the more opportunities you’ll uncover. Search 100K+ global stocks, global top investor holdings, and more with TIKR.
Disclaimer:
Please note that the articles on TIKR are not intended to serve as investment or financial advice from TIKR or our content team, nor are they recommendations to buy or sell any stocks. We create our content based on TIKR Terminal’s investment data and analysts’ estimates. Our analysis might not include recent company news or important updates. TIKR has no position in any stocks mentioned. Thank you for reading, and happy investing!