Key Stats for Texas Instruments Stock
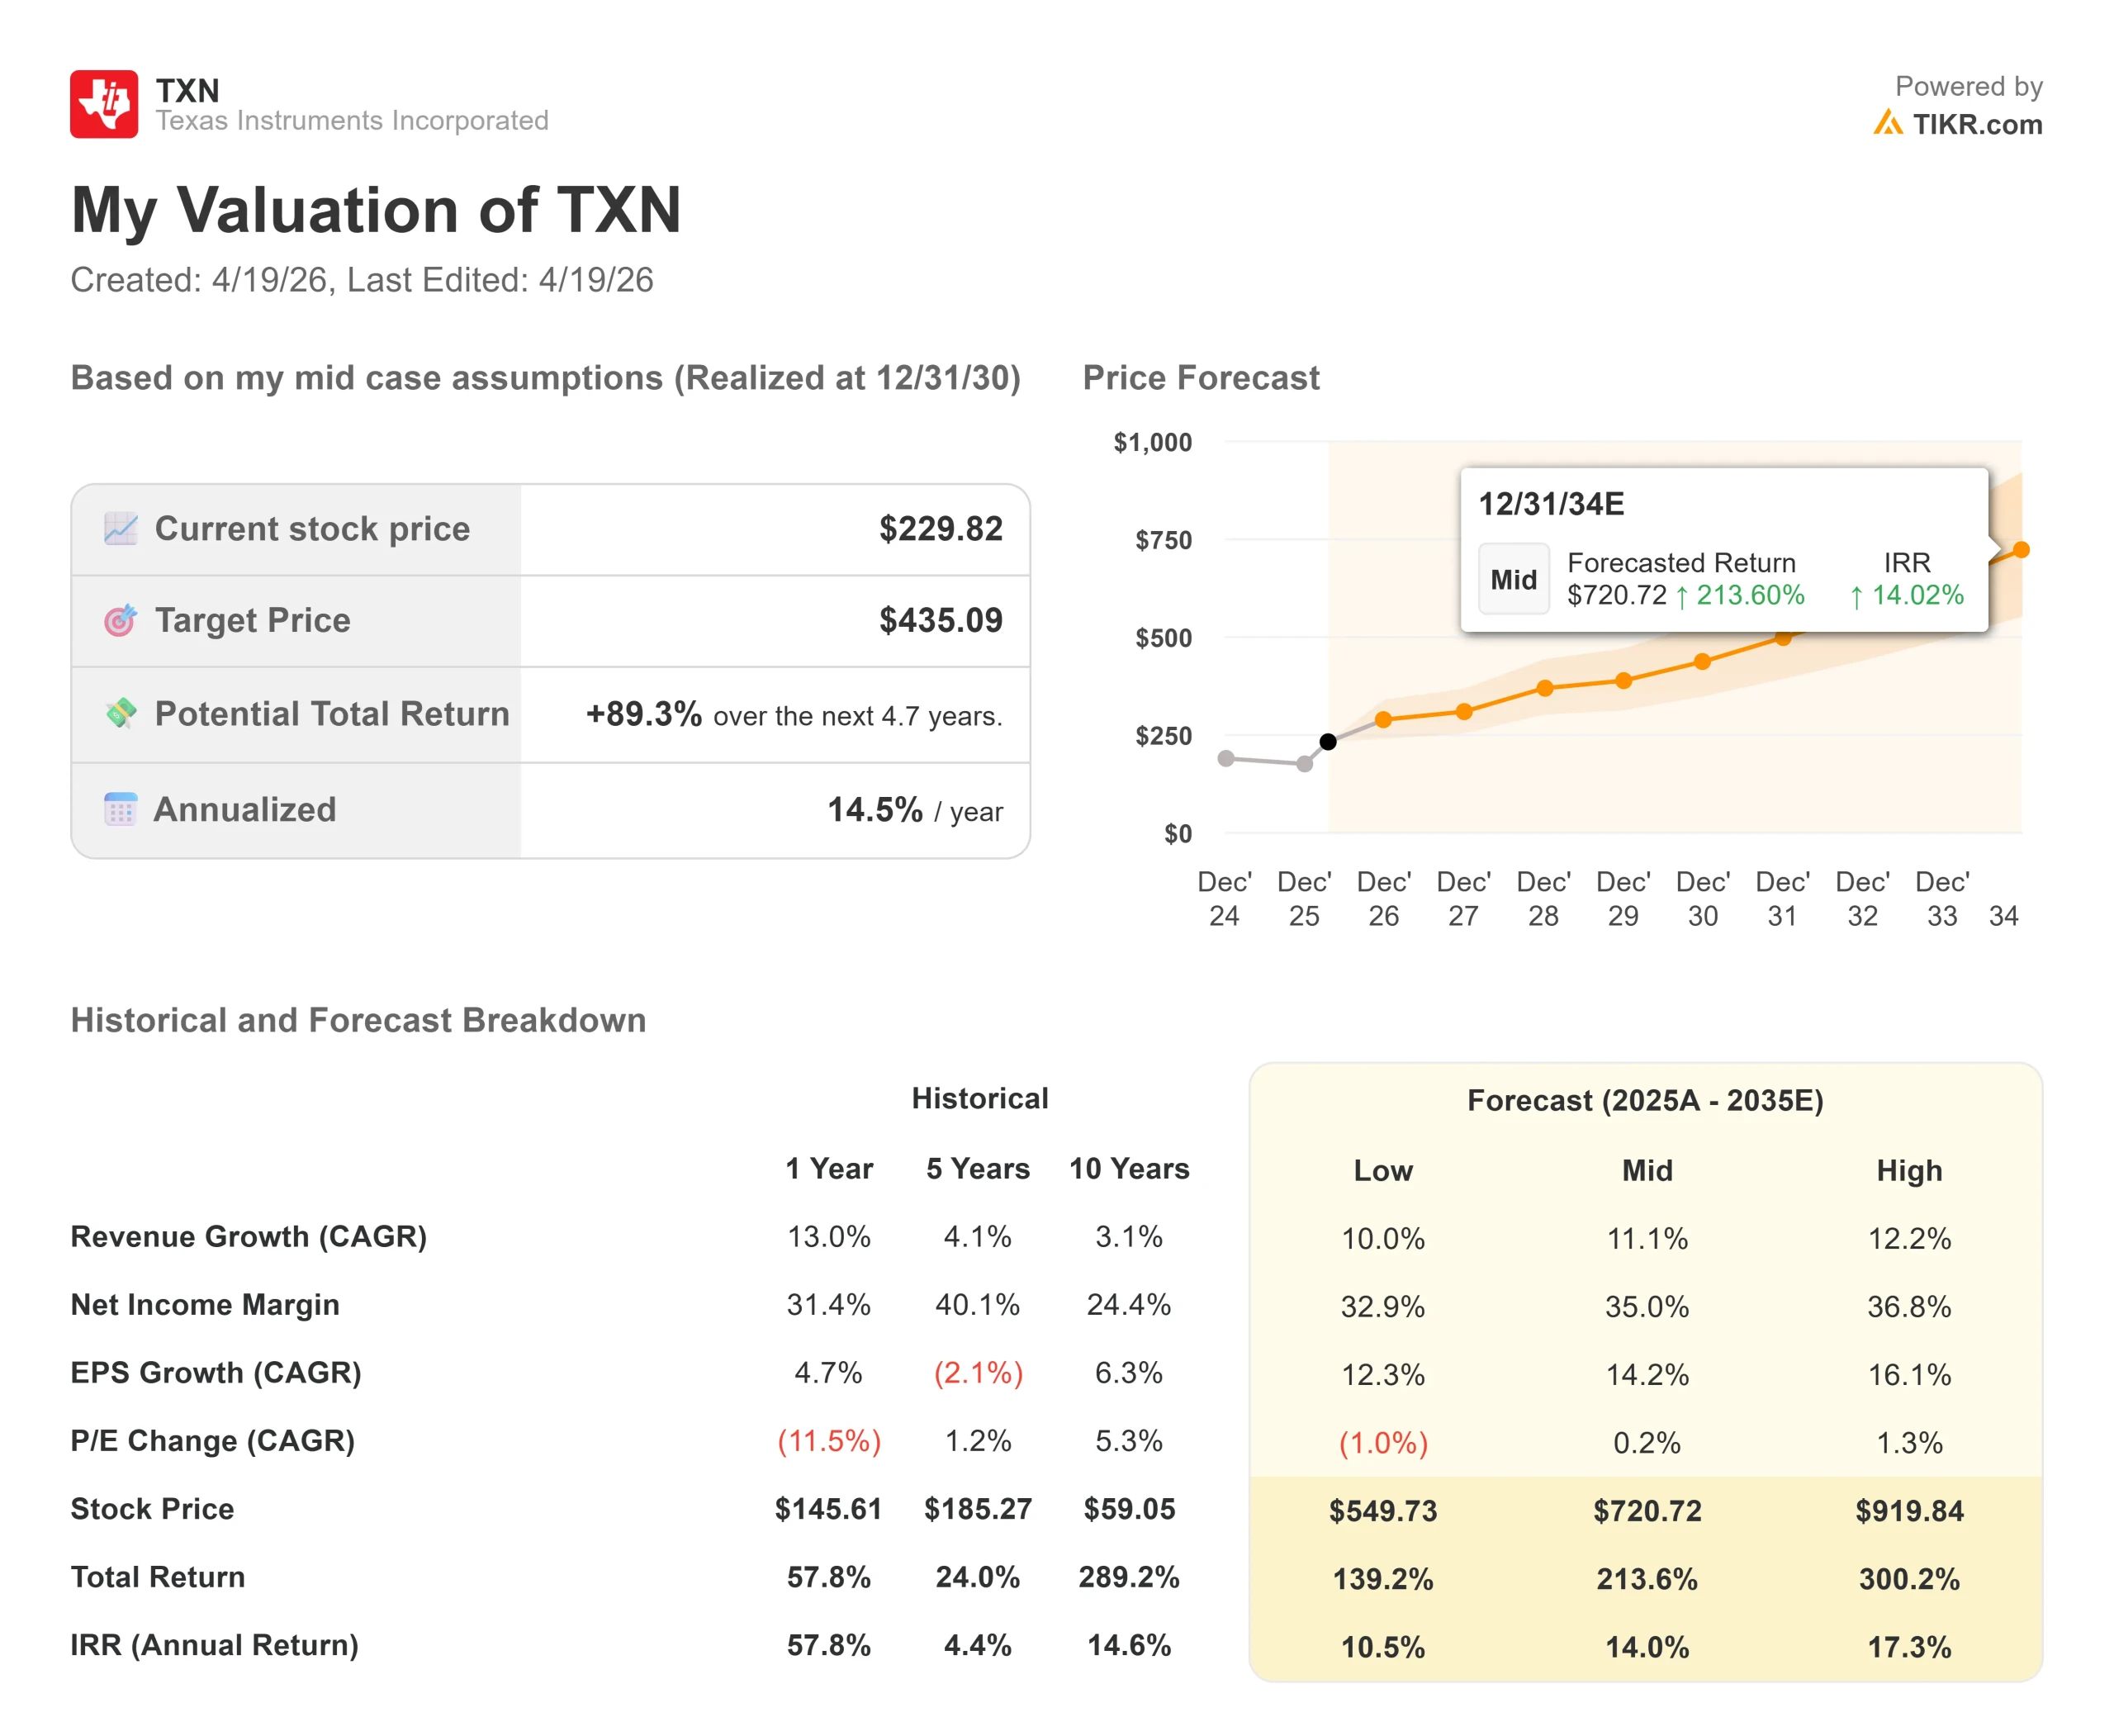
- Current Price: $229.82
- Target Price (Mid): ~$721
- Street Target: ~$224
- Potential Total Return: ~214%
- Annualized IRR: ~14% / year
Now Live: Discover how much upside your favorite stocks could have using TIKR’s new Valuation Model (It’s free) >>>
What Happened?
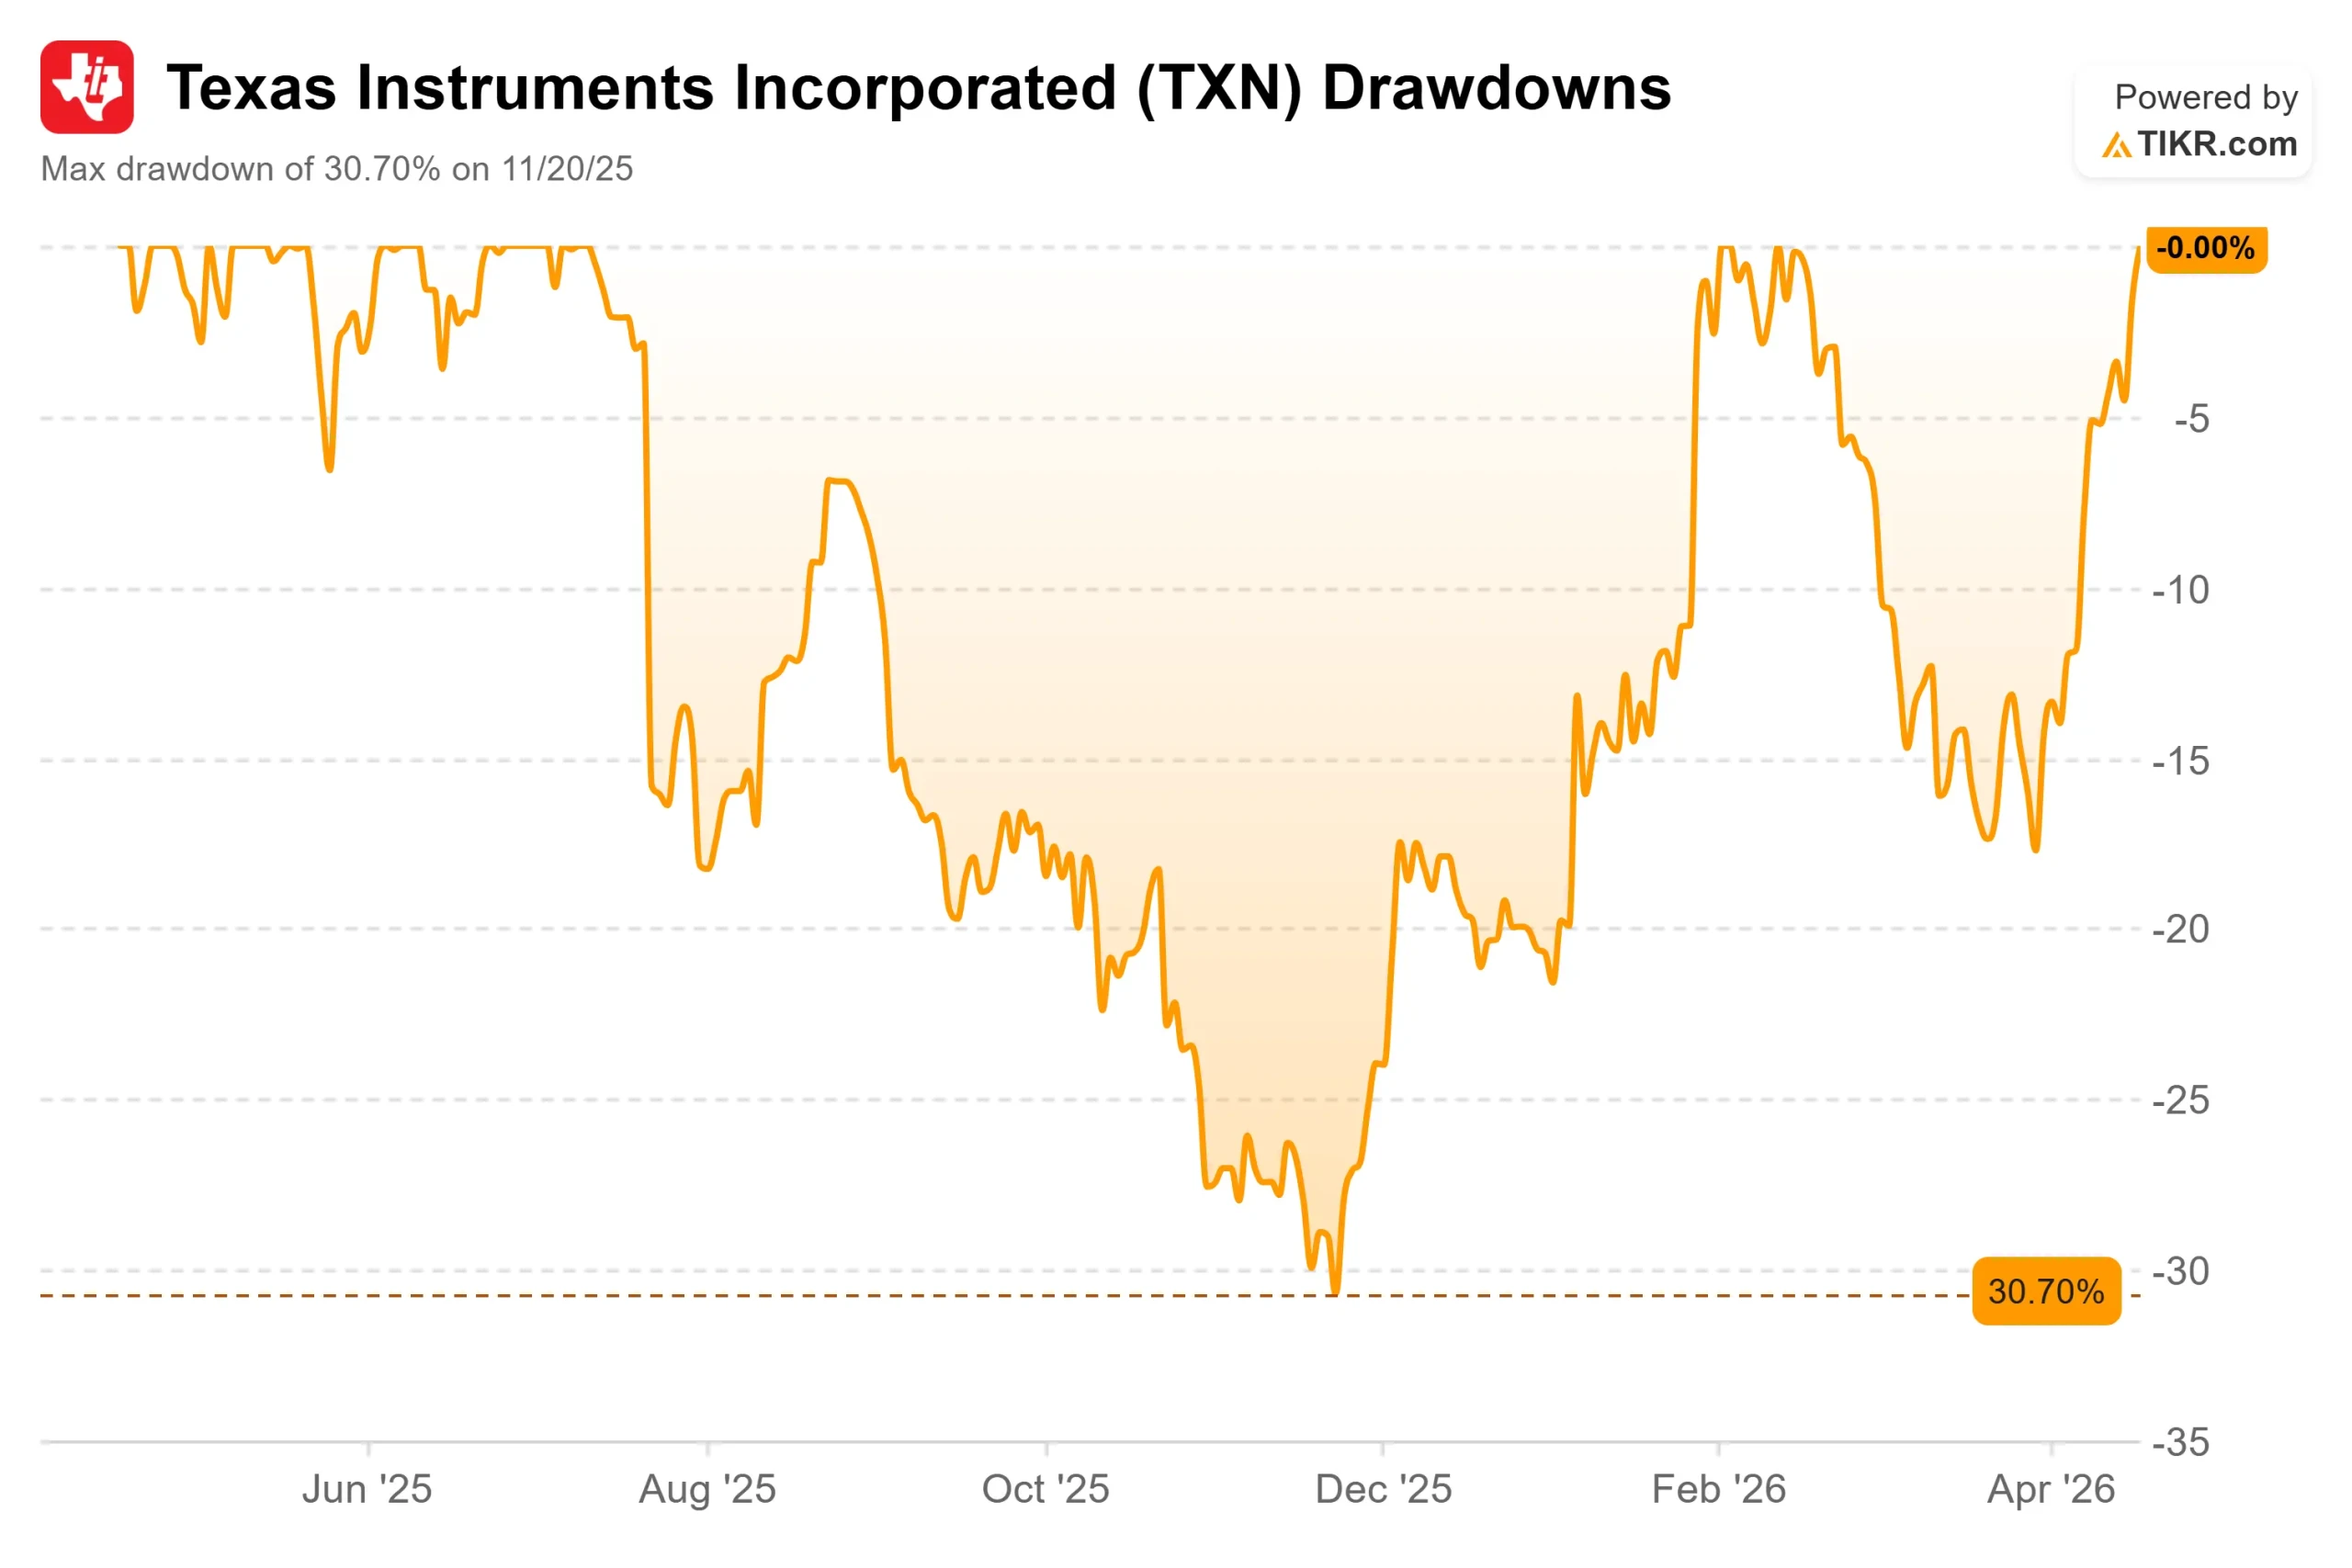
For most of 2025, Texas Instruments (TXN) was the chip sector’s quiet underperformer.
While Nvidia and AMD rallied on AI tailwinds, TXN ground lower as heavy fab construction spending compressed margins and free cash flow. The stock hit a max drawdown of 30.70% on November 20, 2025, its deepest pullback in years.
Then the picture changed. Q4 2025 revenue came in at $4.42 billion, up 10% year-over-year, with free cash flow of $2.9 billion for the trailing twelve months. The stock surged roughly 10% the following session.
CEO Haviv Ilan, TI’s chairman, president, and CEO, said the results “underscored the strength of our business model, the quality of our product portfolio, and the benefit of 300mm production.” For Q1 2026, management guided revenue of $4.32 billion to $4.68 billion and EPS of $1.22 to $1.48.
On February 4, TI announced a definitive agreement to acquire Silicon Labs for $231.00 per share in an all-cash transaction with a total enterprise value of approximately $7.5 billion.
It is TI’s largest acquisition since the $6.5 billion deal for National Semiconductor in 2011. TXN has since climbed 29% year-to-date, reaching a 52-week high of $231.32. Q1 2026 earnings arrive April 22.
See historical and forward estimates for Texas Instruments stock (It’s free!) >>>
Is Texas Instruments Undervalued Today?
The Street is split in a way that sharpens rather than resolves the debate. As of April 17, 2026, the analyst breakdown is 13 Buys, 2 Outperforms, 17 Holds, 2 No Opinions, 1 Underperform, and 4 Sells, with a mean price target of $223.89, below where TXN already trades.
On April 9, Stifel analyst Tore Svanberg upgraded TXN from Hold to Buy with a new $250 target, citing five tailwinds: a structural free cash flow inflection as capital intensity moderates, the Silicon Labs acquisition, AI data center growth, the transition to internal 300mm wafer manufacturing, and analog market share gains.
The FCF story is the bull case in one line. TXN’s 2025 free cash flow was $2.6 billion, or 14.7% of revenue per TIKR, weighed down by $4.55 billion in capex. TIKR consensus projects 2026 FCF expanding to roughly $6.5 billion, growth of around 149% in a single year, as construction spending drops sharply.
On the Q4 2025 earnings call, management noted data center revenue had grown approximately 70% year-over-year and now accounts for roughly 10–11% of the business.
The Silicon Labs acquisition strengthens the embedded processing side. The deal is expected to generate approximately $450 million in annual manufacturing and operational synergies within three years of closing and adds approximately 1,200 wireless connectivity products to TI’s portfolio. TI’s Embedded Processing segment generated $2.7 billion in 2025 revenue versus $14 billion for Analog per TIKR, so the deal meaningfully diversifies its growth runway.
On valuation, TXN trades at 23.07x NTM EV/EBITDA and 35.40x NTM P/E per TIKR. Two direct peers from the TIKR Competitors page: Broadcom sits at 23.99x NTM EV/EBITDA and 30.19x NTM P/E; ASML at 27.92x and 36.71x, respectively.
TXN at rough parity with Broadcom on EBITDA and a slight discount to ASML on earnings, while offering a 2.5% dividend yield backed by 22 consecutive years of dividend increases, makes the relative case more interesting than the absolute multiple suggests.
The risks are real. A Jefferies analyst flagged that TI’s updated inventory target range of 150 to 250 days, up from the prior 130-to-200-plus-days target, could signal weaker demand or risk of future write-downs, challenging the free cash flow expansion the market is pricing in.
The $7.5 billion Silicon Labs price tag adds net debt before synergies arrive. And at 35x forward earnings, TXN is priced for execution; it is still in the process of delivering.

See how Texas Instruments performs against its peers in TIKR (It’s free!) >>>
TIKR Advanced Model Analysis
- Current Price: $229.82
- Target Price (Mid): ~$721
- Potential Total Return: ~214%
- Annualized IRR: ~14% / year
See analysts’ growth forecasts and price targets for Texas Instruments stock (It’s free!) >>>
The TIKR mid-case model reaches approximately $721 by December 31, 2034. The two revenue drivers are industrial and automotive demand recovering toward the historical trend as post-pandemic inventory corrections clear, and data center growing as a structurally larger share of revenue. The margin driver is operating leverage from new fabs ramping toward full utilization, with TIKR projecting net income margins expanding from 28.9% in 2025 toward around 35% by the forecast end, a level TI achieved as recently as 2022.
The downside risk is a prolonged industrial slowdown. If that recovery stalls, the ~11% revenue CAGR assumption breaks down, and margin expansion depends on demand that hasn’t arrived. The Silicon Labs integration also introduces near-term execution risk before synergies materialize.
Conclusion
Watch the free cash flow margin on April 22. TIKR consensus projects roughly 33% FCF margin for full-year 2026. If Q1 trends toward that number on an annualized basis, the bull thesis gets its first hard confirmation from reported figures.
Texas Instruments is emerging from a deliberate, costly investment cycle with a stronger manufacturing base, its largest acquisition in 15 years, and a free cash flow engine the financials are only beginning to reflect. At $229.82, the TIKR mid-case implies roughly 214% upside through 2034 at around 14% annualized.
See what stocks billionaire investors are buying so you can follow the smart money with TIKR.
Should You Invest in Texas Instruments?
The only way to really know is to look at the numbers yourself. TIKR gives you free access to the same institutional-quality financial data that professional analysts use to answer exactly that question.
Pull up Texas Instruments, and you’ll see years of historical financials, what Wall Street analysts expect for revenue and earnings in the quarters ahead, how valuation multiples have moved over time, and whether price targets are trending up or down.
You can build a free watchlist to track Texas Instruments alongside every other stock on your radar. No credit card required. Just the data you need to decide for yourself.
Analyze Texas Instruments on TIKR Free →
Looking for New Opportunities?
- See what stocks billionaire investors are buying so you can follow the smart money.
- Analyze stocks in as little as 5 minutes with TIKR’s all-in-one, easy-to-use platform.
- The more rocks you overturn… the more opportunities you’ll uncover. Search 100K+ global stocks, global top investor holdings, and more with TIKR.
Disclaimer:
Please note that the articles on TIKR are not intended to serve as investment or financial advice from TIKR or our content team, nor are they recommendations to buy or sell any stocks. We create our content based on TIKR Terminal’s investment data and analysts’ estimates. Our analysis might not include recent company news or important updates. TIKR has no position in any stocks mentioned. Thank you for reading, and happy investing!