Key Stats for S&P Global Stock
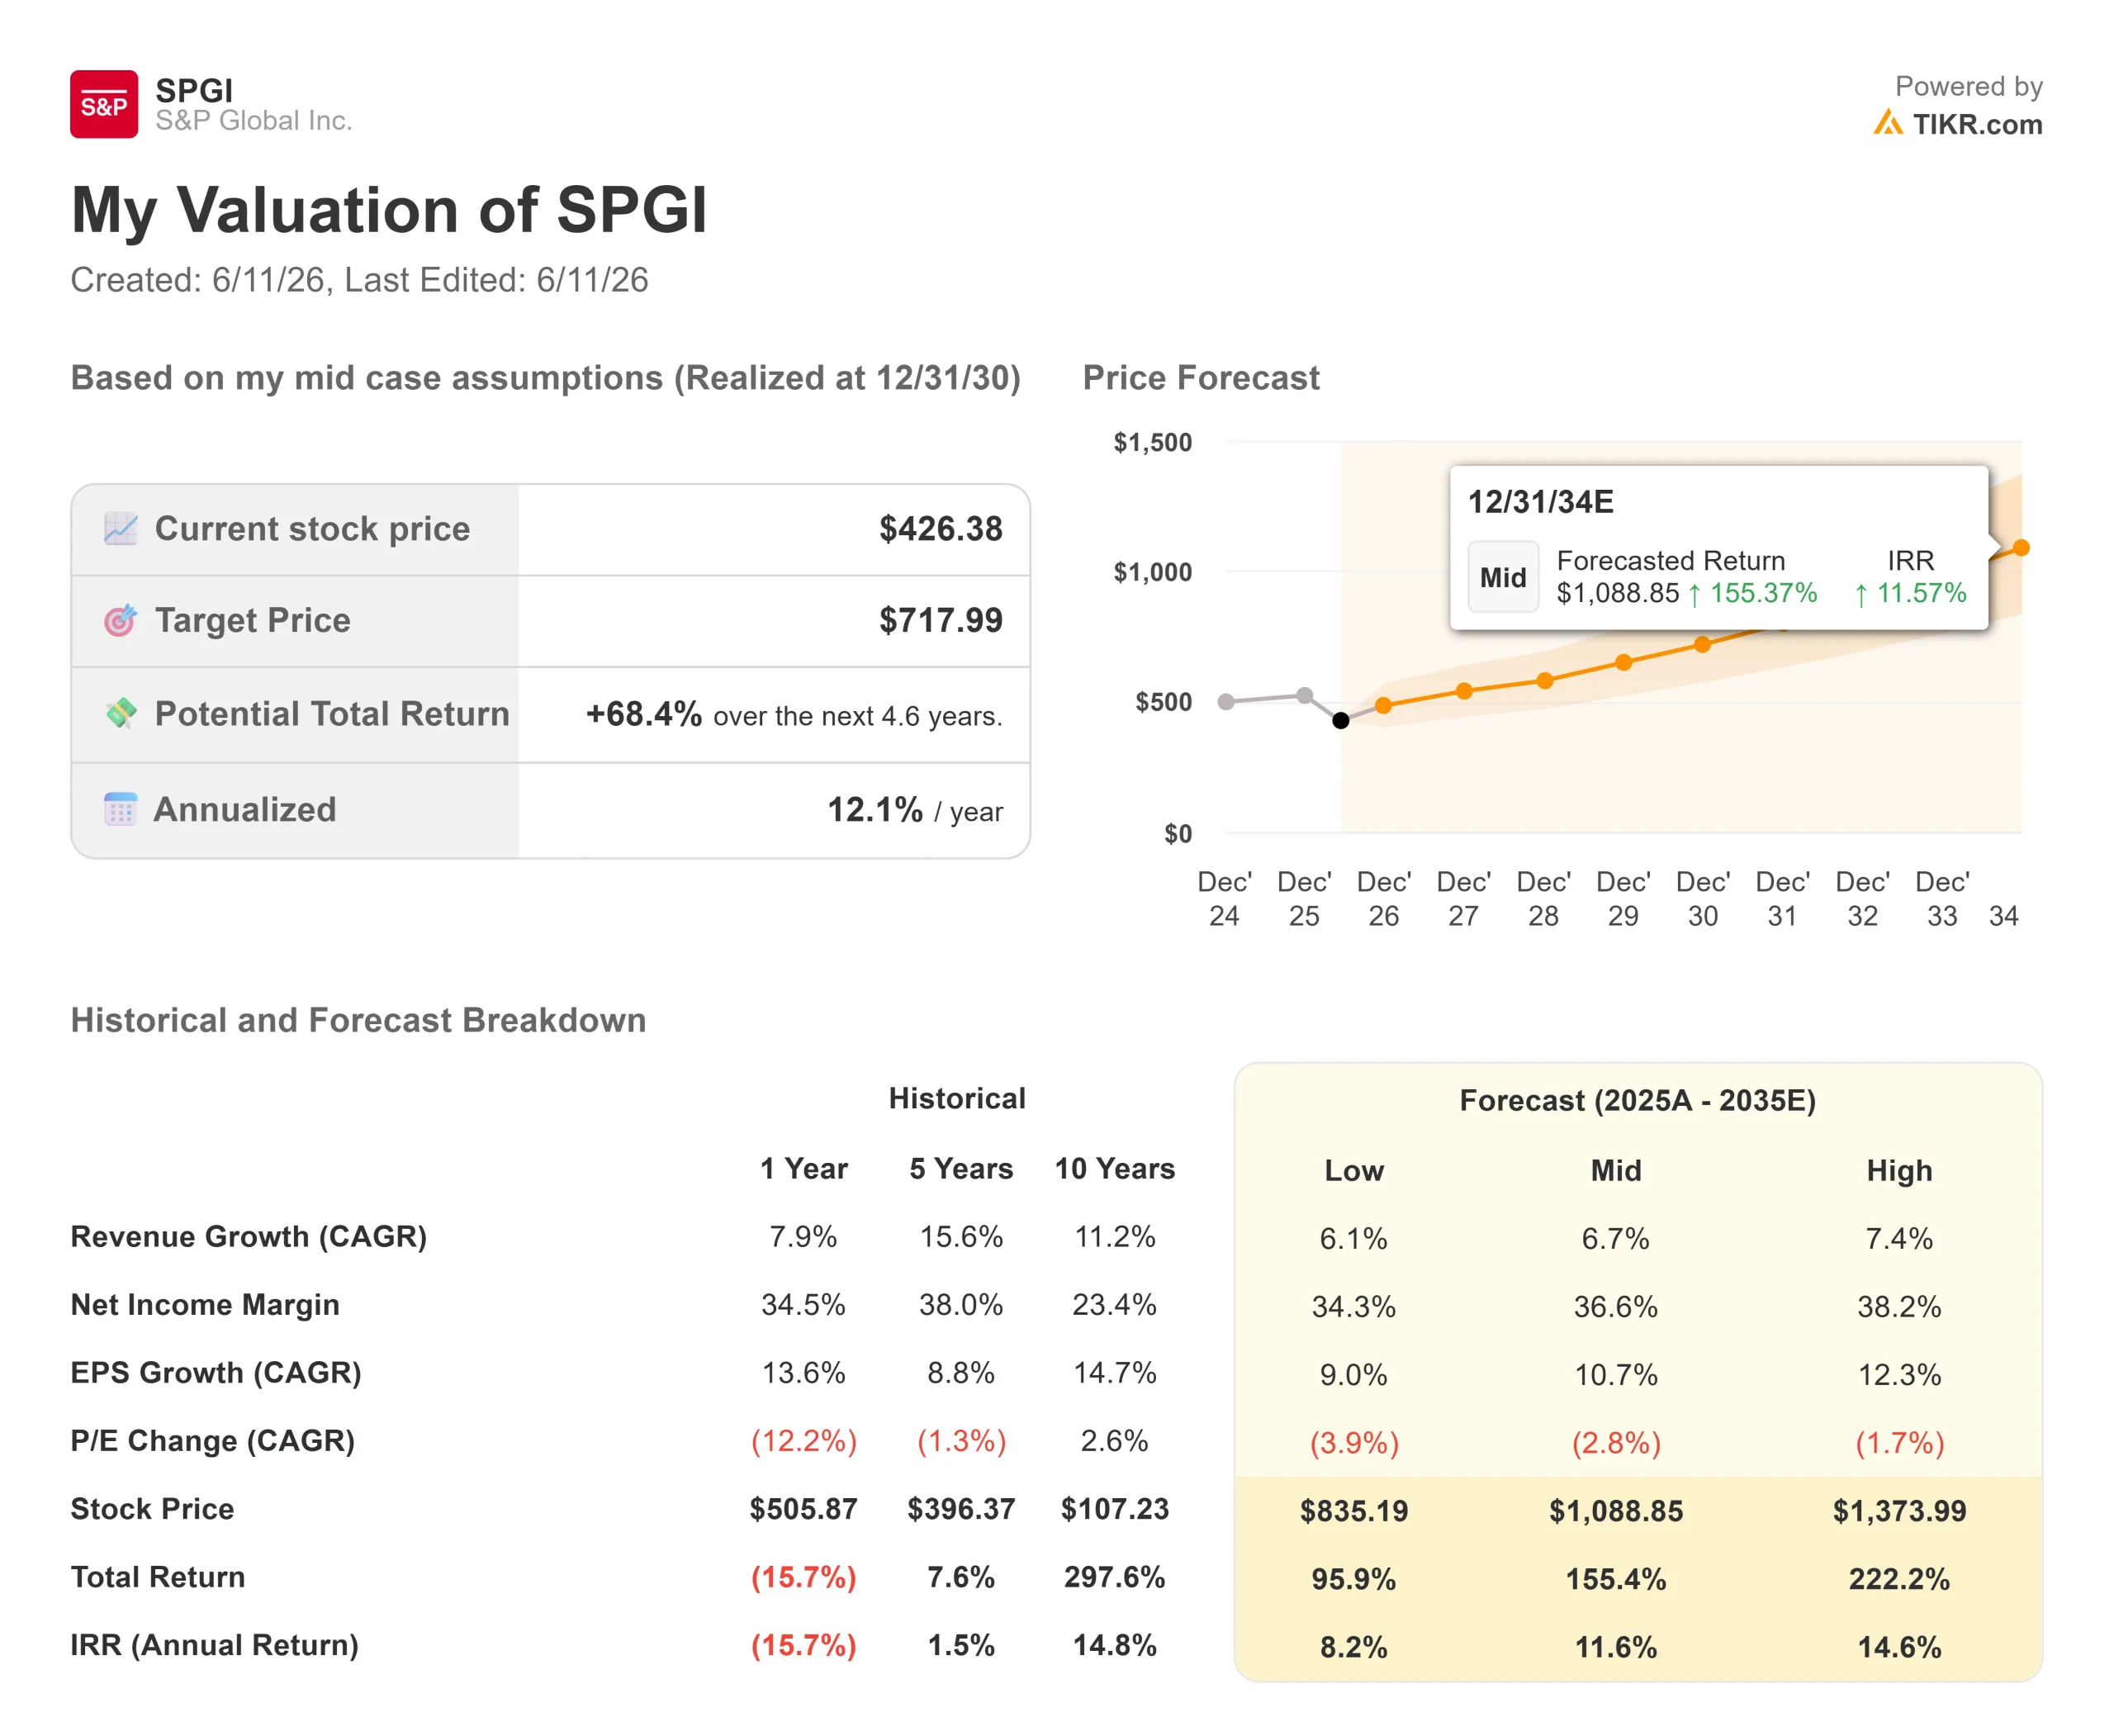
- Current Price: $426.38
- Target Price (Mid): ~$718
- Street Target: ~$534
- Potential Total Return: ~68%
- Annualized IRR: ~12% / year
- Earnings Reaction: -0.06% (April 28, 2026)
- Max Drawdown: -30.73% (February 11, 2026)
Now Live: Discover how much upside your favorite stocks could have using TIKR’s new Valuation Model (It’s free) >>>
What Happened?
The number haunting S&P Global (SPGI) all year has been 30.73%. That is how far the stock fell from its 52-week high of $579.05, bottoming out on February 11, 2026, the day management issued 2026 guidance below Wall Street expectations. Since then, SPGI beat Q1 2026 earnings estimates, committed to approximately $4.5 billion in buybacks for the year, and set a July 1 close date for the Mobility spin-off. The stock is still down 18% year to date.
The market’s real concern is not the guidance miss. It is the fear that Cap IQ, S&P Global’s flagship financial data terminal, is structurally threatened by AI. At the Mizuho Technology Conference on June 10, SVP of Investor Relations Mark Grant offered the most direct answer to that question the company has given yet.
The AI Threat Is Real. It Just Applies to Less Than 6% of Revenue.
The bear case on SPGI rests on one product: Cap IQ Pro, the desktop terminal used by investment professionals to pull company financials, run screening tools, and build comparables. The fear is that AI-native research tools will eventually make it redundant.
Grant addressed this head-on. Cap IQ, he said, “is less than 6% of our total revenue and an even smaller percentage of our profits.” The investor anxiety, he acknowledged, is “about a very, very small part of our business.”
The rest of the revenue picture is different. Grant stated that roughly two-thirds of S&P Global’s revenue and roughly three-quarters of its profit come from benchmarks: the Ratings division, the Index business, and Platts commodities prices. These are, in his words, businesses “where we are the only source on planet earth for that information.”
No AI model can generate a legally recognized S&P credit rating, a Platts crude price assessment, or replicate the S&P 500 index that management estimates has between $15 trillion and $20 trillion of assets benchmarked against it. That is not a competitive moat in the figurative sense. It is a structural one.

See historical and forward estimates for S&P Global stock (It’s free!) >>>
What AI Is Actually Doing to the Business
The more revealing part of the Mizuho session was Grant’s description of what AI is doing to S&P Global’s commercial performance right now, not the rebuttal of the bear case.
API call volumes through the company’s MCP (Model Context Protocol, a standard for connecting AI systems to external data sources) connectors increased 500% quarter-over-quarter and 100% month-over-month in the most recent quarter. Enterprise customers are embedding S&P Global data directly into their AI workflows through Kensho’s LLM-ready APIs (application programming interfaces that make financial data consumable by AI models). Customers using AI features are growing 30% faster than non-AI customers, per figures cited during the conference session.
Net renewal rates expanded 100 basis points last quarter. A handful of early AI contract renewals came in 35% to 45% above prior contract values, according to analyst figures referenced in the session. Grant described the customer feedback plainly: “Your data is great. For most of what we’re consuming, you’re the only source we have, and all of the tools that we’re looking at using or starting to deploy now require us to consume more data at higher volumes at higher velocity.”
That is the opposite of substitution. It is acceleration.
Vendor consolidation is reinforcing the trend. S&P Global’s Chief Client Office, led by Chief Client Officer Sally Moore and covering roughly 150 of the company’s largest strategic accounts, has systematically helped customers eliminate third-party point solutions by consolidating more spend with S&P Global. The customer’s total cost of ownership falls while S&P Global’s contract value rises.
The Mobility Spin Changes the Capital Picture in 20 Days
The Mobility division, which provides automotive data and analytics to manufacturers, insurers, and dealers, generated $1.747 billion in revenue and $378 million in operating income in FY2025. On July 1, S&P Global will distribute 100% of Mobility shares to existing shareholders on a one-for-one basis, with June 15 as the record date.
Ahead of that distribution, Mobility Global priced a $2 billion senior notes offering in May 2026, with proceeds distributed to S&P Global. Grant confirmed those proceeds will go into share repurchases, raising the 2026 capital return commitment to 100% of adjusted free cash flow, or approximately $4.5 billion in buybacks for the year. The company already returned $1.0 billion in Q1 2026 through repurchases alone.
At a market cap of roughly $126 billion, a $4.5 billion repurchase program retires approximately 3.6% of shares outstanding in a single year, at a price 26% below the 52-week high, while 23 of 24 analyst recommendations remain Buy or Outperform. Grant was direct: “The return that we get on buying back stock, I think, is very high.”

How SPGI Compares to Peers
According to TIKR’s Competitors data, Moody’s Corporation (MCO) trades at 19.23x NTM EV/EBITDA and CME Group (CME) at 19.55x. SPGI sits at 16.51x, a nearly 3-turn discount to Moody’s, despite both companies holding the same structural position as the two dominant global credit rating agencies. On a price-to-earnings basis, SPGI trades at 21.03x NTM P/E versus Moody’s at 26.35x.
The case for a discount is Cap IQ. The case against it is everything else in the portfolio. The discount today appears to price the tail of the business, not the body.
The Ratings Tailwind Most Investors Are Overlooking
The Ratings division is typically treated as cyclical, rising and falling with debt issuance volumes. The structural setup for 2027 and 2028 has received less attention.
Grant noted at Mizuho that the three-year forward cumulative maturity wall, meaning the stock of existing debt that must be refinanced over the next three years, is up double digits from a year ago. Much of the 2027 and 2028 wall is debt issued in 2020 and 2021 at historically low rates. Issuers have little incentive to refinance early, so the volume is likely to arrive in concentrated form when it comes due.
Near-term issuance is also running ahead of expectations. Q1 2026 billed issuance grew 14% year-over-year, with hyperscaler investment-grade bond issuance as a primary driver. Grant noted S&P Global’s 2026 forecast assumes less than half of announced hyperscaler CapEx actually comes to market as debt, making the guidance intentionally conservative.
Private credit added further momentum. Private markets revenue across S&P Global’s enterprise exceeded $600 million in 2025 and grew 25% within the Ratings division in Q1 2026 alone.
See how S&P Global performs against its peers in TIKR (It’s free!) >>>
TIKR Advanced Model Analysis
- Current Price: $426.38
- Target Price (Mid): ~$718
- Potential Total Return: ~68%
- Annualized IRR: ~12% / year
See analysts’ growth forecasts and price targets for S&P Global stock (It’s free!) >>>
The TIKR mid-case model targets a revenue CAGR of around 7% through 2030. Two primary drivers support that forecast: continued pricing power and customer expansion in Ratings and Indices, and AI-driven data volume growth in Market Intelligence through API and MCP connector adoption. Consensus estimates show revenue reaching approximately $16.5 billion in 2026 and over $21 billion by 2030.
The margin driver is operational leverage in Market Intelligence, where roughly half of S&P Global’s global headcount sits. The mid-case targets a net income margin of around 37% by 2030, compared to 35.5% in 2025, consistent with what Grant described as the segment’s greatest opportunity for profit margin expansion through AI productivity gains.
The primary risk is leadership continuity in Market Intelligence. Saugata Saha, who reduced the segment’s commission structures from more than 60 plans down to 10 and oversaw the rollout of AI tools, including ChatIQ and Document Intelligence, announced his departure in May 2026. His successor has not been named. The commercial foundation he built is intact, but the transition introduces execution uncertainty that has partly kept the stock from responding to strong earnings results.
Conclusion
Two events will determine whether the valuation discount closes. The first is July 1, when the Mobility spin-off completes, and the market gets its first chance to re-rate S&P Global as a cleaner financial intelligence and benchmarks franchise. The second is Q2 2026 earnings, expected in late July. The specific threshold to watch: whether net renewal rates expand beyond the 100 basis point improvement seen in Q1, confirming that AI-driven contract value is showing up in reported numbers and not just conference commentary.
Both datapoints arrive within the next 45 days.
See what stocks billionaire investors are buying so you can follow the smart money with TIKR.
Should You Invest in S&P Global?
The only way to really know is to look at the numbers yourself. TIKR gives you free access to the same institutional-quality financial data that professional analysts use to answer exactly that question.
Pull up S&P Global, and you’ll see years of historical financials, what Wall Street analysts expect for revenue and earnings in the quarters ahead, how valuation multiples have moved over time, and whether price targets are trending up or down.
You can build a free watchlist to track S&P Global alongside every other stock on your radar. No credit card required. Just the data you need to decide for yourself.
Analyze S&P Global on TIKR Free →
Looking for New Opportunities?
- See what stocks billionaire investors are buying so you can follow the smart money.
- Analyze stocks in as little as 5 minutes with TIKR’s all-in-one, easy-to-use platform.
- The more rocks you overturn… the more opportunities you’ll uncover. Search 100K+ global stocks, global top investor holdings, and more with TIKR.
Disclaimer:
Please note that the articles on TIKR are not intended to serve as investment or financial advice from TIKR or our content team, nor are they recommendations to buy or sell any stocks. We create our content based on TIKR Terminal’s investment data and analysts’ estimates. Our analysis might not include recent company news or important updates. TIKR has no position in any stocks mentioned. Thank you for reading, and happy investing!