

Key Stats
- Current Price: $16 (April 30, 2026)
- Q1 2026 Revenue: $1.09B, up ~42% YoY
- Q1 2026 Adjusted EPS: $0.12, up ~91% YoY
- Q1 2026 Adjusted EBITDA: $340M, up 62% YoY, 31% margin
- Q1 2026 Net Income: $167M, 15% margin
- Q2 2026 Revenue Guidance: ~$1.115B (~30% YoY growth)
- Q2 2026 EPS Guidance: $0.10 to $0.11
- Full-Year 2026 Revenue Guidance: Unchanged (implies ~30% growth)
- Full-Year 2026 EPS Guidance: $0.50
- TIKR Model Price Target: $38
- Implied Upside: ~133%
SoFi Technologies Stock Posts 41% Revenue Growth in Q1 2026

SoFi Technologies stock (SOFI) delivered $1.09B in adjusted net revenue for Q1 2026, up 41% year-over-year and ahead of its own guidance range.
Adjusted EPS came in at $0.12, doubling from $0.06 in the prior-year quarter.
The Lending segment was the headline driver, generating $629M in adjusted net revenue, up 53% year-over-year, according to CFO Chris Lapointe on the Q1 earnings call.
Total loan originations hit $12.2B for the quarter, a record across all three categories: personal loans reached $8.3B, student loans hit $2.6B (up 2.2x year-over-year), and home loans came in at $1.2B (up 2.4x year-over-year), according to Lapointe on the Q1 earnings call.
Financial Services contributed $429M in adjusted net revenue, also up 41% year-over-year, with interchange revenue growing 54% and brokerage fee revenue more than doubling over the past year, according to Lapointe on the Q1 earnings call.
The Technology Platform segment posted $75M in net revenue, reflecting the previously disclosed exit of a large customer; on a like-for-like basis, the segment grew approximately 12% year-over-year, according to CEO Anthony Noto on the Q1 earnings call.
Adjusted EBITDA reached $340M at a 31% margin, and SoFi Technologies reported its tenth consecutive profitable quarter with net income of $167M.
Member growth accelerated to 1.1 million new members in Q1, bringing the total to 14.7 million — up 35% year-over-year — while total products grew 39% to 22.2 million.
For Q2 2026, management guided for adjusted net revenue of approximately $1.115B and EPS of $0.10 to $0.11, reflecting planned acceleration of marketing spend in the first half and seasonal payroll tax headwinds, with full-year 2026 guidance of $0.50 EPS left unchanged.
Management also confirmed it now expects no Fed rate cuts in 2026, operating under a rate outlook consistent with Fed funds futures.
SoFi Technologies Stock: What the Financials Show
The Q1 2026 income statement tells a clear operating leverage story: SoFi Technologies has scaled revenue fast enough that each incremental dollar is now dropping through at a materially higher rate than a year ago.
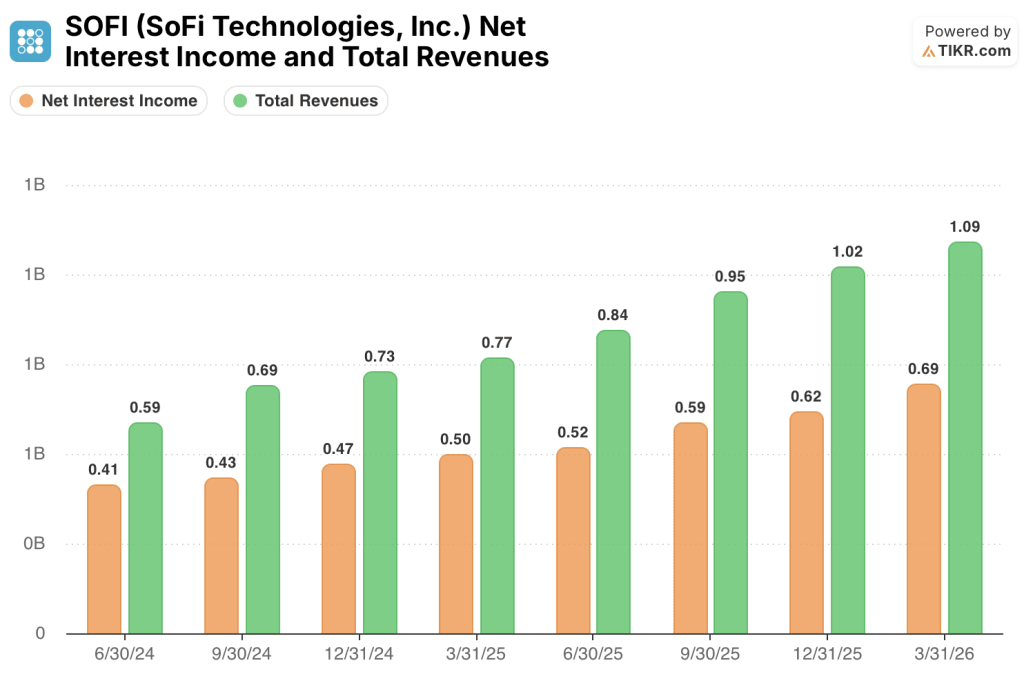
Net interest income grew from $500M in Q1 2025 to $690M in Q1 2026, a 39% increase, with the sequential trajectory running from $410M in Q2 2024 through $430M, $470M, $500M, $520M, $590M, $620M and now $690M.
Total revenues reached $1.09B in Q1 2026, up 42% year-over-year from $770M, and up sequentially from $1.02B in Q4 2025.

Operating income was $200M in Q1 2026, up 150% year-over-year from $80M in Q1 2025.
Operating margin expanded to 18% in Q1 2026, up from 10% in Q1 2025, continuing a consistent multi-quarter climb: 3% in Q2 2024, 9% in Q3 2024, 8% in Q4 2024, 10% in Q1 2025, 13% in Q2 2025, 16% in Q3 2025, 18% in Q4 2025, and now 18% again in Q1 2026.
Total operating expenses grew to $890M from $690M a year ago, a 29% increase that meaningfully lagged the 42% revenue growth rate, which is what produced the margin expansion.
What Does the Valuation Model Say?
The TIKR model prices SoFi Technologies stock at $37.57, implying approximately 133% upside from the current price of $16.10.
The mid-case assumptions underlying that target are a revenue CAGR of 16.8% through 2035 and a net income margin of 19.4%, both of which look achievable given the trajectory Q1 2026 just established: 41% revenue growth and a net income margin already at 15% in a single quarter.
The Q1 result strengthens the investment case in a specific way: the margin expansion is happening faster than the model’s base assumptions require, and it is being driven by structural operating leverage rather than one-time items.
SoFi Technologies stock is trading at roughly $16, against a model target that requires execution the company is already demonstrating.

The debate for SoFi Technologies stock is whether the Lending segment’s record originations represent a durable run rate or a peak driven by favorable credit conditions.
Bull Case
- Lending adjusted net revenue of $629M in Q1 2026 came with a 61% contribution margin, confirming that volume gains are dropping through profitably, not just lifting the top line
- Personal loan net charge-offs, excluding delinquent loan sales, held at 4.4% — flat quarter-over-quarter and down roughly 40 basis points from Q1 2025, with recent vintages tracking well below the 7% to 8% tolerance
- Loan platform business added $3.6B in new partner commitments in Q1 alone, with demand from partners exceeding contractual obligations, providing a capital-light volume channel that expands the origination ceiling
- Financial Services noninterest income grew 55% year-over-year, and the SoFi Plus relaunch in April is generating cross-buy from the majority of new paying subscribers, adding a recurring revenue stream the model does not yet fully reflect
Bear Case
- Q2 2026 guidance of $0.10 to $0.11 EPS is sequentially lower than Q1’s $0.12, with management citing accelerated marketing spend and seasonal payroll taxes as deliberate headwinds through mid-year
- The Technology Platform segment is guiding to only $325M for the full year, with Q1’s $75M run rate implying a segment that is still absorbing the revenue hole from the large customer exit
- Net interest margin of 5.94% depends on a no-rate-cut environment; with management now baking in zero Fed cuts for 2026, any macro reversal that pressures benchmark rates could compress NII faster than origination growth can offset
- Tangible book value per share of $7.21 against a stock price of $16.10 means SoFi Technologies stock is trading at a 2.2x price-to-tangible-book multiple, leaving limited margin of safety if credit performance deteriorates in the back half of 2026
Should You Invest in SoFi Technologies, Inc.?
The only way to really know is to look at the numbers yourself. TIKR gives you free access to the same institutional-quality financial data that professional analysts use to answer exactly that question.
Pull up SOFI stock and you’ll see years of historical financials, what Wall Street analysts expect for revenue and earnings in the quarters ahead, how valuation multiples have moved over time, and whether price targets are trending up or down.
You can build a free watchlist to track SoFi Technologies, Inc. alongside every other stock on your radar. No credit card required. Just the data you need to decide for yourself.
Access Professional Tools to Analyze SOFI stock on TIKR for Free →


