Key Stats for SoFi Technologies Stock
- Last-30-Day Performance: -28%
- 52-Week Range: $9 to $33
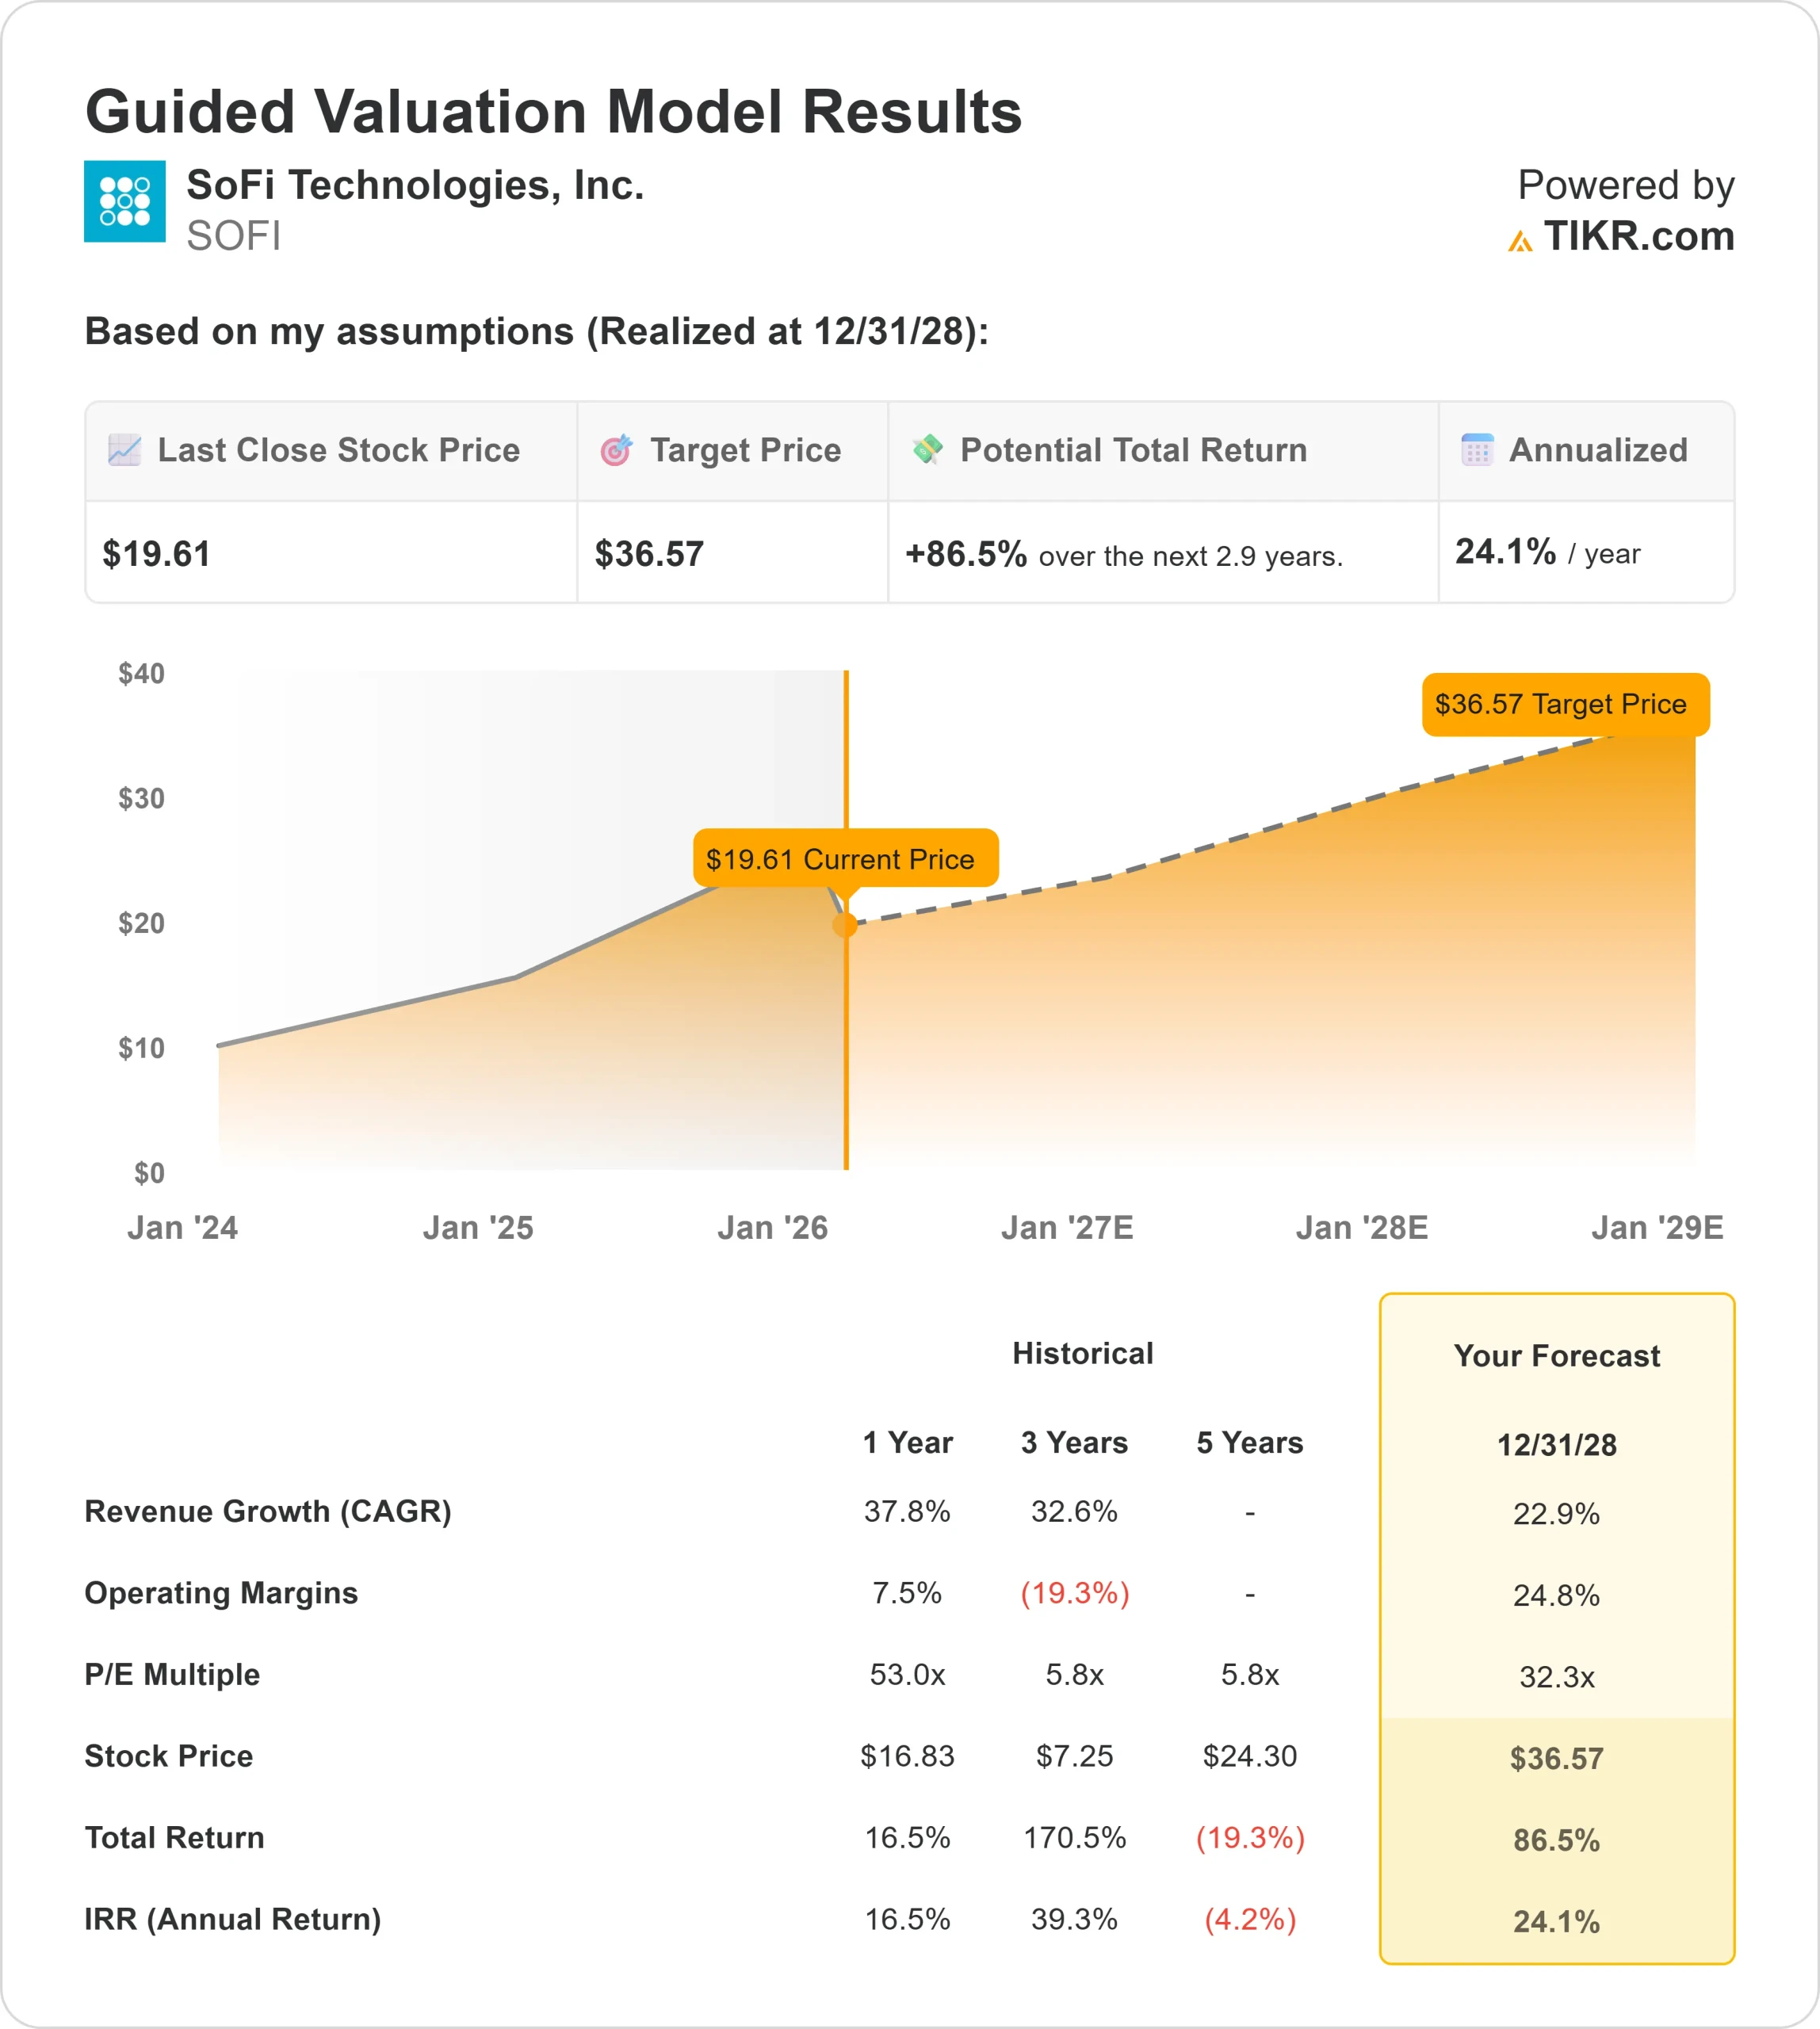
- Valuation Model Target Price: $37
- Implied Upside: 87%
Value your favorite stocks like SoFi Technologies with 5 years of analysts’ forecasts using TIKR’s new Valuation Model (It’s free) >>>
What Happened?
SoFi stock fell about 28% in the last 30 days, recently trading near $20 per share, as investors reacted to fintech sector volatility, insider selling disclosures, and portfolio repositioning despite strong earnings results. Shares remain well below their $33 52-week high, reflecting short-term multiple compression rather than weakening fundamentals.
Part of the pressure followed a 6.1% intraday drop to $19.30 on roughly 63 million shares traded, about 6% above average volume, after Director Steven Freiberg sold 94,225 shares at an average price of $20.31 for approximately $1.91 million.
The sale reduced his stake by 13.79%, contributing to short-term sentiment weakness.
The decline came even as SoFi reported record Q4 results and strong 2026 guidance. Adjusted net revenue reached $1.013 billion, up 37% year over year, while adjusted EBITDA totaled $318 million with a 31% margin. Net income came in at $174 million and EPS was $0.13.
CEO Anthony Noto said 2025 was “a tremendous year on all fronts,” as SoFi added a record 1.0 million members in Q4 to reach 13.7 million members, grew total products 37% year over year to more than 20 million, generated record loan originations of $10.5 billion, and increased fee-based revenue 53% to $443 million. Deposits rose by $4.6 billion to $37.5 billion.
Institutional positioning was mixed. Stratos Wealth Partners increased its position by 103% in Q3 to 188,691 shares valued at about $4.99 million, while Caprock Group and Allianz Asset Management initiated new stakes worth approximately $5.83 million and $6.15 million.
Institutional ownership stands near 38.43%, although State of Michigan Retirement System reduced its holdings by 33.3% and Truist Financial trimmed its stake by 33.0%.
Analyst sentiment remains constructive after Citizens JMP upgraded SoFi to an Outperform rating with a $30 price target, implying roughly 43.8% upside from the prior close.
See analysts’ growth forecasts and price targets for SoFi Technologies (It’s free) >>>
Is SoFi Technologies Undervalued?
Under valuation assumptions, the stock is modeled using:
- Revenue Growth (CAGR): 22.9%
- Operating Margins: 24.8%
- Exit P/E Multiple: 32.3x
Revenue projections reflect growth from $3,591 million in 2025 to approximately $4,609 million in 2026, supported by continued member expansion and scaling capital-light revenue streams.
Management guided to approximately $4.655 billion in adjusted net revenue for 2026, representing about 30% year-over-year growth.
Fee-based revenue reached $443 million in Q4, up 53% year over year, reflecting expansion in the loan platform business, brokerage revenue, interchange, and referral income.
Continued growth in these areas improves earnings durability and reduces reliance on balance sheet-driven growth.

Deposits increased to $37.5 billion, strengthening funding flexibility and supporting net interest margins above 5%.
As deposits scale and fixed costs are leveraged across a larger member base, incremental revenue can translate into expanding operating income.
Adjusted EBITDA margin reached 31% in Q4, and management guided to roughly 34% EBITDA margins in 2026.
Based on these inputs, the valuation model estimates a target price of $36.57, implying approximately 86.5% upside, which rounds to 87%, indicating the stock appears undervalued at current levels near $19.61.
Future performance into 2026 will likely depend on sustaining at least 30% member growth, expanding the loan platform business, scaling brokerage and crypto initiatives, and maintaining strong credit performance.
If execution remains consistent, upside would be driven by operating leverage and revenue diversification rather than multiple expansion alone.
Estimate a company’s fair value instantly (Free with TIKR) >>>
Value Any Stock in Under 60 Seconds (It’s Free)
With TIKR’s new Valuation Model tool, you can estimate a stock’s potential share price in under a minute.
All it takes is three simple inputs:
- Revenue Growth
- Operating Margins
- Exit P/E Multiple
From there, TIKR calculates the potential share price and total returns under Bull, Base, and Bear scenarios so you can quickly see whether a stock looks undervalued or overvalued.
If you’re not sure what to enter, TIKR automatically fills in each input using analysts’ consensus estimates, giving you a quick, reliable starting point.
See a stock’s true value in under 60 seconds (Free with TIKR) >>>