Key Stats for Danaher Stock
- Past-30-Day Performance: -10%
- 52-Week Range: $171 to $243
- Valuation Model Target Price: $272
- Implied Upside: 28%
Value your favorite stocks like Danaher Corporation with 5 years of analysts’ forecasts using TIKR’s new Valuation Model (It’s free) >>>
What Happened?
Danaher Corporation stock fell about 10% in the last 30 days, recently trading near $213 per share as investors reacted to broader healthcare weakness and short-term growth concerns despite solid earnings results. Shares remain below the $243 52-week high and above the $171 52-week low, reflecting valuation compression rather than operational deterioration.
The stock moved lower as investors focused on conservative 2026 growth guidance and ongoing softness in academic and biotech funding, even though Q4 results exceeded expectations. Sales reached $6.8 billion with 2.5% core revenue growth, adjusted EPS rose 4% to $2.23, and free cash flow totaled $1.8 billion.
CEO Rainer Blair said the company delivered “better-than-expected performance across the portfolio,” while guiding for 3% to 6% core revenue growth and adjusted EPS of $8.35 to $8.50 in 2026.
Segment performance showed gradual improvement but not a sharp rebound. Biotechnology core revenue increased 6%, Diagnostics rose 2%, and bioprocessing consumables remained strong with equipment orders improving sequentially.
Management also reported respiratory revenue of approximately $500 million in Q4 and expects about $1.8 billion for full-year 2026 under a normal season assumption, reinforcing steady but measured growth expectations.
Institutional ownership remains high at roughly 79.05%, with several large investors increasing positions in recent quarters.
While some firms trimmed exposure, overall positioning suggests long-term conviction remains intact even as the stock reprices near-term growth expectations.
See analysts’ growth forecasts and price targets for Danaher Corporation (It’s free) >>>
Is Danaher Undervalued?
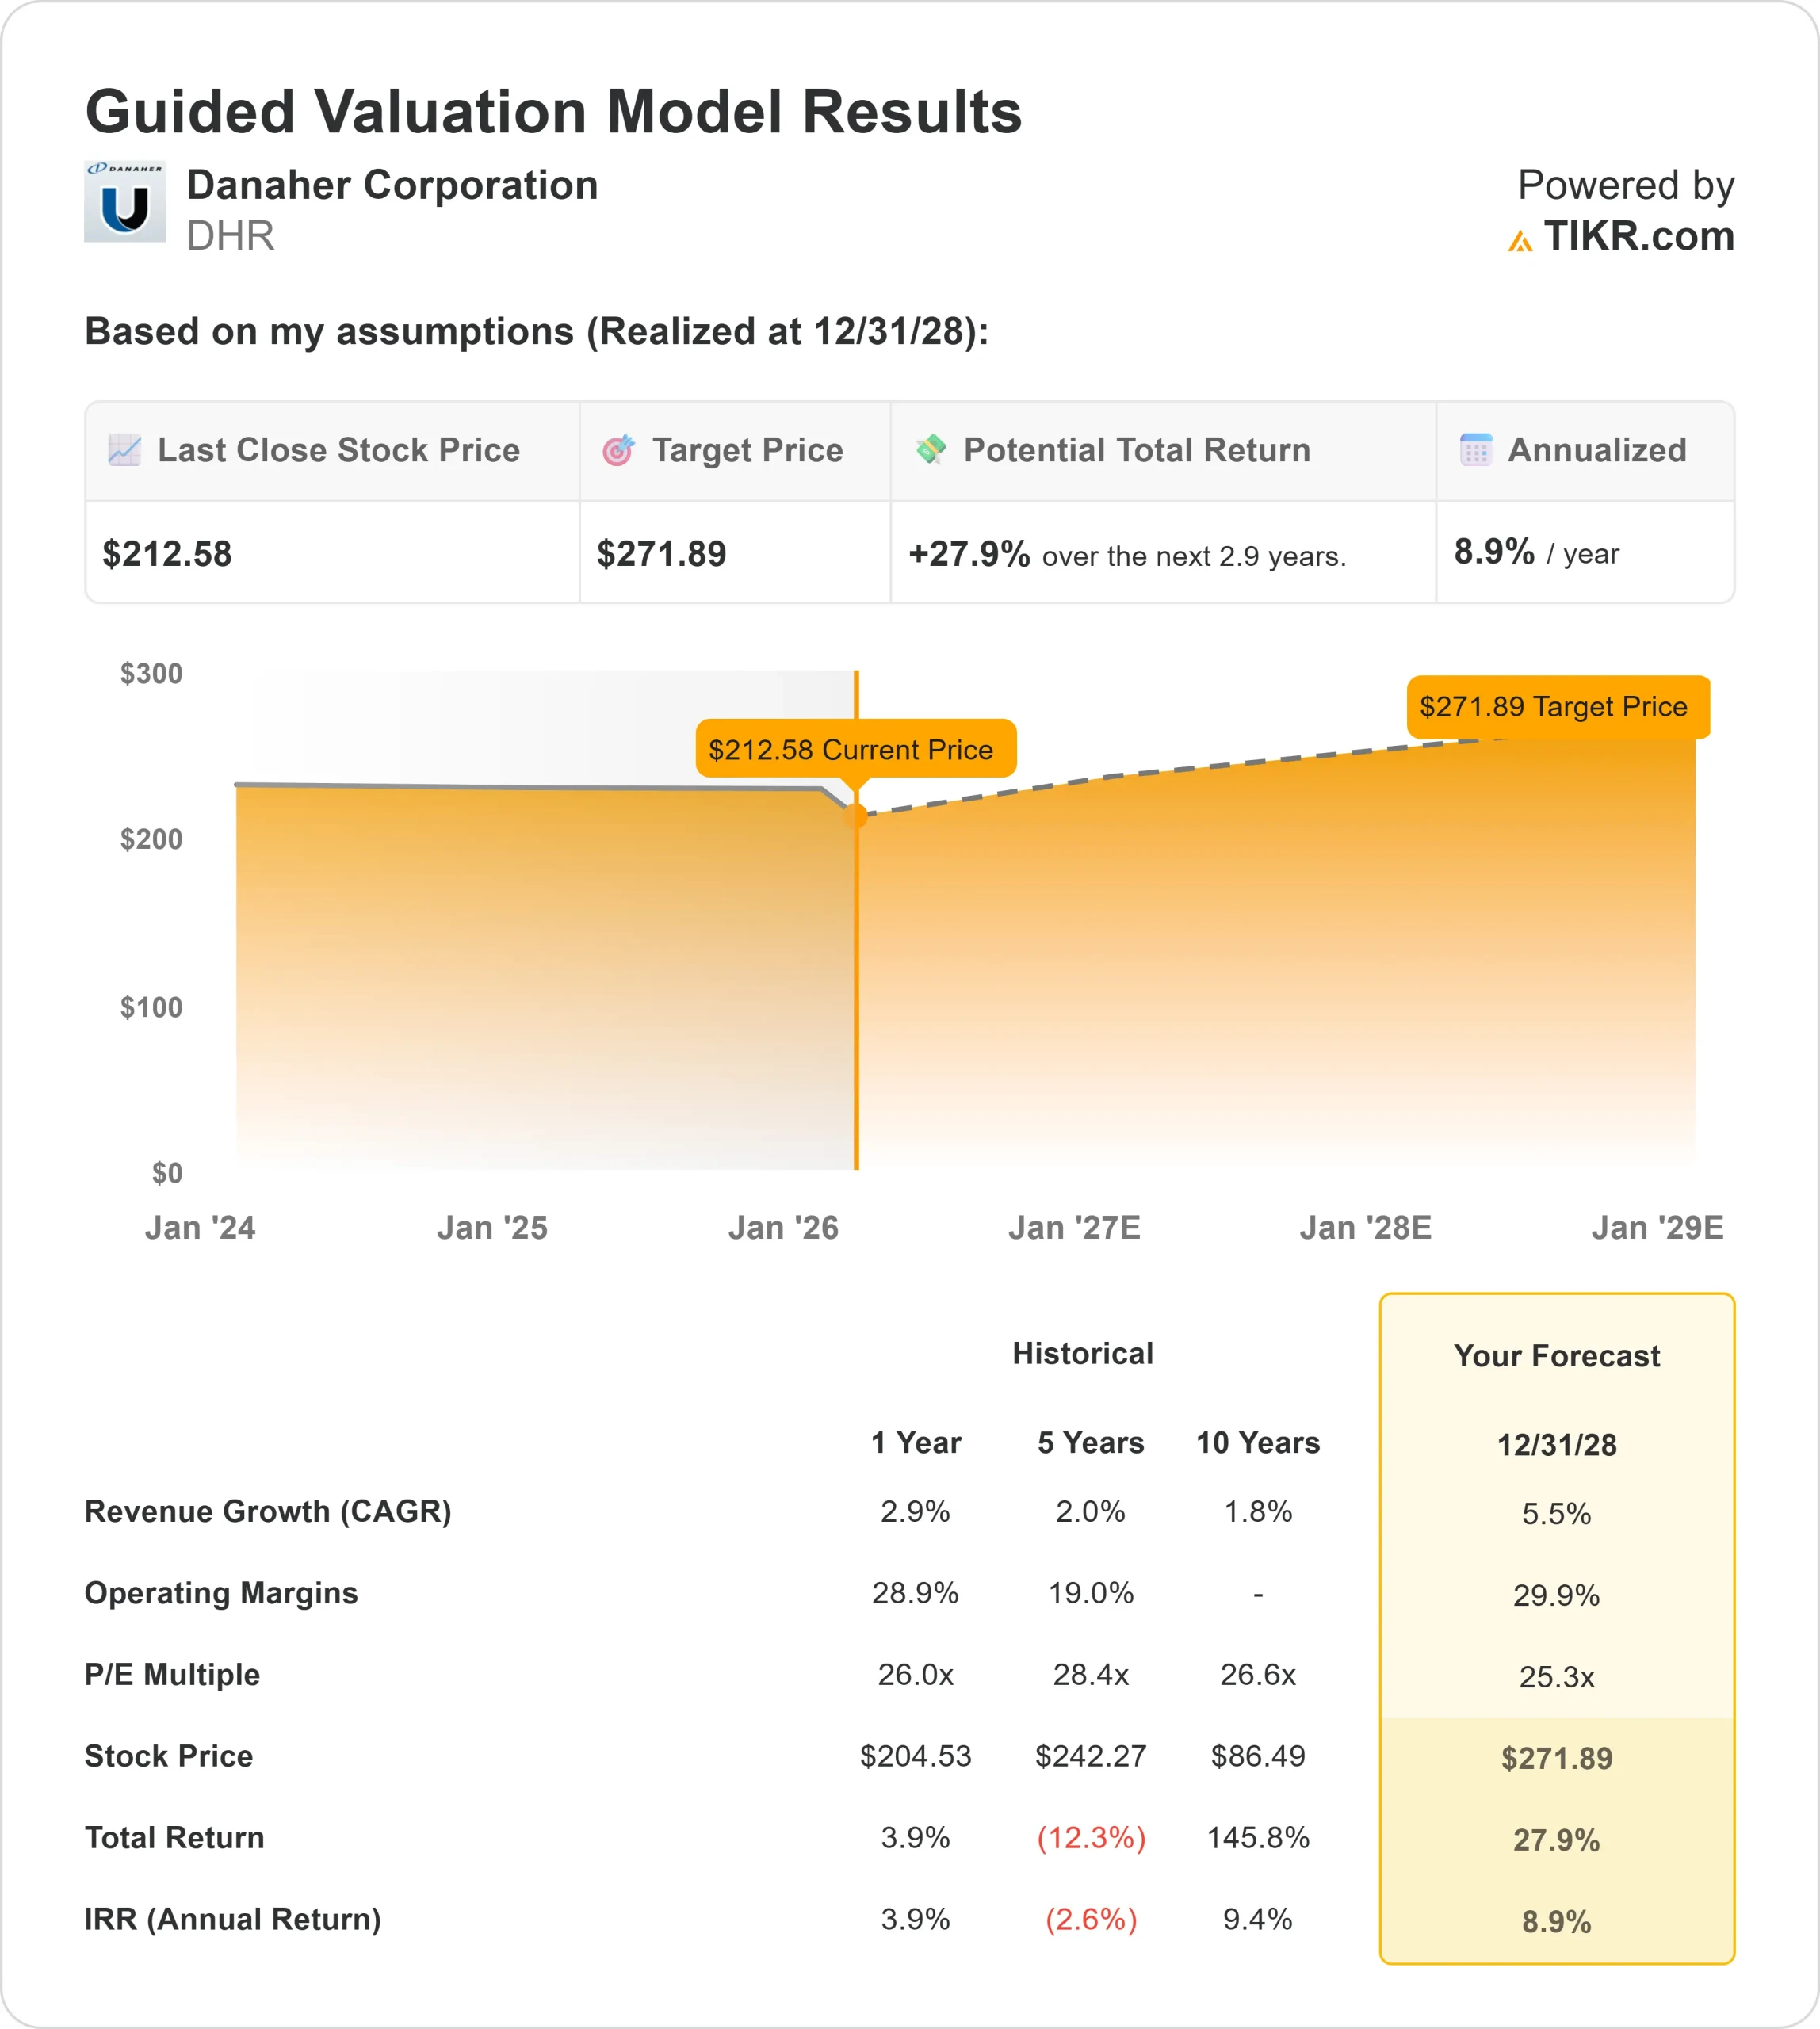
Under valuation assumptions, the stock is modeled using:
- Revenue Growth (CAGR): 5.5%
- Operating Margins: 29.9%
- Exit P/E Multiple: 25.3x
Revenue is projected to expand steadily through 2026 as bioprocessing demand remains resilient and equipment sales stabilize following a multi-year digestion cycle.
Growth is supported primarily by consumables tied to commercial biologics production rather than early-stage biotech demand, creating recurring revenue durability.

Approximately three-quarters of bioprocessing revenue is linked to commercial manufacturing volumes, which continue to benefit from strong monoclonal antibody production and expanding biologics approvals.
Equipment order improvement and gradual recovery in pharma research spending provide incremental upside beyond the base case.
Margin expansion remains the key earnings driver. Q4 adjusted gross margin was 58.2% and adjusted operating margin was 28.3%, allowing incremental revenue to translate efficiently into EPS growth.
Cost actions implemented in 2025 are expected to contribute approximately $0.30 to 2026 EPS, supporting operating leverage even if revenue growth remains moderate.
Based on these inputs, the model estimates a target price of $272 by 2026, implying approximately 27.9% upside from current levels.
At today’s price, Danaher appears undervalued, with future performance driven by recurring consumables strength, operating leverage, and continued normalization in life sciences demand rather than aggressive multiple expansion.
Estimate a company’s fair value instantly (Free with TIKR) >>>
Value Any Stock in Under 60 Seconds (It’s Free)
With TIKR’s new Valuation Model tool, you can estimate a stock’s potential share price in under a minute.
All it takes is three simple inputs:
- Revenue Growth
- Operating Margins
- Exit P/E Multiple
From there, TIKR calculates the potential share price and total returns under Bull, Base, and Bear scenarios so you can quickly see whether a stock looks undervalued or overvalued.
If you’re not sure what to enter, TIKR automatically fills in each input using analysts’ consensus estimates, giving you a quick, reliable starting point.
See a stock’s true value in under 60 seconds (Free with TIKR) >>>