
Key Stats for SPG Stock
- 6-Month Performance: 16%
- 52-Week Range: $136 to $203
- Valuation Model Target Price: $172
- Implied Upside: -15%
Value your favorite stocks like Simon Property Group with 5 years of analysts’ forecasts using TIKR’s new Valuation Model (It’s free) >>>
What Happened?
Simon Property Group has risen about 16% over the last six months, recently trading near $202 per share and approaching its $203 52 week high as investors responded to record earnings, resilient leasing demand, and clearer visibility into 2026 cash flow growth.
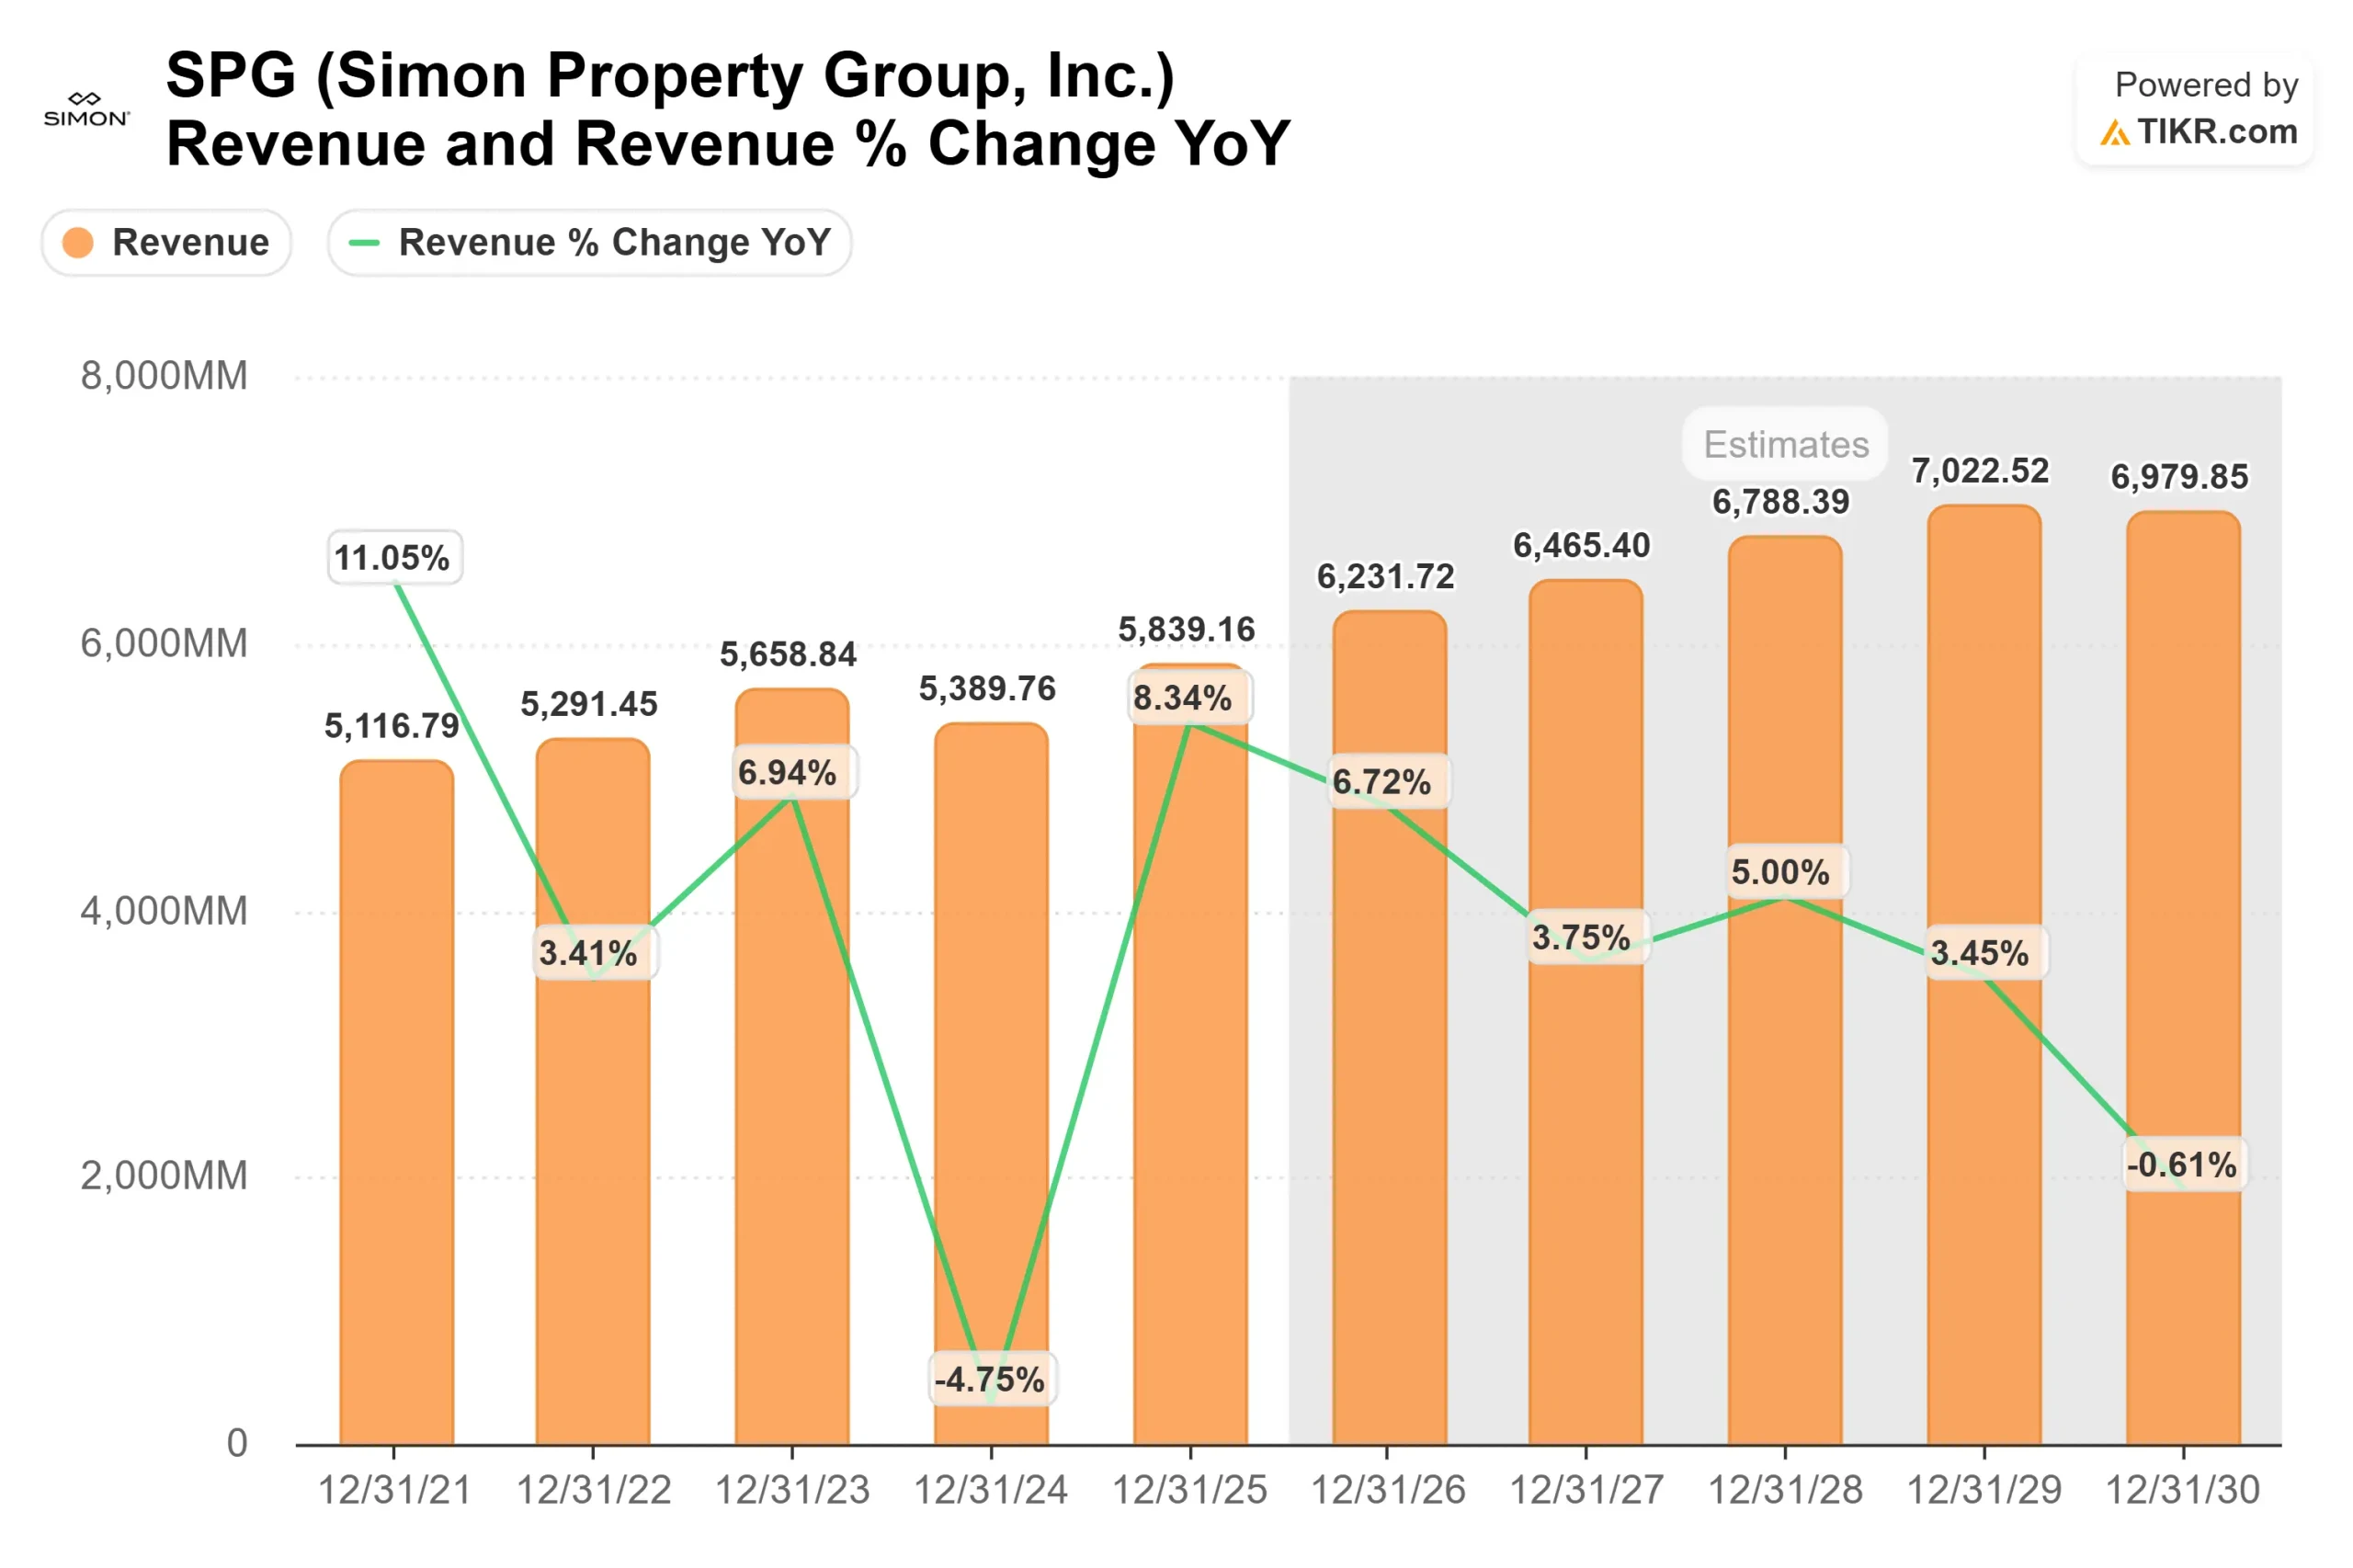
The stock moved higher because the company delivered record real estate FFO of $4.8 billion or $12.73 per share, with fourth quarter FFO increasing 4.2% year over year to $3.49 per share.
Domestic property NOI rose 4.8% in the quarter, portfolio NOI increased 5.1%, and occupancy ended the year at 96.4% for malls and premium outlets and 99.2% for Mills.
Management guided 2026 real estate FFO to $13 to $13.25 per share on at least 3% domestic NOI growth, reinforcing expectations for continued earnings expansion.
CEO David Simon said, “We delivered strong financial and operational results in the fourth quarter,” while highlighting approximately $2 billion of acquisitions, completion of more than 20 major redevelopment projects, and a development and redevelopment pipeline exceeding $4 billion.
The company ended the year with more than $9 billion of liquidity and net debt to EBITDA of 5.0x, declared a first quarter dividend of $2.20 per share up 4.8% year over year, and returned roughly $3.5 billion to shareholders through dividends and buybacks.
Institutional positioning remains supportive. Vanguard increased its stake by 1.8% to 46,683,502 shares valued at about $8.76 billion, NEOS Investment Management boosted its position by 79.8% to 71,823 shares worth approximately $13.48 million, and PNC Financial Services Group raised its stake by 5.1%.
While some firms reduced exposure, institutional ownership stands near 93%, reflecting continued long term conviction in the REIT’s earnings durability and redevelopment pipeline.

See analysts’ growth forecasts and price targets for Simon Property Group (It’s free) >>>
Is SPG Undervalued?
Under valuation assumptions, the stock is modeled using:
- Revenue Growth (CAGR): 5.1%
- Operating Margins: 54.4%
- Exit P/E Multiple: 23.7x
Revenue growth is expected to expand at a steady mid single digit pace, supported by positive leasing spreads, occupancy improvement, and mixed use redevelopment projects coming online over the next several years.
With retailer sales per square foot at $799 and total sales volumes growing 3% for the year, cash flow durability remains anchored by strong tenant productivity rather than aggressive expansion.
Based on these inputs, the model estimates a target price of $172, implying about -15% total downside from current levels near $202, suggesting the stock appears slightly overvalued at today’s price.
Performance in 2026 will depend on sustained leasing demand, occupancy gains across recently acquired assets, and the timing of redevelopment deliveries that are largely back end weighted.
Management is guiding to at least 3% domestic NOI growth, and upside could come from stronger tenant sales growth, incremental rent escalators, and higher productivity replacement tenants in backfilled anchor spaces.
At current levels, Simon Property Group reflects confidence in stable cash flow and dividend durability, with future returns tied more to leasing execution, redevelopment yield realization, and disciplined capital allocation than to rapid revenue acceleration.
Estimate a company’s fair value instantly (Free with TIKR) >>>
Value Any Stock in Under 60 Seconds (It’s Free)
With TIKR’s new Valuation Model tool, you can estimate a stock’s potential share price in under a minute.
All it takes is three simple inputs:
- Revenue Growth
- Operating Margins
- Exit P/E Multiple
From there, TIKR calculates the potential share price and total returns under Bull, Base, and Bear scenarios so you can quickly see whether a stock looks undervalued or overvalued.
If you’re not sure what to enter, TIKR automatically fills in each input using analysts’ consensus estimates, giving you a quick, reliable starting point.
See a stock’s true value in under 60 seconds (Free with TIKR) >>>