Key Stats for RTX Corporation
- 52-Week Range: $143.56 to $214.50
- Current Price: $193.39
- Street Mean Target: $215.14
- Market Cap: ~$263 billion
- Q1 2026 Adjusted Revenue: $22.1 billion, up 10% organically YoY
- Q1 2026 Adjusted EPS: $1.78, up 21% YoY
- Q1 2026 Free Cash Flow: $1.3 billion, up 65% YoY
- Record Backlog: $271 billion
- FY2026 Adjusted EPS Guidance: $6.70 to $6.90
Value your favorite stocks like RTX with 5 years of analysts’ forecasts using TIKR >>>
RTX Beat Estimates by 18% and the Stock Still Fell. Here’s Why.
RTX Corporation( RTX), the aerospace and defense conglomerate behind Pratt & Whitney jet engines, Collins Aerospace avionics, and Raytheon missile systems, reported one of its strongest quarters in recent memory on April 21.
Adjusted EPS of $1.78 beat consensus by around 18%, revenue of $22.1 billion came in ahead of expectations, and management raised full-year guidance. The backlog hit a record $271 billion, split between $162 billion in commercial work and $109 billion in defense contracts, giving the company visibility that most businesses can only dream about.

The drawdown chart tells you why investors are frustrated. RTX held near its highs through January and into February, then began sliding in two distinct waves. The first drop took the stock to around -12% in March. A brief recovery in April gave way to a second, deeper leg lower, with the max drawdown of 19% hitting on May 15, nearly a month after a strong earnings report. Two things drove that disconnect.
First, tariff concerns weighed on the commercial aerospace supply chain, with management acknowledging headwinds on the Q1 call.
Second, potential litigation risk around Pratt & Whitney engine issues, including reports that ITA Airways was evaluating legal action over engine groundings, added uncertainty that overshadowed the otherwise solid numbers. The stock has since recovered to around -7.6% from its highs as those fears have partially faded.
See analysts’ growth forecasts and price targets for RTX (It’s free) >>>
The Free Cash Flow Jump Is the Number That Matters Most
RTX is not a high-growth business in the traditional sense. Revenue grows at mid-to-high single digits, and the real story is less about the top line and more about how efficiently the company converts that revenue into cash.
Pratt & Whitney, which makes the engines powering a significant portion of the global commercial aircraft fleet, generates substantial aftermarket revenue as airlines pay for maintenance, repairs, and overhauls throughout each engine’s life.
Collins Aerospace similarly earns recurring revenue from avionics and aircraft systems. Raytheon, the defense arm, benefits from a sustained cycle of global rearmament as NATO allies and U.S. allies in Asia accelerate procurement of missiles, radars, and air defense systems.
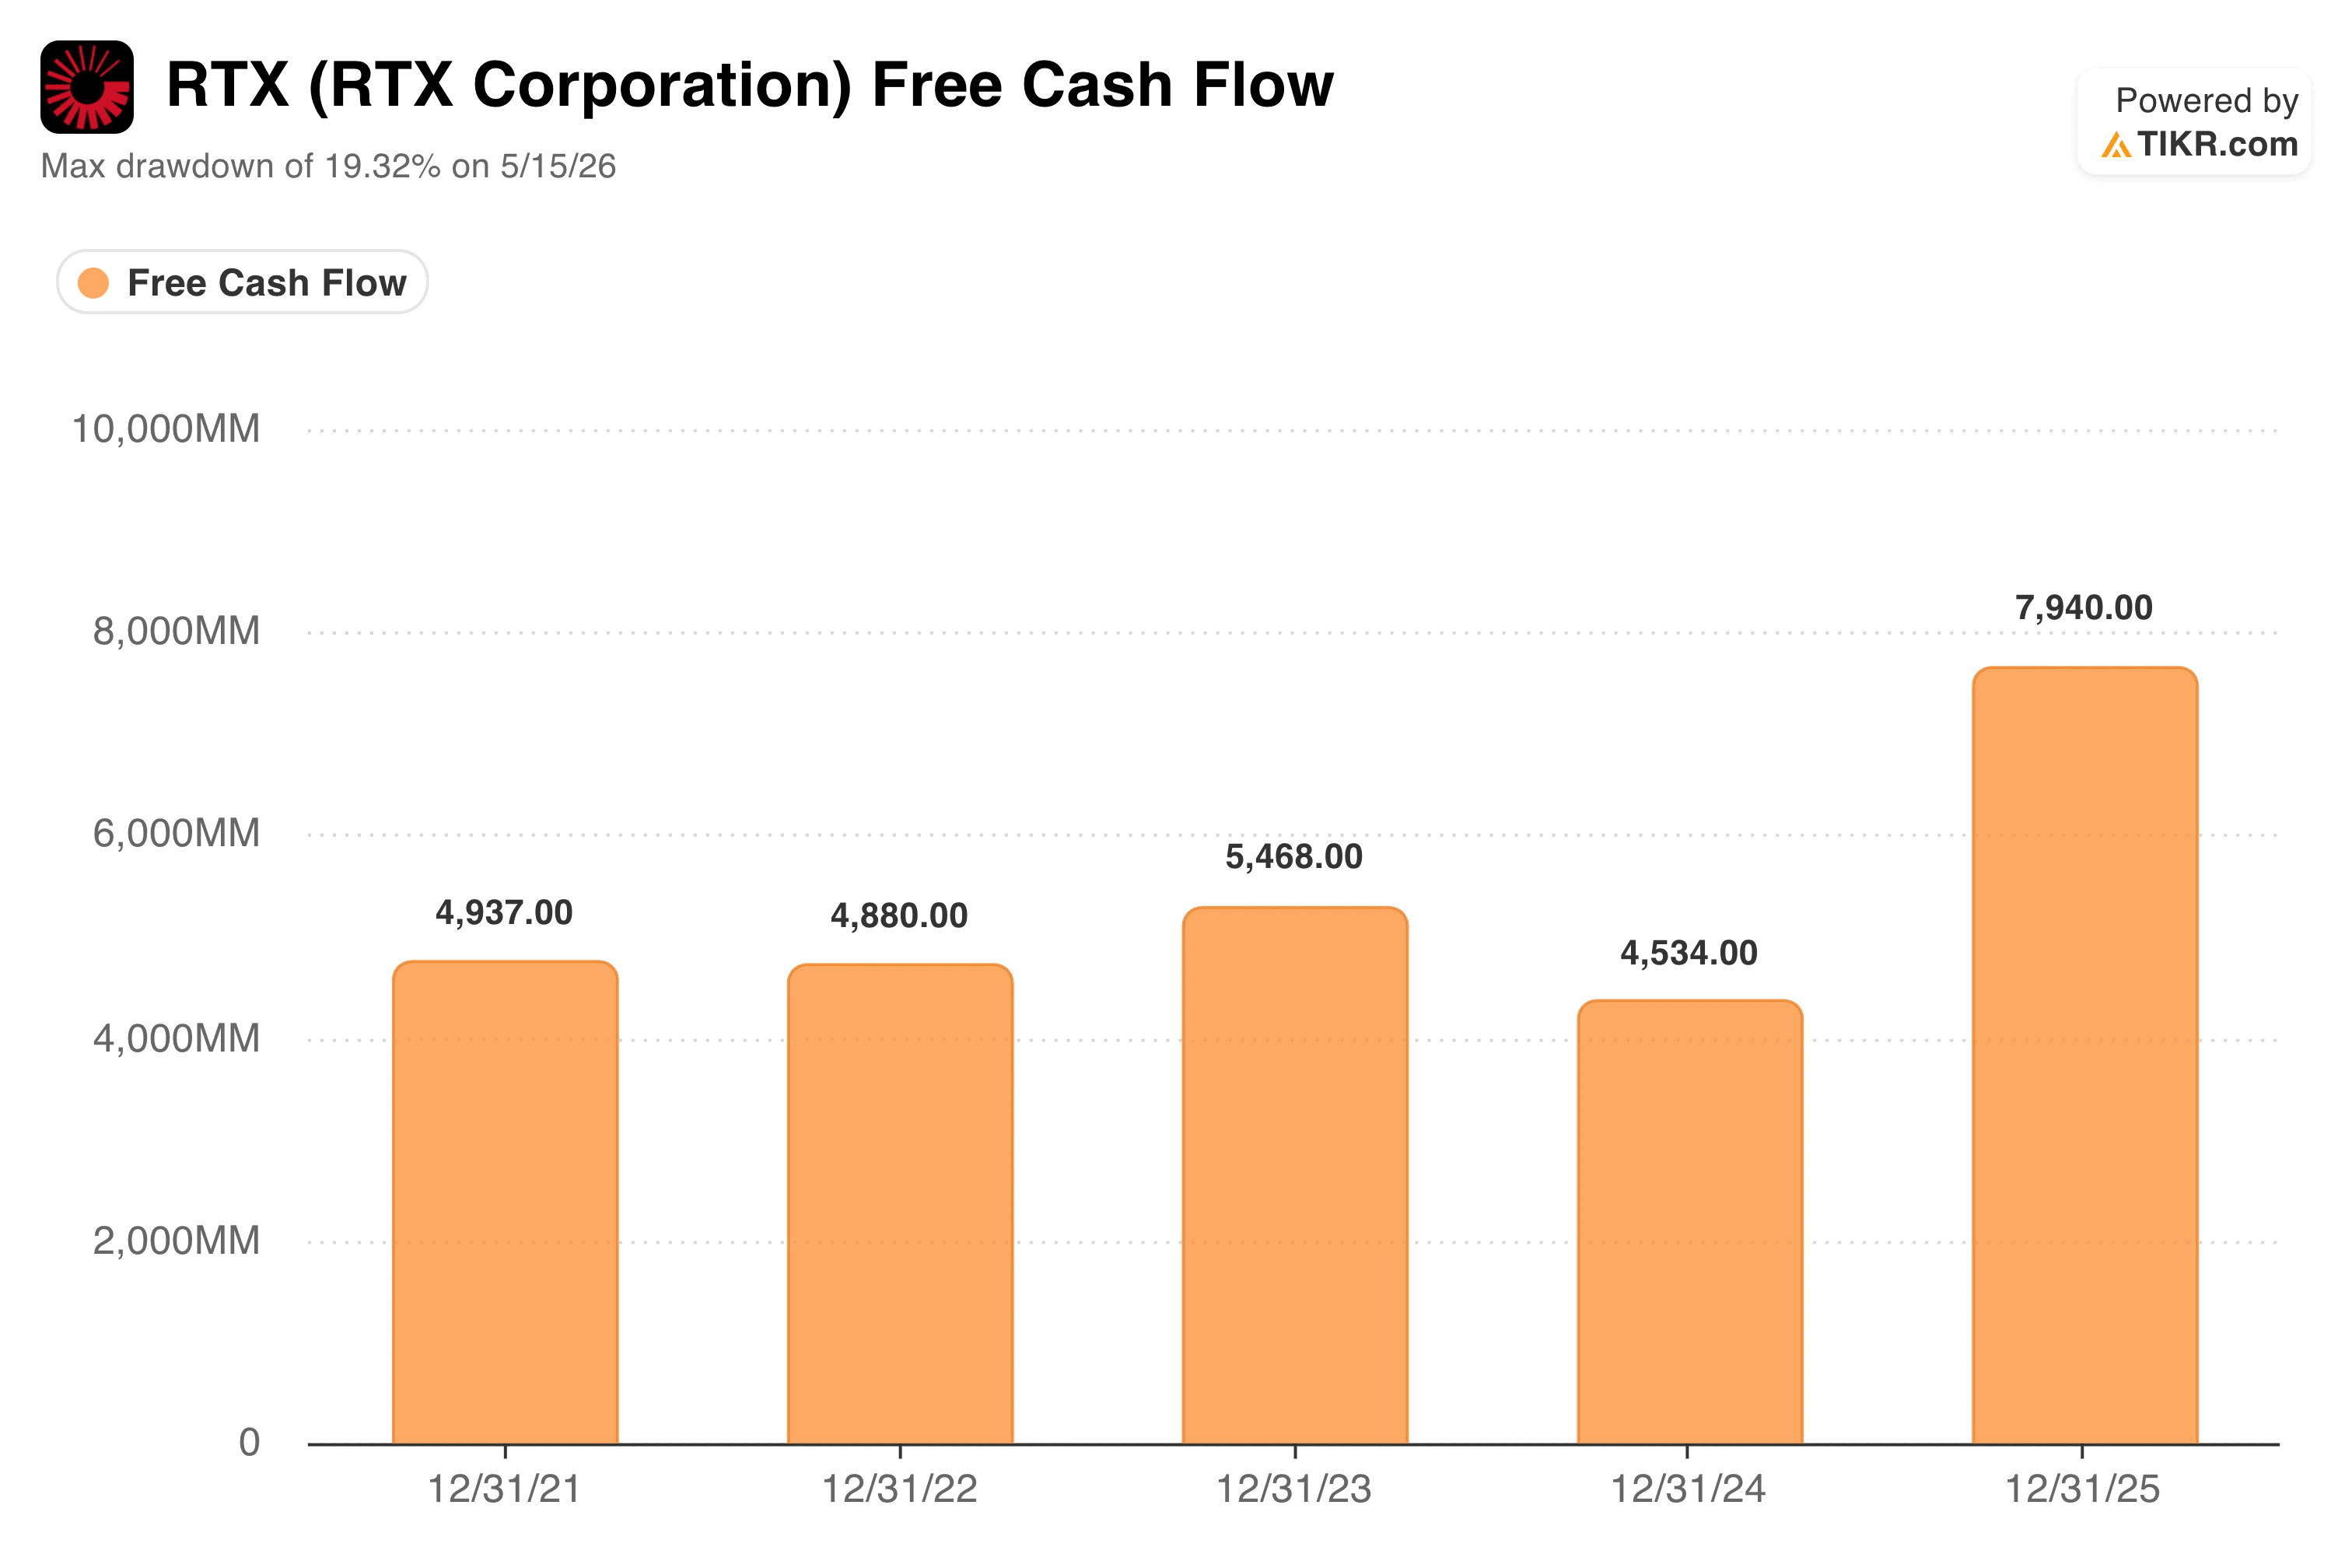
The free cash flow chart clearly captures the inflection. FCF held in a relatively tight range between $4.5 and $5.5 billion from 2021 through 2023, dipped to $4.5 billion in 2024 as Pratt & Whitney absorbed costs related to its GTF engine inspections, then surged to nearly $8 billion in 2025 as those headwinds resolved and operating leverage kicked in.
Management has guided for $8.25 to $8.75 billion in free cash flow for the full-year 2026, which would represent another step up. For a company returning capital through both dividends and buybacks, that trajectory matters directly to shareholders.
See what RTX’s $7.9 billion in free cash flow means for the stock now >>>
What Does the Valuation Model Say?
RTX is not a stock you buy for explosive upside. At around $196, the stock already reflects a fair amount of the defense spending cycle, and the TIKR valuation model is worth reading with that in mind.

The mid case arrives at a target of around $219 by the end of 2030, implying roughly 12% total return from today’s price, or about 3% annualized over 4.5 years. The extended forecast through December 2034 points to around $274, implying roughly a 40% total return at an annualized rate of 4%.
The model assumes around 5% annual revenue growth and net income margins expanding toward 11%, which is consistent with what RTX has historically delivered. The honest read here is that the model does not suggest RTX is deeply undervalued at current prices.
The Street target of around $215 implies more near-term upside than the model’s mid case, reflecting analyst optimism around the defense spending cycle and continued FCF growth.
Should You Invest in RTX Corporation?
RTX is the kind of stock that rewards patience over excitement. The backlog is at a record high, free cash flow has taken a meaningful step up, and the global defense spending environment remains as supportive as it has been in decades.
The valuation model’s modest annualized return reflects a fairly priced business, not obviously cheap. Investors who want steady compounding, a dividend, and real exposure to both commercial aerospace and global defense demand will find RTX a reasonable fit.
Compare RTX’s operating margin trajectory against defense-sector peers on TIKR >>>
Looking for New Opportunities?
- See what stocks billionaire investors are buying so you can follow the smart money.
- Analyze stocks in as little as 5 minutes with TIKR’s all-in-one, easy-to-use platform.
- The more rocks you overturn… the more opportunities you’ll uncover. Search 100K+ global stocks, global top investor holdings, and more with TIKR.
Disclaimer:
Please note that the articles on TIKR are not intended to serve as investment or financial advice from TIKR or our content team, nor are they recommendations to buy or sell any stocks. We create our content based on TIKR Terminal’s investment data and analysts’ estimates. Our analysis might not include recent company news or important updates. TIKR has no position in any stocks mentioned. Thank you for reading, and happy investing!