Key Stats for RTX Stock
- Past week’s performance: 3.4%
- 52-week range: $143 to $215
- Valuation model target price: $155
- Implied upside: 7.5% over the next 2.5 years
Value your favorite stocks like RTX with 5 years of analysts’ forecasts using TIKR >>>
A Navy Missile Win, a Q1 Beat, and the Iran Ceasefire Overhang
RTX Corporation (RTX) had a week shaped by fresh contract news and lingering sector pressure. On June 26, Raytheon won a $1.1 billion U.S. Navy contract for AIM-9X Block II Sidewinder missiles. The AIM-9X is a short-range air-to-air missile used across multiple U.S. and allied fighter platforms. That contract adds directly to Raytheon’s backlog and reflects the Pentagon’s push to replenish weapons inventories.

The operating backdrop remains strong. RTX beat Q1 revenue estimates and raised its full-year outlook in April, with adjusted EPS rising 21% to $1.78 against a consensus estimate of $1.52. Net sales climbed 9% to $22.1 billion. Management raised both profit and revenue guidance for the full year, citing strong demand across Raytheon missiles, Collins Aerospace avionics, and Pratt and Whitney engines.
The complicating factor this week was sector pressure from the Iran war ceasefire. U.S. defense contractors fell as the conflict wound down, since investors who had bought defense stocks as a geopolitical hedge reduced exposure. But RTX’s business model is not a pure conflict play.
Its backlog of $271 billion, presented at the Bernstein conference in late May, is driven by NATO ally orders, U.S. base defense spending, and long-term platform programs that persist regardless of any single conflict’s resolution. A ceasefire in Iran does not cancel Patriot missile orders from Germany, Australia SeaRAM contracts, or the $6.6 billion F135 engine production contract Pratt won in March.
Going forward, RTX stock will be watched for whether the ceasefire-related sector selling creates a re-entry point or whether the current multiple is simply too high to justify as the geopolitical premium deflates.
See analysts’ growth forecasts and price targets for RTX (It’s free) >>>
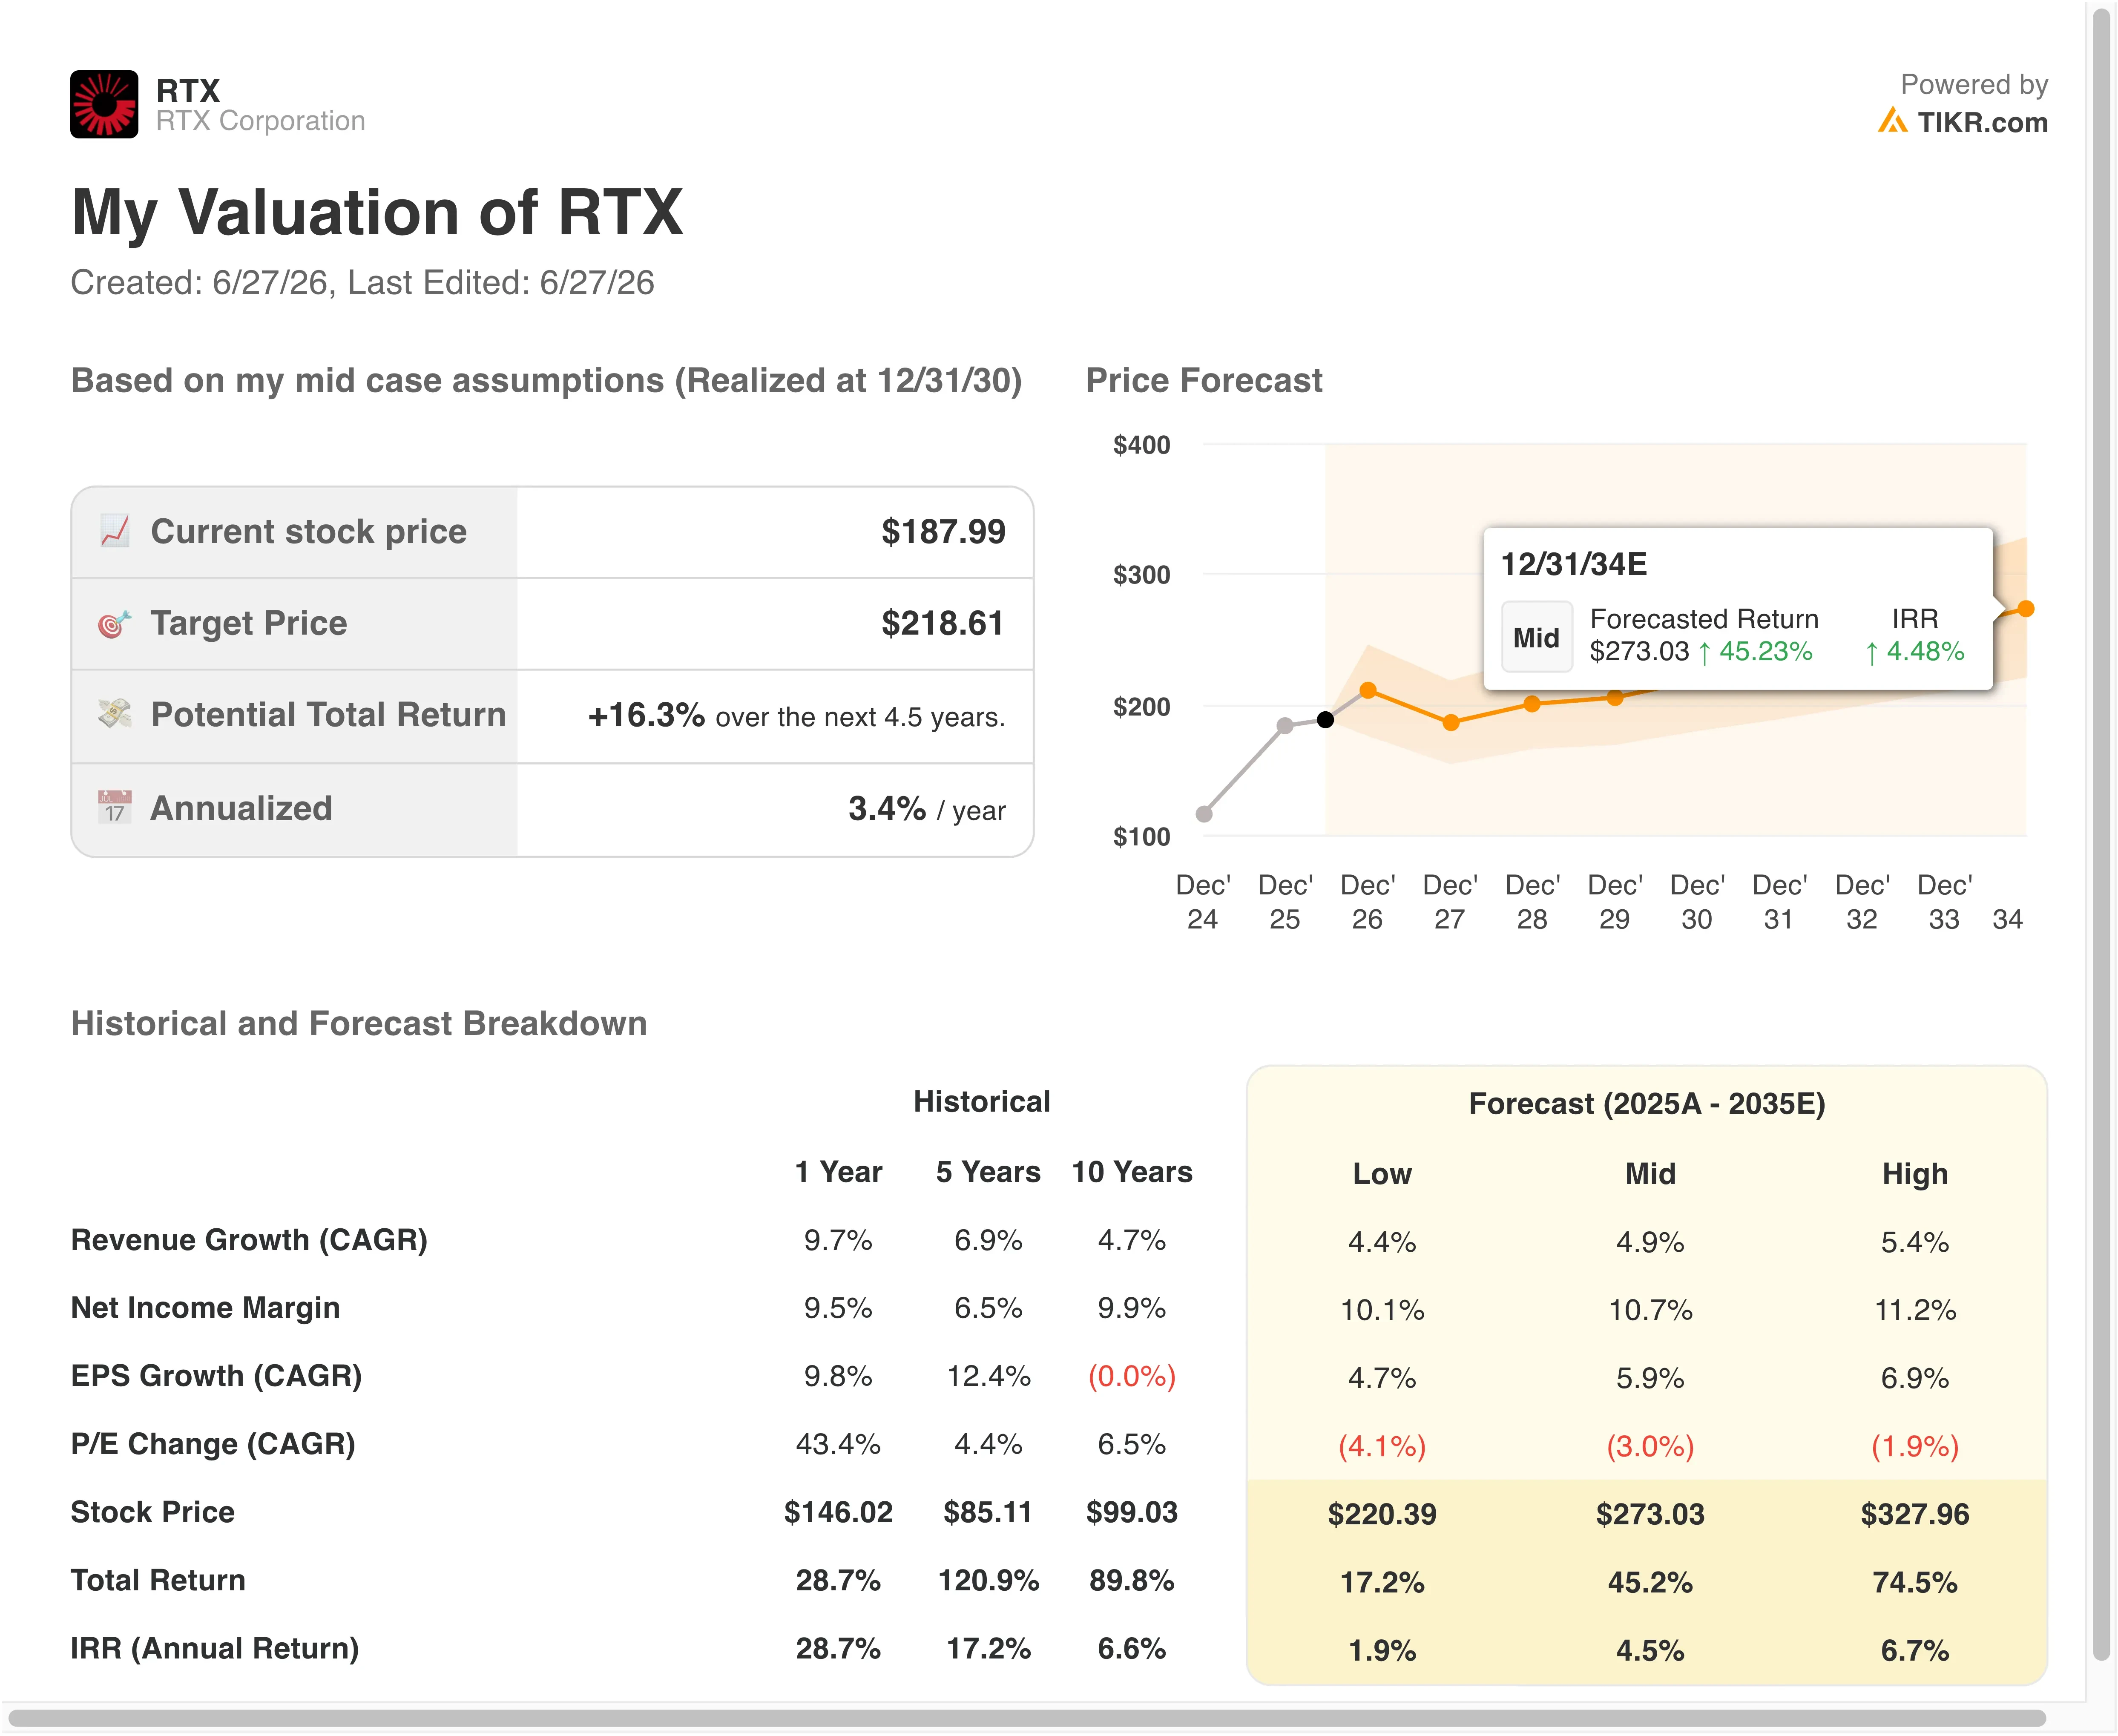
What the Valuation Model Says About RTX at $188

Under valuation model assumptions realized through 12/31/28, the stock is modeled using:
- Revenue Growth (CAGR): 6.6%
- Operating Margins: 13.7%
- Exit P/E Multiple: 21.7x
Based on these inputs, the model estimates a target price of $202, implying 7.5% total upside from the current share price of $188 and an annualized return of 2.9% over the next 2.5 years.
A 2.9% annualized return is the most honest signal this week. At current prices, RTX is priced close to fair value and offers limited return above what a treasury bond delivers. That is not a condemnation of the business, which is executing well. It reflects the reality that the stock has run hard on defense tailwinds and now sits at a NTM P/E of 27.2x, elevated relative to RTX’s own 5-year average of roughly 20.8x.
The 6.6% revenue CAGR is consistent with RTX’s historical 1-year growth of 9.7% and aligns with the forward 2-year consensus CAGR of 6.6%. The 13.7% operating margin assumption reflects modest improvement from the LTM EBIT margin of 12%, driven by Pratt’s GTF engine recovery and Collins Aerospace mix improvement. The 21.7x exit P/E assumes meaningful multiple compression from today’s level, which is the right conservative assumption.
However, it makes total return highly sensitive to whether current valuation levels are sustainable through the next earnings cycle. The street target of $216 implies about 15% upside, which is more optimistic than the model. The gap suggests analysts are applying less multiple compression in their assumptions, possibly because they expect the defense budget cycle to keep valuation elevated longer than the model allows.
Compare RTX’s operating margin trajectory against defense-sector peers on TIKR >>>
RTX Against Lockheed Martin and Northrop Grumman
RTX is the most diversified of the major U.S. defense primes. Lockheed Martin (LMT) trades at a lower P/E but is more concentrated in fighter aircraft programs, particularly the F-35. RTX’s Pratt division powers the F-35 through the F135 engine contract, so RTX benefits from F-35 deliveries without carrying the full airframe risk. Lockheed’s operating margins are structurally higher than RTX’s, but its backlog growth has been more modest in recent quarters as F-35 production timelines stretch.

Northrop Grumman (NOC) reported higher revenue in Q1 on rising global conflicts and is more exposed to space-based systems and long-range strike. Northrop’s B-21 Raider bomber program provides a long-duration revenue anchor. RTX’s LTM EBIT margin of 12% compares favorably to Northrop’s profile, and RTX’s dividend yield of 1.5% is comparable, while its 50.3% payout ratio leaves more room for growth than Lockheed’s tighter capital return structure.
The competitive advantage RTX holds that neither Lockheed nor Northrop replicates is the Collins Aerospace commercial aviation business. Collins provides avionics, seats, and connectivity systems to virtually every major commercial airline and aircraft manufacturer in the world. That gives RTX a revenue stream correlated with air traffic rather than defense budgets alone, providing a partial natural hedge that its pure-defense peers lack.
See what RTX’s $7.9 billion in free cash flow means for the stock now >>>
What’s Driving RTX Stock Going Forward?
The Q2 earnings report, expected July 21, is the next event that could move the stock meaningfully. Investors will look for whether management formalizes a further guidance raise following the strong Q1. Whether Raytheon’s production ramp on Patriot, AIM-9X, and SPY-6 radar programs is on schedule is equally important.
European NATO spending is a structural tailwind that will persist independent of the Iran situation. RTX’s Raytheon was selected to provide SeaRAM for Australia’s new Mogami-class frigates, and the Netherlands awarded a $627 million Patriot air defense contract. RTX also signed a $3.7 billion deal to supply Patriot missiles to Ukraine, funded by Germany. These orders add to a backlog that already totaled $271 billion as of the Bernstein presentation.
Pratt and Whitney’s GTF engine recovery is the most important margin lever within RTX. Each quarter of smoother GTF deliveries improves RTX’s Pratt margin, which is the segment most depressed relative to its long-run potential.
RTX’s $100 million Poland investment to expand GTF MRO capacity and the GTF Advantage’s EASA certification in April signal that the production and certification path is clearing. The GTF Advantage earned European aviation authority approval for the Airbus A320neo family, which opens new delivery streams and reduces the inspection overhang that weighed on Pratt revenue in prior quarters.
Finally, the capital return program reinforces the investment case for income-oriented investors. RTX raised its quarterly dividend to $0.73 per share in May and declared that same dividend for Q2 this week. Combined with ongoing buybacks, RTX’s total capital return program is meaningful for a stock that currently offers modest price appreciation upside but a reliable and growing income stream.
See RTX’s full backlog history and earnings estimate trajectory on TIKR (Free) >>>
Should You Invest in RTX?
The only way to really know is to look at the numbers yourself. TIKR gives you free access to the same institutional-quality financial data that professional analysts use to answer exactly that question.
Pull up RTX, and you’ll see years of historical financials, what Wall Street analysts expect for revenue and earnings in the quarters ahead, how valuation multiples have moved over time, and whether price targets are trending up or down.
You can build a free watchlist to track RTX alongside every other stock on your radar. No credit card required. Just the data you need to decide for yourself.
Model your own General Electric earnings scenario for Q2 and beyond on TIKR→
Looking for New Opportunities?
- See what stocks billionaire investors are buying so you can follow the smart money.
- Analyze stocks in as little as 5 minutes with TIKR’s all-in-one, easy-to-use platform.
- The more rocks you overturn… the more opportunities you’ll uncover. Search 100K+ global stocks, global top investor holdings, and more with TIKR.
Disclaimer:
Please note that the articles on TIKR are not intended to serve as investment or financial advice from TIKR or our content team, nor are they recommendations to buy or sell any stocks. We create our content based on TIKR Terminal’s investment data and analysts’ estimates. Our analysis might not include recent company news or important updates. TIKR has no position in any stocks mentioned. Thank you for reading, and happy investing!