
Key Stats for ODD Stock
- Past week performance: +9.9%
- 52-week range: $9 to $64
- Valuation model target price: $18
- Implied upside: +21.5% over 2.3 years
Build a full valuation model for ODD in under 60 seconds (Free with TIKR) >>>
A Rough Quarter, and the Repair Job Underway
Oddity Tech (ODD) is trying to rebuild investor trust after a first quarter that missed on nearly every line. Revenue fell 26% year over year to $197.9 million, and the beauty e-commerce company swung to a net loss of $21.4 million. First orders, the metric that tracks new customer sign-ups, dropped roughly 50% from a year earlier. Gross margins slipped too, as the company leaned harder on promotions to keep customers coming back.

The root cause was technical, not strategic. Oddity’s ad account with its largest advertising partner hit a snag that drove up customer acquisition costs and throttled new-customer growth. Management has guided for Q2 to look similarly weak, and analysts currently expect revenue of $174.8 million, down 27.5% from a year ago, alongside adjusted earnings per share near $0.12, a drop of roughly 87%.
Even so, there were small signs of progress buried in the numbers. CEO Oran Holtzman told investors on the Q1 call, “We remain hopeful that we will return to normalization in the second half,” pointing to a 28% sequential improvement in customer acquisition costs at IL MAKIAGE, Oddity’s flagship brand, during May.
While the core business works through its ad issues, the board has moved to shore up confidence elsewhere. It expanded the share buyback authorization to as much as $200 million and added David S. Cohen, a former Morgan Stanley investment management executive, as an independent director.
If ODD stock is going to hold this week’s rebound, September’s Q2 report needs to show first orders stabilizing and customer costs trending down, not just management hoping for it.
Set up your own return targets for Oddity’s next few quarters with TIKR (It’s free) >>>
Is ODD Stock Undervalued?
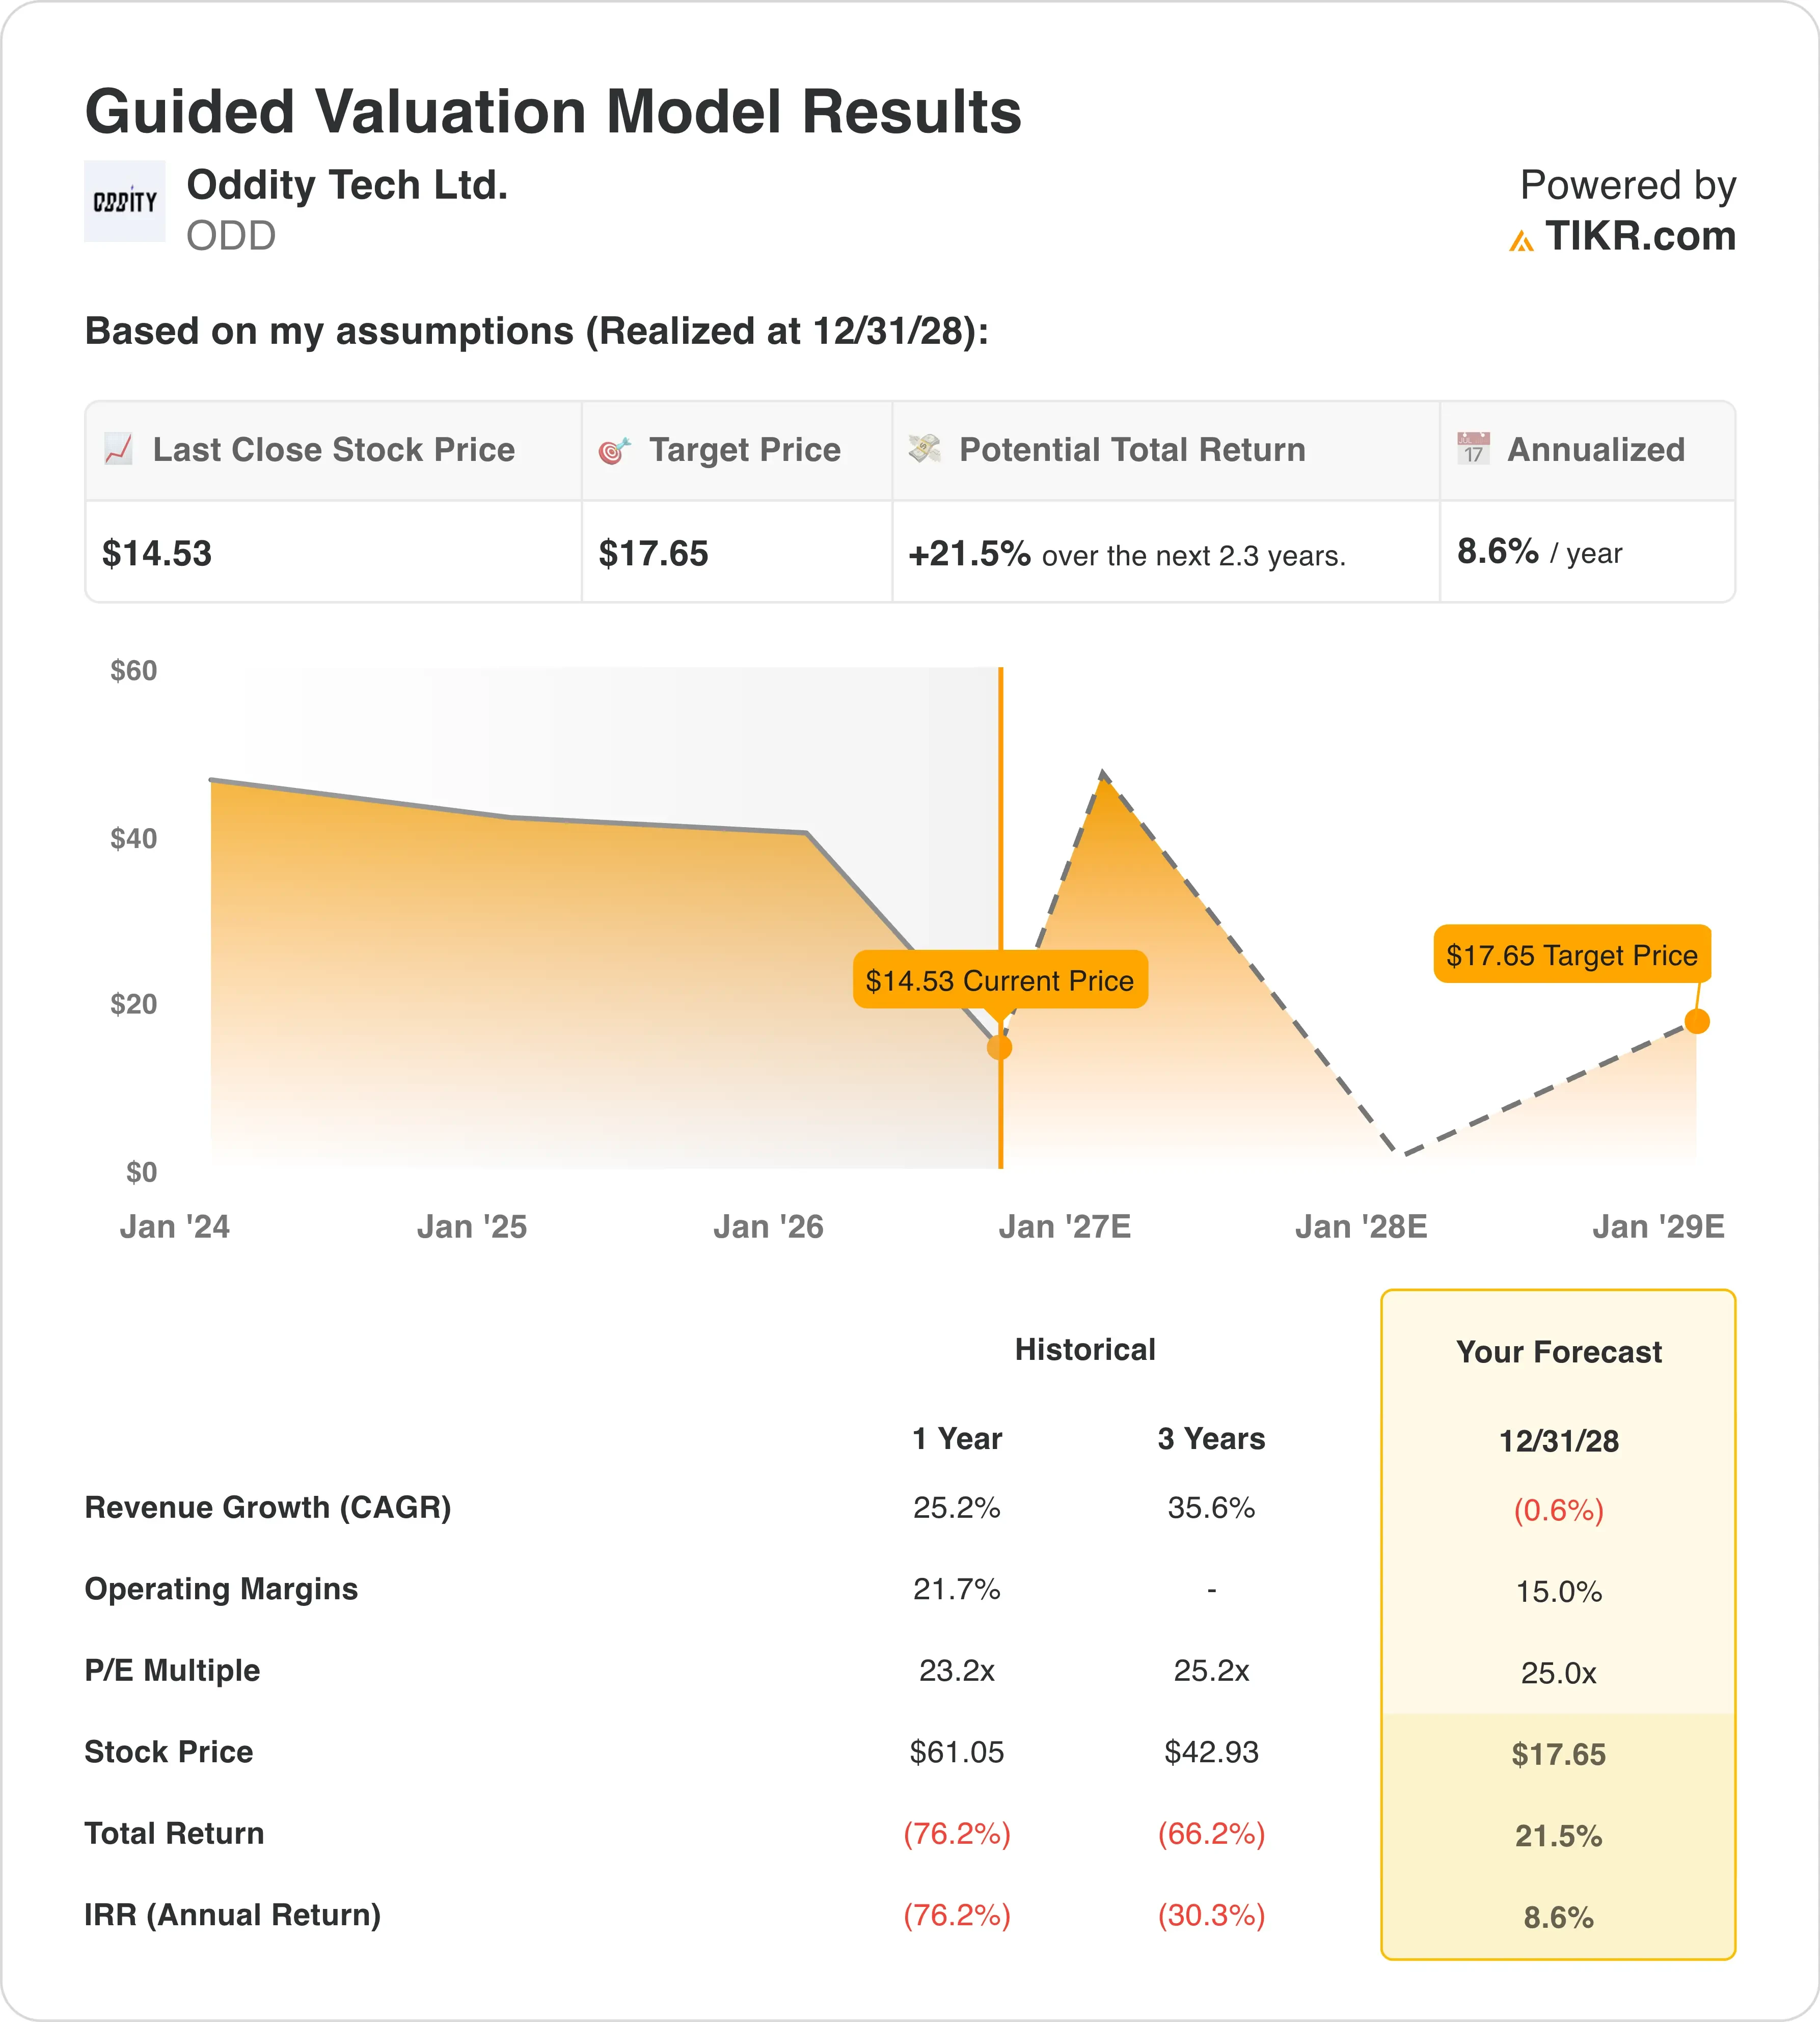
Under valuation model assumptions realized through 12/31/28, the stock is modeled using:
- Revenue Growth (CAGR): -0.6%
- Operating Margins: 15.0%
- Exit P/E Multiple: 25.0x
Based on these inputs, the model estimates a target price of $18, implying a 21.5% total return from the current share price and an annualized return of 8.6% over the next 2.3 years.
That annualized figure sits below the 10% bar that typically separates an attractive setup from a mediocre one, and it reflects a model that assumes revenue keeps shrinking rather than recovering. Because the market has already priced in a rough couple of quarters, the stock trades far below its own recent history. Just a year ago, shares changed hands near $61.

The 25x exit multiple also looks conservative next to e.l.f. Beauty, which trades closer to 29x forward earnings despite growing revenue more than 30% over the trailing twelve months. Ulta Beauty (ULTA), a more mature comparison, trades around 18.6x forward earnings on operating margins near 12.4%. Oddity’s own margin assumption of 15.0% would actually put it ahead of Ulta on profitability, but only if the growth story stabilizes first.
So the valuation case hinges less on the multiple and more on execution. If first orders recover the way management expects in the back half of the year, the current price could look cheap in hindsight. If the advertising issue drags on, even a 25x multiple may prove generous.
Estimate a company’s fair value instantly (Free with TIKR) >>>
Where Oddity Tech Stands Against e.l.f. Beauty and Ulta Beauty
Oddity built its reputation on AI-driven customer acquisition and a virtual try-on model that made it one of the fastest-growing names in beauty. That growth engine has stalled for now, and the contrast with peers is stark. e.l.f. Beauty (ELF) grew revenue more than 30% over the past twelve months and trades at roughly 29x forward earnings, a premium that reflects sustained momentum.

Ulta Beauty (ULTA), the specialty retailer, posted 9.7% revenue growth in its latest fiscal year and carries an operating margin near 12.4%, well below Oddity’s model assumption of 15.0% but supported by a much larger, more diversified store footprint.
Oddity’s moat has always been its data-driven marketing engine and direct relationship with customers through IL MAKIAGE, SpoiledChild, and its newer METHODIQ brand. That moat is exactly what got disrupted this quarter, since the ad account issue sits at the center of the customer acquisition funnel the whole business depends on. Until Oddity proves that funnel is fixed, comparisons to faster-growing peers like e.l.f. will keep working against the stock rather than for it.
What’s Driving ODD Stock Going Forward?
The next real test comes on September 9, when Oddity reports Q2 results and hosts its earnings call. Investors will be watching whether the improvement in customer acquisition costs seen in May carried through the rest of the quarter, since that single metric determines how quickly first orders can recover.
Beyond the ad issue, management continues to invest in ODDITY Labs, the company’s internal research arm exploring new formulations, including potential peptide-based products. A successful launch here could diversify revenue away from the core IL MAKIAGE brand, which still drives the majority of sales.
The $200 million buyback authorization also matters. If shares stay depressed while the company generates cash, continued repurchases could support the stock even before revenue trends improve. Meanwhile, Oddity’s addition to several Russell indexes in June should gradually widen its shareholder base as more index funds and institutional investors take positions.
Because the timeline for recovery is now “second half of 2026” by management’s own framing, the next two quarterly reports carry outsized weight. A clean Q2 print with improving first-order trends would go a long way toward validating the buyback and the board’s vote of confidence.
Estimate a company’s fair value instantly (Free with TIKR) >>>
Should You Invest in Oddity Tech?
The only way to really know is to look at the numbers yourself. TIKR gives you free access to the same institutional-quality financial data that professional analysts use to answer exactly that question.
Pull up ODD, and you’ll see years of historical financials, what Wall Street analysts expect for revenue and earnings in the quarters ahead, how valuation multiples have moved over time, and whether price targets are trending up or down.
You can build a free watchlist to track ODD alongside every other stock on your radar. No credit card required. Just the data you need to decide for yourself.
Analyze ODD stock on TIKR Free→
Disclaimer:
Please note that the articles on TIKR are not intended to serve as investment or financial advice from TIKR or our content team, nor are they recommendations to buy or sell any stocks. We create our content based on TIKR Terminal’s investment data and analysts’ estimates. Our analysis might not include recent company news or important updates. TIKR has no position in any stocks mentioned. Thank you for reading, and happy investing!