
Key Stats for Williams Companies Stock
- Price change for Williams Companies stock in last 1 year: 29%
- $WMB Stock Price as of Aug. 26: $74
- 52-Week High: $80
- $WMB Stock Price Target: $85
Now Live: Discover how much upside your favorite stocks could have using TIKR’s new Valuation Model (It’s free)>>>
What Happened?
Williams Companies (WMB) stock rose sharply on August 26, gaining as much as 5% and touching an intraday high of almost $76 before settling near $74.
The move came from two things happening at once: hotter weather forecasts pushed natural gas prices higher, lifting sentiment across pipeline stocks broadly, including Williams Companies stock.
The rally builds on a genuinely strong quarter. Williams reported Q2 adjusted EBITDA of $1.92 billion, up 6% from the same period last year.
Revenue came in at $3.05 billion, beating expectations and up 9.8% year over year. Earnings per share landed at $0.50, right in line with what analysts expected.
The company also declared a quarterly dividend of $0.525 per share, or $2.10 a year, which gives investors a yield of around 2.8% at current prices.
Beyond the quarter itself, Williams raised its longer-term outlook. Management increased the midpoint of its 2026 adjusted EBITDA guidance to $8.4 billion, citing confidence in new projects and contracted volumes coming online.
On the earnings call, executives said they’re now targeting an 11%-plus compound annual growth rate for EBITDA through 2030, up from the 10%-plus target they’d given previously.
A big part of that confidence comes from two major moves. Williams agreed to acquire Momentum Midstream in a deal worth up to $5.5 billion, expanding its footprint in the Haynesville shale region and strengthening ties to Gulf Coast LNG, power, and industrial customers.
Separately, the company finalized a joint venture backed by Blackstone, KKR, and Apollo that provides $5.34 billion in committed capital for five behind-the-meter power projects.
Together, these two deals represent more than $10.8 billion tied to future growth.
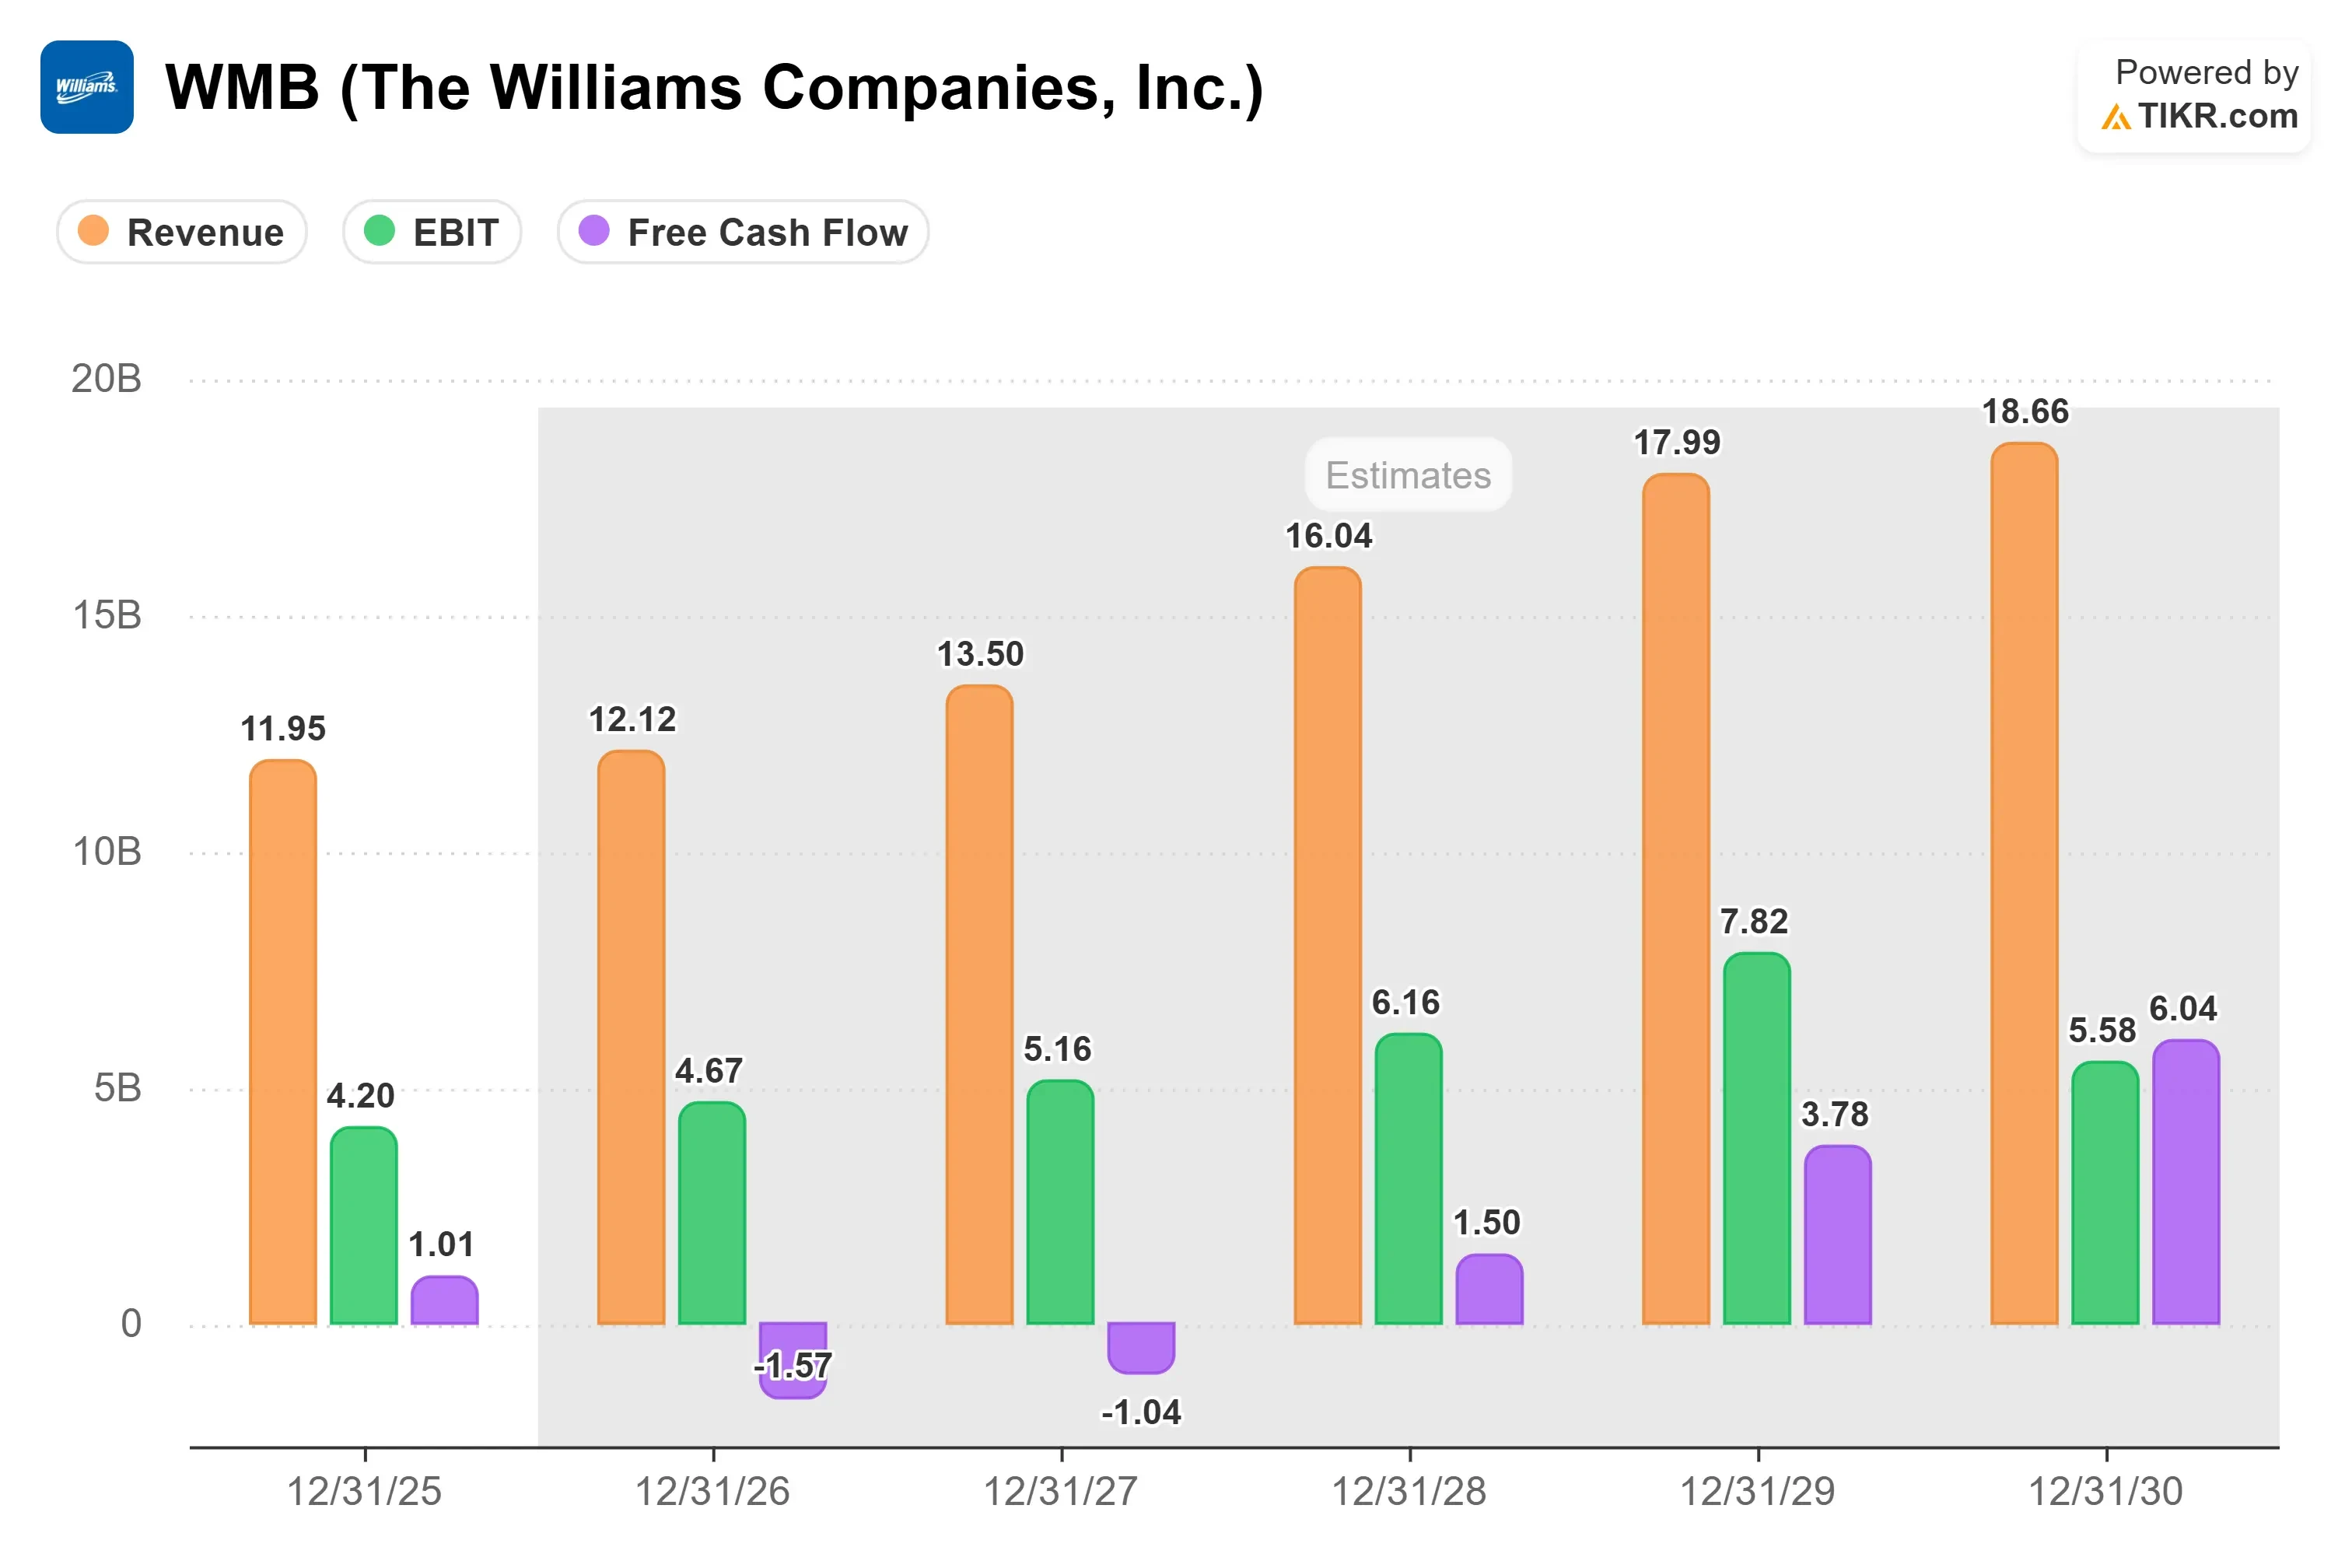
Analysts currently rate Williams Companies stock a consensus Buy, with an average price target of $85.60.
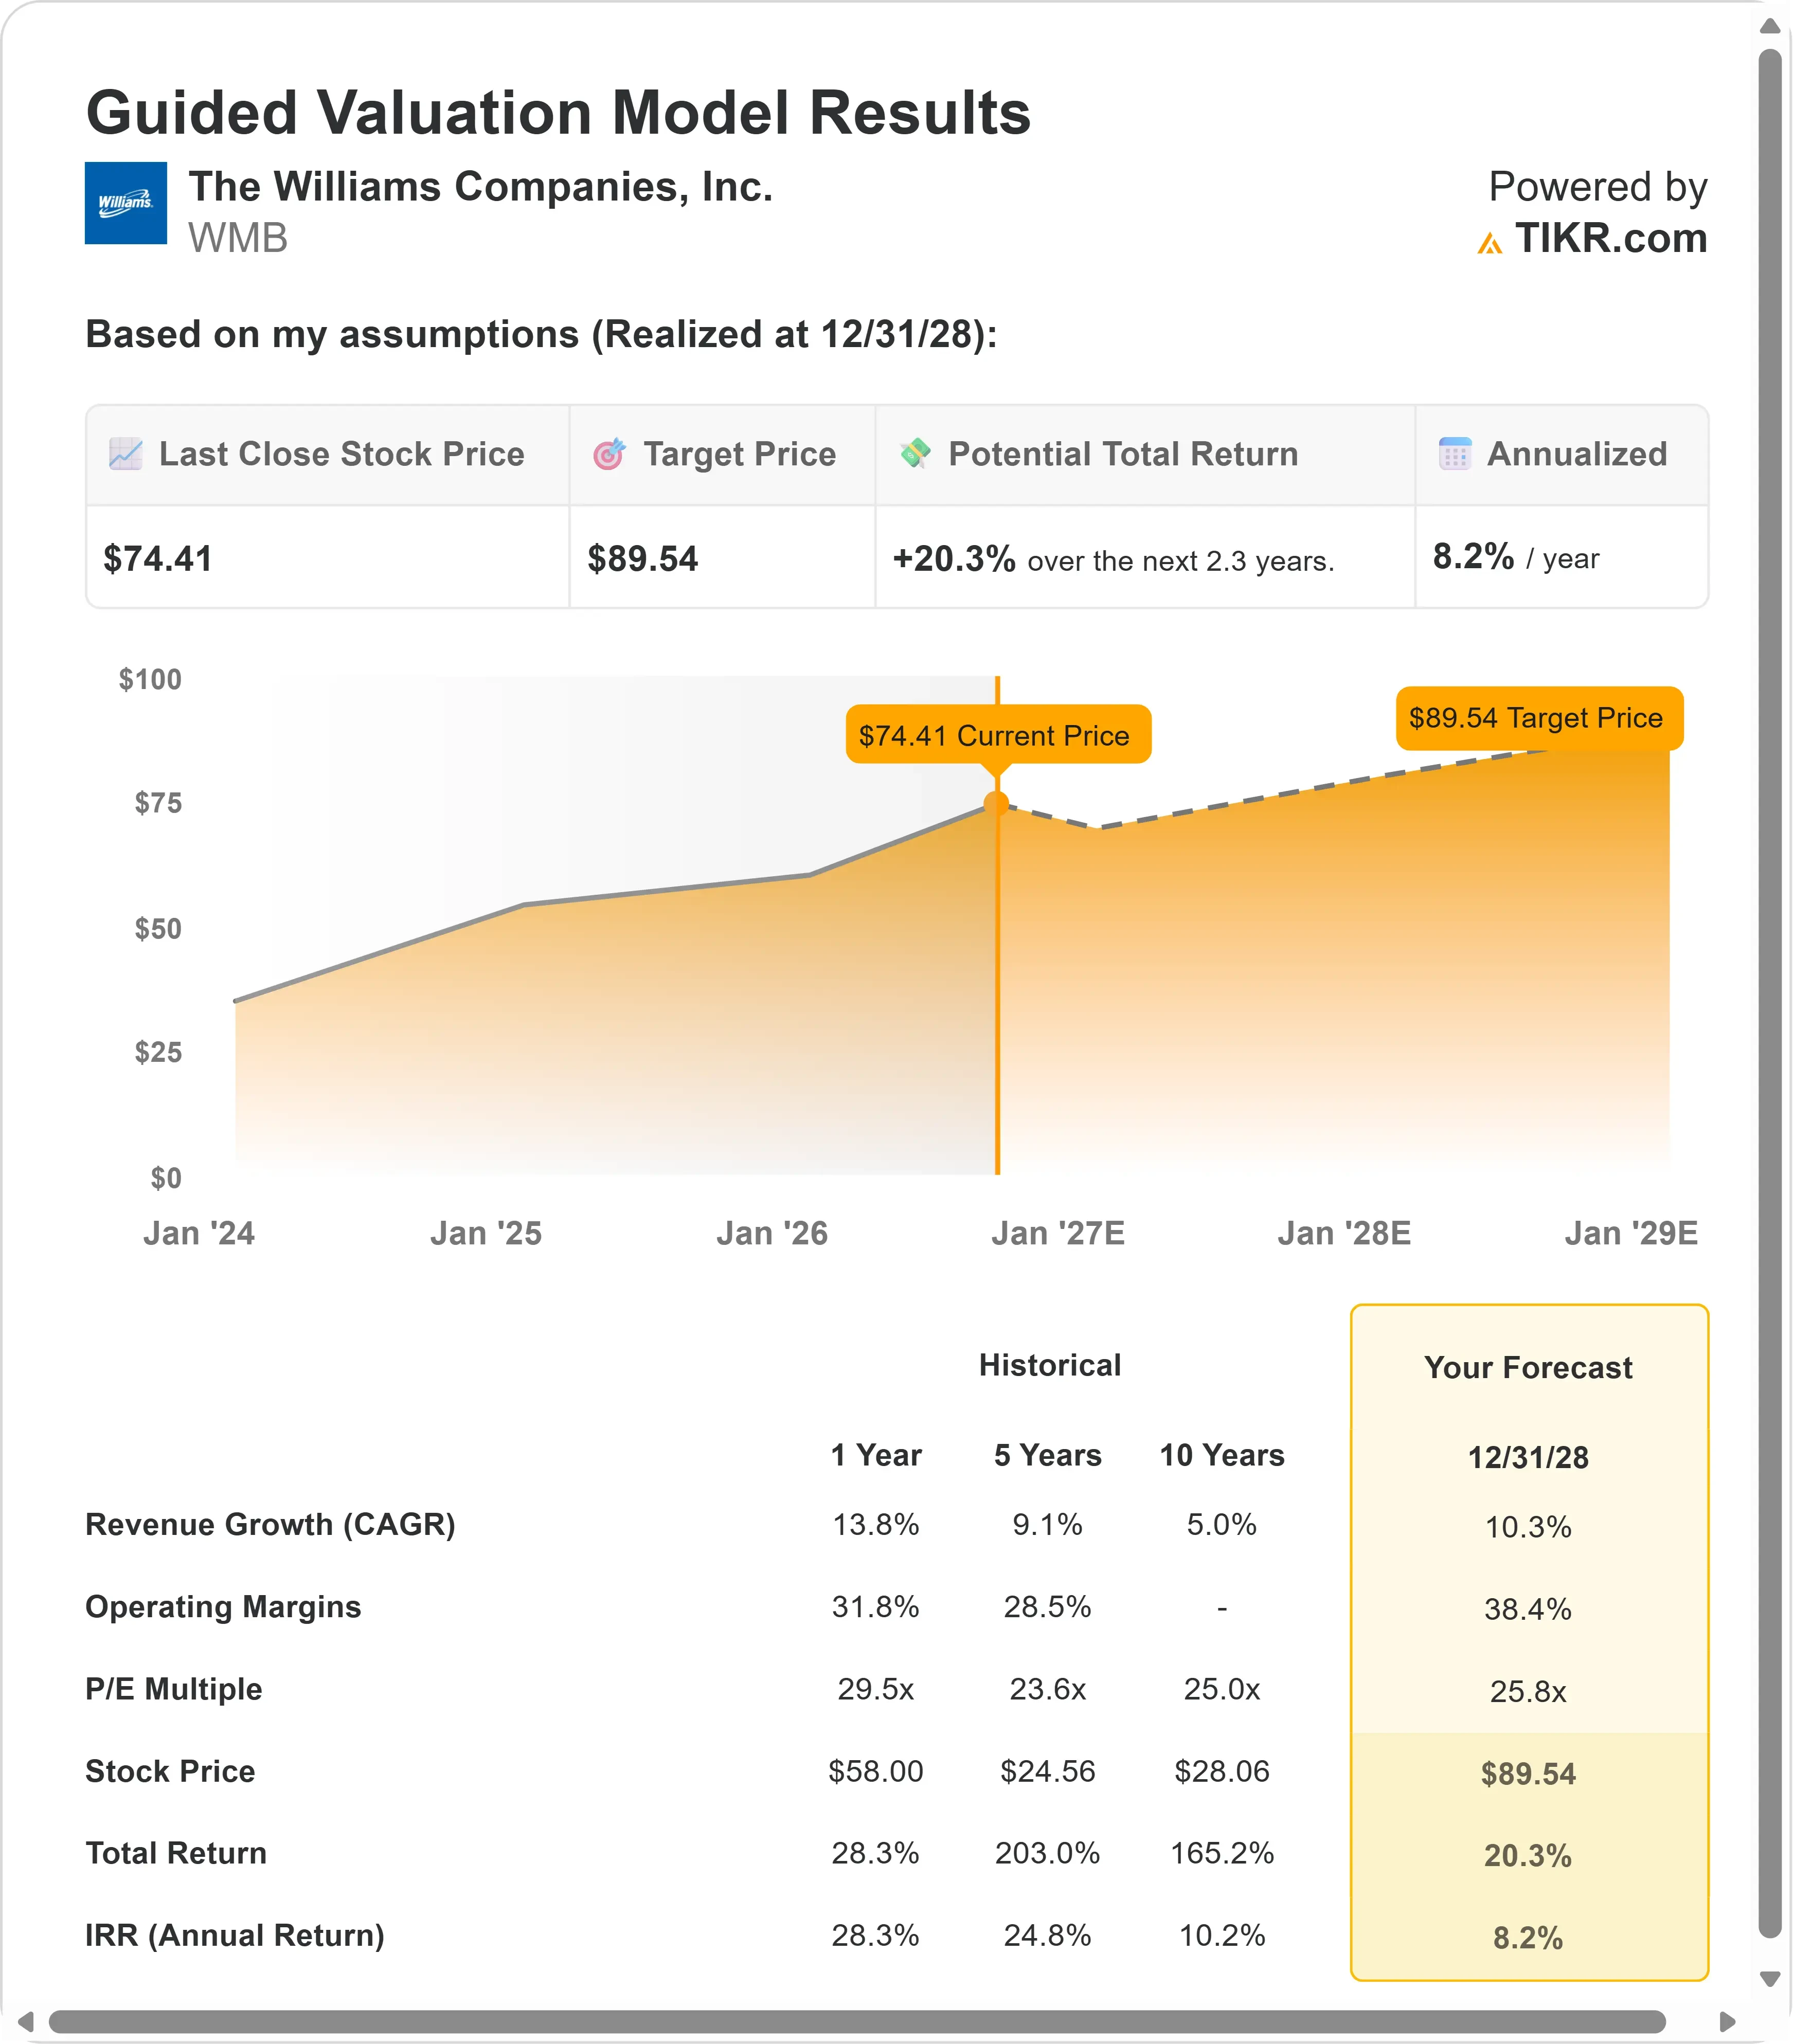
That’s more than $11 above where shares are trading now, implying upside of over 10% if the company delivers on its pipeline and power project backlog.
See analysts’ growth forecasts and price targets for Williams Companies stock (It’s free) >>>
What the Market Is Telling Us About Williams Companies Stock
The jump in Williams Companies stock reflects two things lining up together: a favorable natural gas backdrop and real business momentum.
Williams operates the Transco pipeline system, a major network that moves natural gas from Gulf Coast and Southeast production areas to demand centers along the Eastern Seaboard.
That kind of infrastructure benefits when gas prices and demand both move higher, since a large share of Williams’ revenue is fee-based rather than tied directly to commodity swings.
The market seems to be rewarding the company for pairing steady core operations with an aggressive growth pipeline, spanning natural gas gathering, pipeline expansions, and power infrastructure for things like data centers.
With shares still trading below the $85.60 consensus target, investors appear to be watching closely for how well Williams executes on the Momentum acquisition and its power project buildout in the coming quarters.
Estimate a company’s fair value instantly (Free with TIKR) >>>
How Much Upside Does Williams Companies Stock Have From Here?
With TIKR’s new Valuation Model tool, you can estimate a stock’s potential share price in under a minute.
All it takes is three simple inputs:
- Revenue Growth
- Operating Margins
- Exit P/E Multiple
If you’re not sure what to enter, TIKR automatically fills in each input using analysts’ consensus estimates, giving you a quick, reliable starting point.
From there, TIKR calculates the potential share price and total returns under Bull, Base, and Bear scenarios so you can quickly see whether a stock looks undervalued or overvalued.
See a stock’s true value in under 60 seconds (Free with TIKR) >>>
Looking for New Opportunities?
- See what stocks billionaire investors are buying so you can follow the smart money.
- Analyze stocks in as little as 5 minutes with TIKR’s all-in-one, easy-to-use platform.
- The more rocks you overturn… the more opportunities you’ll uncover. Search 100K+ global stocks, global top investor holdings, and more with TIKR.
Disclaimer:
Please note that the articles on TIKR are not intended to serve as investment or financial advice from TIKR or our content team, nor are they recommendations to buy or sell any stocks. We create our content based on TIKR Terminal’s investment data and analysts’ estimates. Our analysis might not include recent company news or important updates. TIKR has no position in any stocks mentioned. Thank you for reading, and happy investing!