Key Stats for OXY Stock
- This week’s performance: +1.8%
- 52-week range: $39 to $67
- Valuation model target price: $64
- Implied upside: 3.8% over 2.3 years
Gauge Occidental’s cash flow upside as oil prices shift (It’s free) >>>
New CEO, Record Cash Flow: Occidental’s Quiet Transition
Occidental Petroleum (OXY) closed at $61 this week, up slightly, as the producer keeps benefiting from stronger oil prices. Q2 revenue jumped 57% year over year to $8.3 billion, and adjusted EPS of $2.40 beat consensus by roughly 29%. Realized oil prices averaged $97 per barrel during the quarter.

The company also completed a leadership transition this year. Richard Jackson, previously Occidental’s COO, became president and CEO on June 1, succeeding Vicki Hollub, who remains on the board. Jackson has stressed capital discipline, telling analysts Occidental can deliver strong returns “without increasing production” thanks to efficiency gains.
Occidental is also weighing what to do with Kinetik Holdings, a midstream company that Western Midstream, an Occidental-backed entity, approached earlier this year. Those talks didn’t produce a deal, though reports suggest Kinetik is exploring a broader sale process now.
Jackson has been clear about priorities going forward. “We see a clear pathway to add over $4 billion of annual sustainable cash flow by 2030,” he told analysts, describing plans that don’t depend on rising production.
Brent crude trading above $100 per barrel this month has lifted the broader energy sector. If OXY stock keeps benefiting from firm oil prices, dividend growth could accelerate further.
Follow Occidental’s capital return plan with 5 years of forecasts (It’s free) >>>
Occidental’s Valuation: Priced for Steady, Not Spectacular

Under valuation model assumptions realized through 12/31/28, the stock is modeled using:
- Revenue Growth (CAGR): 3.7%
- Operating Margins: 29.5%
- P/E Multiple: 12.5x
Based on these inputs, the model estimates a target price of $64, implying 3.8% total upside from the current share price and a 1.6% annualized return over the next 2.3 years.
Occidental’s modeled return of just 1.6% annually sits well below the 5% threshold that usually flags an attractive entry. That’s a shift from a year ago, when shares traded closer to $45.

A 3.7% revenue growth assumption reflects Occidental’s strategy of holding output roughly flat while squeezing more cash flow from existing wells. Operating margins near 29.5% run well above the company’s five-year average, aided by drilling efficiency gains.
The 12.5x forward multiple sits below Occidental’s own 10-year average near 14.3x, but it’s also roughly in line with peer ConocoPhillips. Since returns depend heavily on oil prices staying elevated, the modest upside baked into estimates leaves little room for a pullback.
Occidental’s debt reduction since the Anadarko acquisition has strengthened its balance sheet, but the stock now looks more like a steady dividend grower than a deep value play.
Stress-test Occidental’s valuation against its own oil price assumptions (Free with TIKR) >>>
Occidental vs. ConocoPhillips and Chevron: The Permian Efficiency Race
Occidental’s closest peers are ConocoPhillips (COP) and Chevron (CVX), and the numbers show three different approaches to the same Permian Basin opportunity. ConocoPhillips posted record Permian output above 900,000 barrels of oil equivalent per day last quarter and trades at roughly 20.7x trailing earnings, returning 45% of operating cash flow to shareholders. Chevron, bolstered by its Hess acquisition, posted 51% revenue growth to $67.2 billion and trades at a richer 34x earnings.
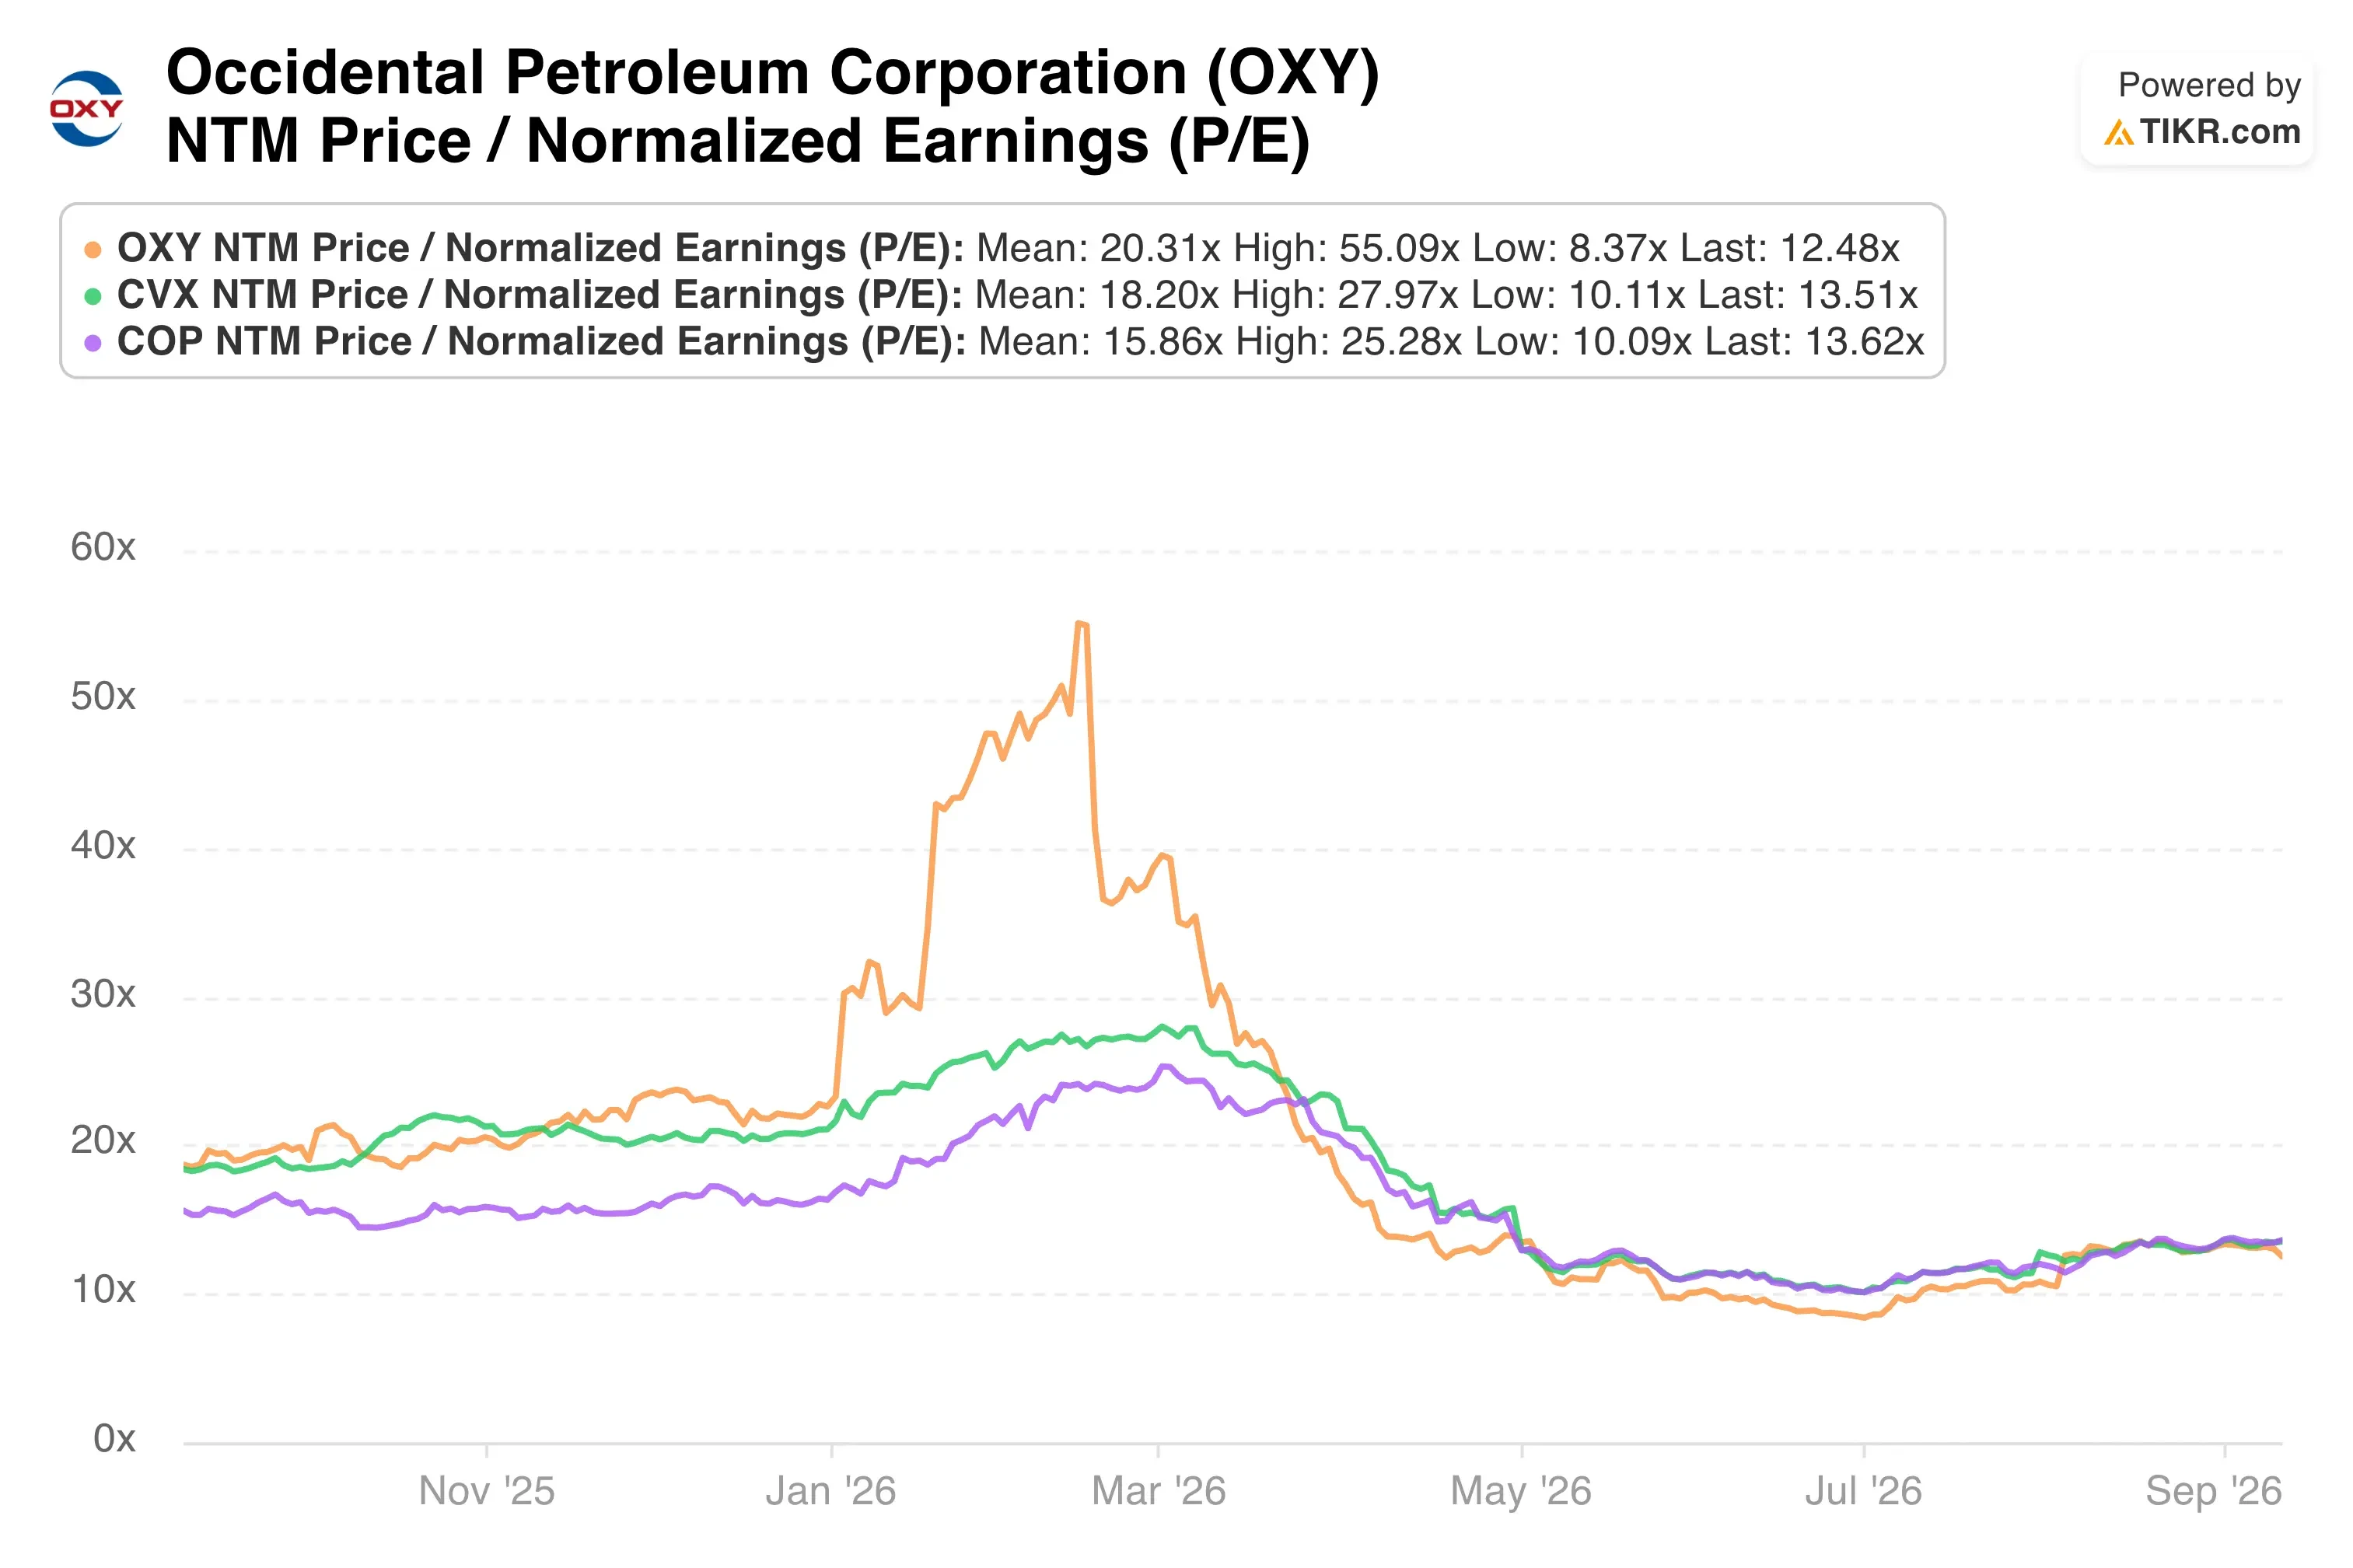
Occidental’s 12.5x forward multiple sits well below both peers, even though its 29.5% operating margin exceeds ConocoPhillips’s reported net margin. That gap partly reflects Occidental’s higher debt load relative to Chevron.
Where Occidental stands out is capital efficiency. Its plan to add $4 billion in annual cash flow by 2030 without raising output mirrors ConocoPhillips’s flat-production strategy more than Chevron’s growth-through-acquisition approach.
What’s Driving OXY Stock Going Forward?
Occidental’s forward catalysts center on execution rather than dealmaking. The company plans to drop 3 drilling rigs in Q4 while still bringing 15 more wells online than originally planned, a sign drilling efficiency keeps improving.
Management has also highlighted carbon dioxide enhanced oil recovery pilots in the Permian, which have delivered over 45% uplift in recovery rates over a decade of testing. The Stratos direct air capture facility is progressing toward full commissioning around year end.
That project should reduce Low Carbon Ventures capital spending by $400 million starting in 2027. Oil price direction, though, will likely matter more than any single operational update.
Occidental’s plan assumes roughly 85% of its $4 billion cash flow target can be achieved even at much lower prices, which should limit downside if crude retreats. Investors should watch Q3 results in early November for updates.
Project Occidental’s cash flow growth through 2030 with a Valuation Model (Free with TIKR) >>>
Should You Invest in Occidental Petroleum?
The only way to really know is to look at the numbers yourself. TIKR gives you free access to the same institutional-quality financial data that professional analysts use to answer exactly that question.
Pull up OXY, and you’ll see years of historical financials, what Wall Street analysts expect for revenue and earnings in the quarters ahead, how valuation multiples have moved over time, and whether price targets are trending up or down.
You can build a free watchlist to track OXY alongside every other stock on your radar. No credit card required. Just the data you need to decide for yourself.
Analyze OXY stock on TIKR Free→
Disclaimer:
Please note that the articles on TIKR are not intended to serve as investment or financial advice from TIKR or our content team, nor are they recommendations to buy or sell any stocks. We create our content based on TIKR Terminal’s investment data and analysts’ estimates. Our analysis might not include recent company news or important updates. TIKR has no position in any stocks mentioned. Thank you for reading, and happy investing!