


Key Stats for Bloom Energy Stock
- Current Price: $275.75
- Target Price (Mid): ~$1,443
- Street Target: ~$276
- Potential Total Return: ~423%
- Annualized IRR: ~47% / year
Now Live: Discover how much upside your favorite stocks could have using TIKR’s new Valuation Model (It’s free) >>>
What Happened?
Bloom Energy (BE) closed at $275.75 on September 11, up 6.68% on the day, and enters the S&P 500 before the open on September 21, replacing Molson Coors. The move investors are searching about is the index add. The number worth their attention is a different one: the stock has now climbed to within thirty cents of Wall Street’s average price target of $276.05.
That is an unusual place to be buying a name up more than 210% year to date. The average analyst who covers Bloom now sees almost no upside over the next twelve months, even though that mean target has itself been climbing all year. Yet the loudest recent calls are bullish, and passive funds are about to buy the stock no matter where it trades. Whether $276 is a ceiling the Street has to chase past or a top it is warning about is the question the next two weeks answer.
The Desks That Cover It Just Split Down the Middle
UBS analyst Manav Gupta raised his target to $325 from $300 on September 7 and kept a Buy, framing index membership as a durable new source of passive demand rather than a one-day pop. Clear Street went further the next day, lifting its target to $330. Against that, Jefferies raised its target to $229 but stayed at Hold, citing permitting and execution risk even as it acknowledged the AI-driven demand.
The spread matters because the mean target sits right at the price. TIKR data shows an average target of $276.05, with buy and outperform ratings outnumbering holds and only a single Underperform and a single Sell across the coverage. That is a Buy-leaning consensus whose price target the stock has already reached. The bulls are raising numbers to stay ahead of the tape while the fence-sitters hold into an event they cannot value. Both can be right for a few weeks, and only one can be right by the next print.
Bloom ran on this same inclusion thesis once before this year and gave the gains back when the addition did not materialize, according to earlier reporting. This time the add is real, but the “sell the news” risk around September 21 is that trade in reverse.

See historical and forward estimates for Bloom Energy stock (It’s free!) >>>
The Quarter Under the Index Story Is Genuinely Strong
On July 28, Bloom reported its first billion-dollar quarter: revenue of $1.065 billion, up 166% year over year, with product revenue up 215% and nearly 90% of the total. Non-GAAP gross margin reached 34.3%, non-GAAP operating income was $240 million, up 737% year over year, and non-GAAP EPS came in at $0.78 versus a $0.41 consensus. Management then raised full-year revenue guidance to $3.9 billion to $4.2 billion and nearly doubled its operating income outlook to $800 million to $900 million.
CFO Simon Edwards named why that profit step-up should hold: “Revenue grew 166%, while operating expenses grew just 48%,” a fixed R&D and G&A base absorbing gigawatt-scale volume so each incremental gigawatt carries little added overhead. That leverage is the single most important reason a company at these multiples can grow into them. The demand behind it is not speculative. CEO KR Sridhar said all major U.S. hyperscalers and over a dozen neoclouds and colocation operators have now validated Bloom’s technology, a status that took nearly a decade to reach in commercial markets but under a year in AI data centers, because grid interconnection quotes run years while Bloom delivers onsite power in months. Brookfield backed that speed in June, expanding its financing framework for Bloom projects fivefold, from $5 billion to $25 billion, capital that lets customers take the power without owning the equipment.
What $276 Embeds, and What Could Break It
At the current price, Bloom trades near 15.8x next-twelve-month revenue and 66.6x NTM EV/EBITDA, a steep premium its cohort partly explains. GE Vernova, the more credible long-term threat, trades near 5x forward revenue but its competing fuel-cell technology is not yet commercial. Plug Power and FuelCell Energy carry negative forward EBITDA multiples because they remain unprofitable. Bloom is the only profitable name in its immediate group, which is part of why it cleared the S&P 500’s profitability screen at all.
A securities class action with a September 28 lead-plaintiff deadline builds on a July 8 report from short-seller Hunterbrook Media alleging Bloom sources scandium through intermediaries routing Chinese material via Thailand, Japan, and South Korea, understating its reliance on China. On the Q2 call, Morgan Stanley’s David Arcaro asked Sridhar directly about scandium access; his answer was that there is enough recoverable scandium on the planet, that Bloom has visibility for 25 gigawatts of deployments, and that “we are not dependent on China.”
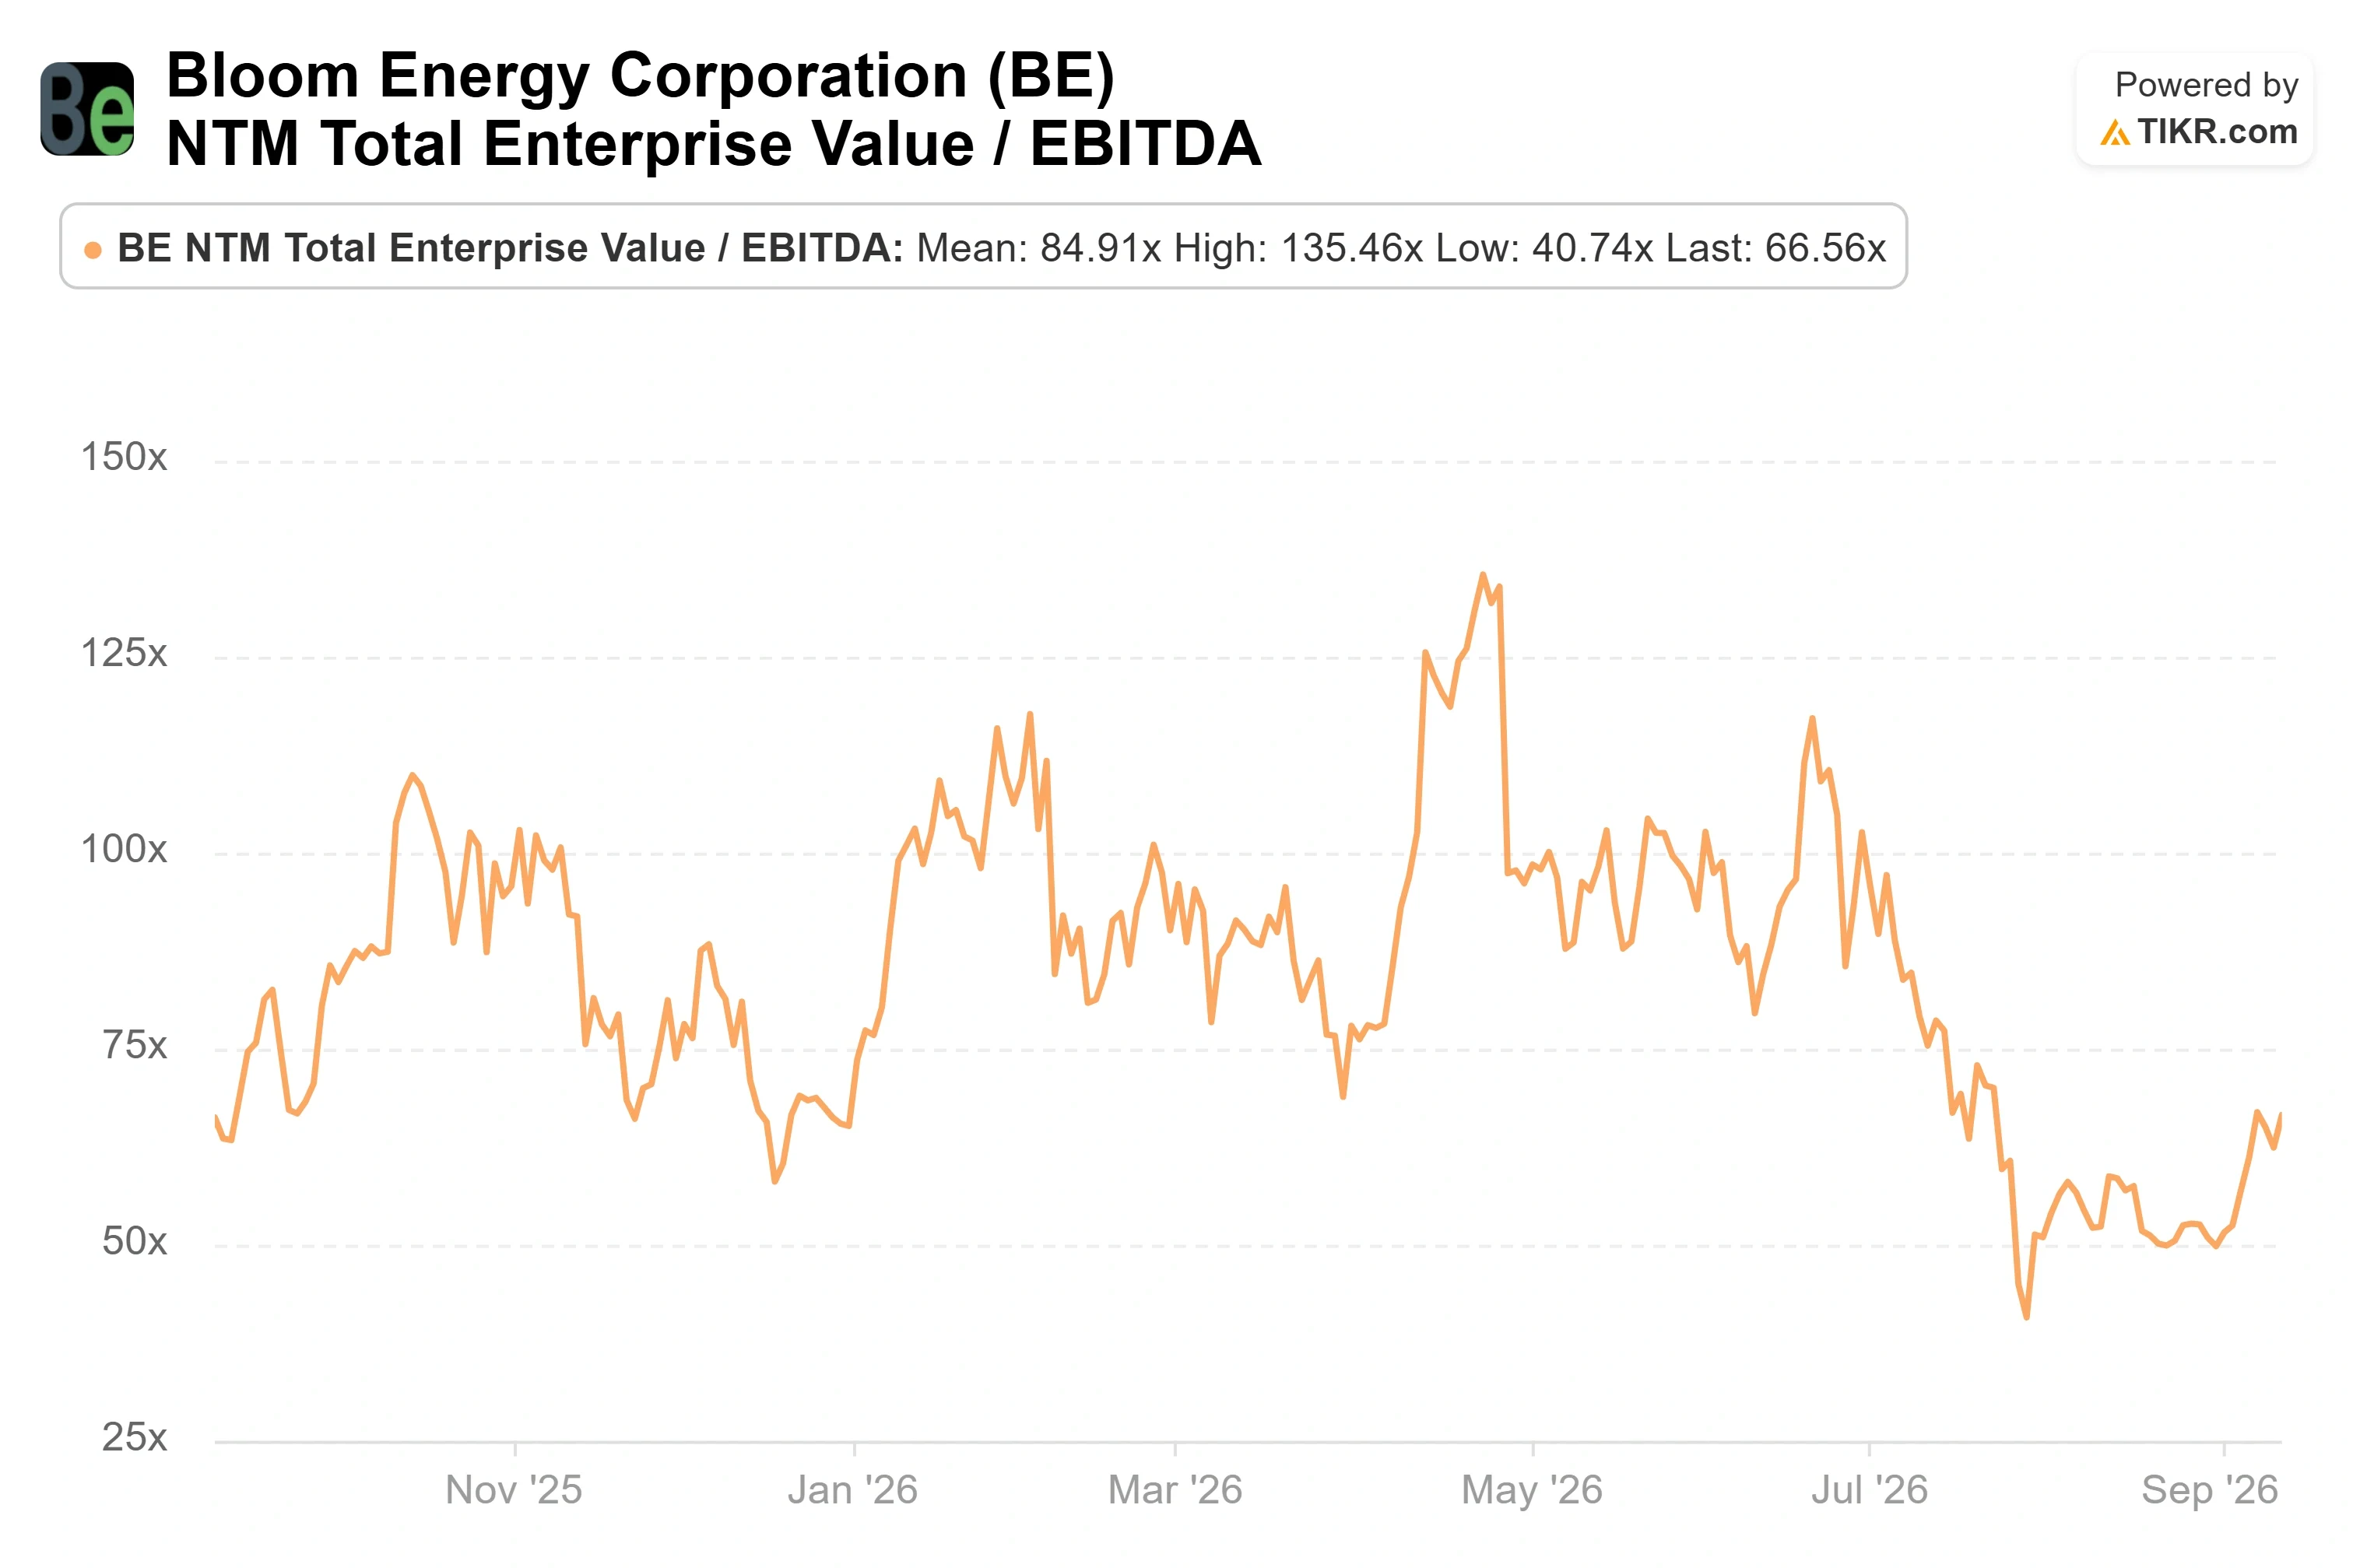
See how Bloom Energy performs against its peers in TIKR (It’s free!) >>>
TIKR Advanced Model Analysis
- Current Price: $275.75
- Target Price (Mid): ~$1,443
- Potential Total Return: ~423%
- Annualized IRR: ~47% / year

See analysts’ growth forecasts and price targets for Bloom Energy stock (It’s free!) >>>
TIKR’s mid-case scenario values Bloom at around $1,443, roughly 423% total upside from today, or about 47% annualized over the next 4.3 years. It rests on two revenue drivers: continued data-center product deliveries to hyperscalers and neoclouds, and the backlog conversion Sridhar says is now outpacing revenue itself. The margin driver is the operating leverage Edwards described, pushing modeled net income margin toward the high 30s.
The model’s own assumptions name the primary risk. It carries a modest annual P/E compression, so the return depends on earnings growth outrunning a shrinking multiple. Deliver the volumes and the upside is a multi-year compounding story. If growth slows, if the scandium litigation forces a disclosure that changes the supply-chain picture, or if the multiple compresses faster than earnings grow, the same leverage that built the case runs against it.
Conclusion
The near-term tell is mechanical: watch how Bloom trades around the September 21 effective date. If it holds or extends on passive buying, the UBS view that inclusion is durable demand gets its first evidence. If it fades once the forced buying clears, the Hold camp looks right that $276 was the target, not the floor. The durable test comes at Q3 earnings on October 27, where the number that matters is whether gross margin holds near management’s roughly 34% full-year guide while revenue tracks toward the raised $3.9 billion to $4.2 billion range. Margin slipping while the multiple sits at 66x EBITDA is the one combination this price cannot absorb.
See what stocks billionaire investors are buying so you can follow the smart money with TIKR.
Should You Invest in Bloom Energy?
The only way to really know is to look at the numbers yourself. TIKR gives you free access to the same institutional-quality financial data that professional analysts use to answer exactly that question.
Pull up Bloom Energy, and you’ll see years of historical financials, what Wall Street analysts expect for revenue and earnings in the quarters ahead, how valuation multiples have moved over time, and whether price targets are trending up or down.
You can build a free watchlist to track Bloom Energy alongside every other stock on your radar. No credit card required. Just the data you need to decide for yourself.
Analyze Bloom Energy on TIKR Free →
Looking for New Opportunities?
- See what stocks billionaire investors are buying so you can follow the smart money.
- Analyze stocks in as little as 5 minutes with TIKR’s all-in-one, easy-to-use platform.
- The more rocks you overturn… the more opportunities you’ll uncover. Search 100K+ global stocks, global top investor holdings, and more with TIKR.
Disclaimer:
Please note that the articles on TIKR are not intended to serve as investment or financial advice from TIKR or our content team, nor are they recommendations to buy or sell any stocks. We create our content based on TIKR Terminal’s investment data and analysts’ estimates. Our analysis might not include recent company news or important updates. TIKR has no position in any stocks mentioned. Thank you for reading, and happy investing!


