Key Takeaways:
- Pricing Agreement Shift: Merck & Co., Inc. reached a December 2025 agreement with the U.S. government, committing over $70 billion in domestic investment while expanding direct-to-patient access for key diabetes drugs at materially lower prices.
- Pipeline Execution: Merck & Co., Inc. advanced oncology strategy in January 2026 through a multi-year Guardant Health collaboration, strengthening companion diagnostics supporting Keytruda’s $8 billion quarterly sales base.
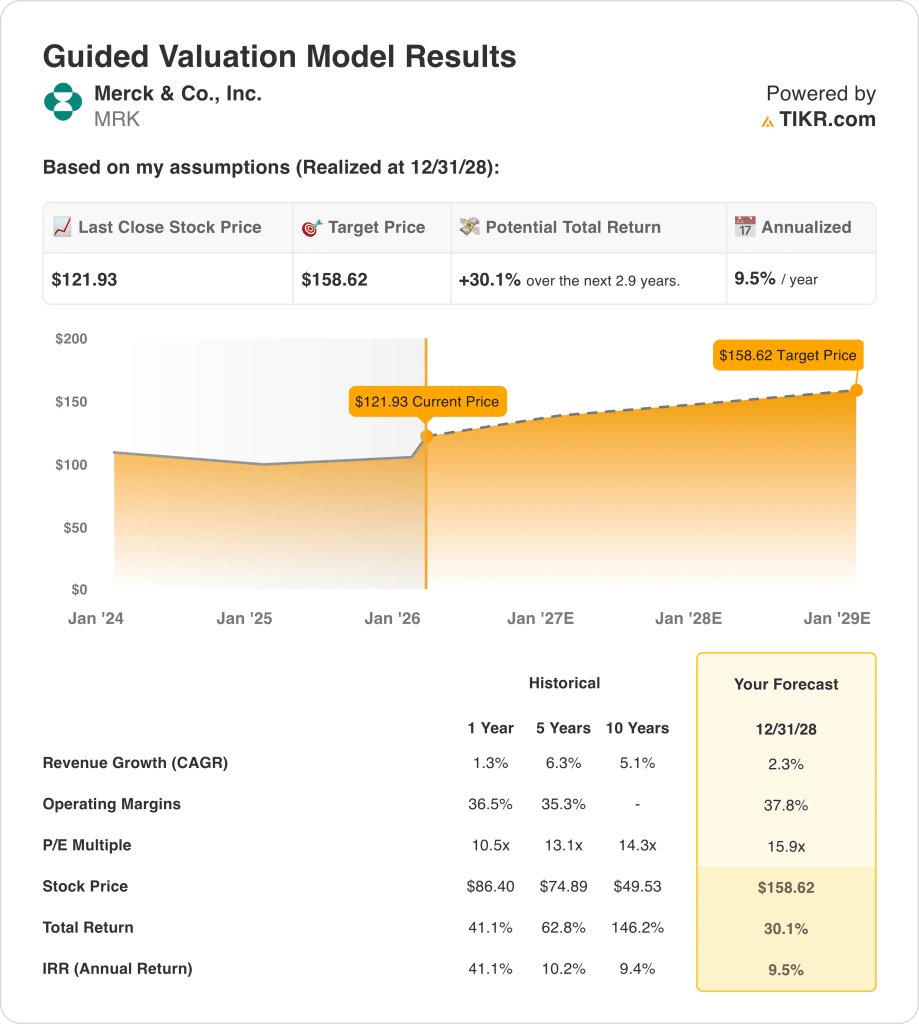
- Valuation Anchor: Merck & Co., Inc. stock could reach $159 by 2028 as the model applies 2% revenue growth, 38% operating margins, and a normalized 16x earnings multiple.
- Return Profile: Merck & Co., Inc.’s $159 target implies 30% upside from the current $122 price, equating to a 10% annualized return over roughly 3 years.
Merck & Co., Inc. (MRK) sells prescription medicines, vaccines, and animal health products to hospitals, physicians, governments, and consumers, reaching a 2025 revenue scale of $65 billion.
Last year, its revenue reached $65 billion, gross profit totaled $50 billion, operating expenses were $26 billion, and operating income reached $25 billion, translating into a 38% operating margin reflecting high biologics mix.
For 2026, management guided revenue between $66 billion and $67 billion with adjusted EPS of $5 to $5, reflecting margin stability near 38% despite a $4 per share one-time acquisition charge.
On December 19, 2025, the company announced a U.S. government agreement tied to drug affordability and a $70 billion domestic investment plan, reshaping pricing optics while securing manufacturing and tariff stability.
“As an American company, Merck is proud to work with the Trump administration to ensure Americans can access medicines they need at lower costs,” CEO Robert Davis said in Q4 2025 earnings call.
Merck stock currently trades at $122 and a modeled value of $159 using a 16x multiple, investors face tension between stable cash generation and whether policy-driven pricing changes constrain future earnings power.
What the Model Says for MRK Stock
Merck’s scale in oncology and vaccines supports steady cash generation, though capital intensity and policy exposure constrain growth expectations relative to faster innovating peers.
The valuation model assumes 2.3% revenue growth, 37.8% operating margins, and a 15.9x exit multiple, producing a $158.62 target price by 2028.
This projection delivers 30.1% total upside and a 9.5% annualized return, and that level aligns only with baseline equity risk over the forecast period.

This valuation model suggests a Sell, because a 9.5% annualized return does not meet required thresholds for incremental capital deployment.
The 9.5% annualized return sits below a typical 10% equity hurdle, and the model therefore favors capital preservation over appreciation because earnings durability and policy risk limit incremental return compensation at the current valuation.
Our Valuation Assumptions
TIKR’s Valuation Model lets you plug in your own assumptions for a company’s revenue growth, operating margins, and P/E multiple, and calculates the stock’s expected returns.
Here’s what we used for MRK stock:
1. Revenue Growth: 2.3%
AbbVie delivered 8.6% revenue growth over the last year, supported by immunology scale and the transition away from Humira dependence.
Current execution supports 8.3% growth as Skyrizi and Rinvoq expand indications and offset erosion across legacy products.
This path requires sustained immunology momentum and stable pricing, while slower uptake or competitive pressure would reduce growth quickly.
This is below the 1-year historical revenue growth of 8.6%, indicating the model assumes modest deceleration consistent with portfolio maturity.
2. Operating Margins: 37.8%
AbbVie posted a 41.4% operating margin over the last year, reflecting high-margin biologics balanced against elevated R&D spending.
The model assumes margins rise to 47.1% as revenue scales and operating expenses grow slower than gross profit.
This outcome depends on cost discipline and pipeline efficiency, while higher reinvestment or pricing pressure would compress margins.
This is above the 1-year historical operating margin of 41.4%, indicating the model assumes improved efficiency that requires sustained execution.
3. Exit P/E Multiple: 15.9x
The exit multiple capitalizes AbbVie’s terminal earnings after growth normalizes and pipeline visibility stabilizes by the end of the forecast period.
A 15.1x P/E reflects durable cash flows but limits re-rating given maturity and policy exposure already embedded in earnings.
This is below the 1-year historical P/E multiple of 16.4x, indicating the model assumes valuation compression consistent with a mature earnings profile.
The model uses a lower exit multiple than the market assumption of 23.69x forward P/E because it assumes normalization as growth matures, policy risk persists, and today’s elevated forward multiple does not sustain into a steady-state 2028 earnings profile.
What Happens If Things Go Better or Worse?
Merck stock outcomes depend on oncology demand durability, vaccine volume stability, and cost discipline across a mature portfolio, creating distinct operating paths through 2031.
- Low Case: If oncology growth slows and pricing pressure persists, revenue grows 1.6% and margins hold near 30.8% → 3.6% annualized return.
- Mid Case: With core oncology and vaccines performing as expected, revenue grows 1.8% and margins improve toward 32.6% → 7.4% annualized return.
- High Case: If oncology volumes surprise and cost control strengthens, revenue reaches 1.9% growth and margins approach 34.2% → 10.8% annualized return.
How Much Upside Does Merck Stock Have From Here?
With TIKR’s new Valuation Model tool, you can estimate a stock’s potential share price in under a minute.
All it takes is three simple inputs:
- Revenue Growth
- Operating Margins
- Exit P/E multiple
If you’re not sure what to enter, TIKR automatically fills in each input using analysts’ consensus estimates, giving you a quick, reliable starting point.
From there, TIKR calculates the potential share price and total returns under Bull, Base, and Bear scenarios so you can quickly see whether a stock looks undervalued or overvalued.
Looking for New Opportunities?
- See what stocks billionaire investors are buying so you can follow the smart money.
- Analyze stocks in as little as 5 minutes with TIKR’s all-in-one, easy-to-use platform.
- The more rocks you overturn… the more opportunities you’ll uncover. Search 100K+ global stocks, global top investor holdings, and more with TIKR.
Disclaimer:
Please note that the articles on TIKR are not intended to serve as investment or financial advice from TIKR or our content team, nor are they recommendations to buy or sell any stocks. We create our content based on TIKR Terminal’s investment data and analysts’ estimates. Our analysis might not include recent company news or important updates. TIKR has no position in any stocks mentioned. Thank you for reading, and happy investing!