
Key Takeaways:
- Strategic Review Reset: Mastercard completed a strategic review and is cutting 4% of staff while taking a $200 million Q1 restructuring charge to redirect spend toward priority growth areas.
- Network Share Wins: Mastercard extended its Capital One partnership and entered 2026 with Q4 net revenues up 15% and services up 22%, reinforcing share gains in issuing and monetization beyond swipe fees.
- Price Path: Mastercard stock could reach $838 by 2028 as the model capitalizes 12% revenue growth, 60% operating margins, and a 28x exit multiple.
- Return Math: Mastercard’s $838 target implies 53% upside from $549 today, translating into a 16% annualized return over the next 3 years.
Mastercard Incorporated (MA) runs a global card network and services platform that earns fees from transaction volumes across issuers, merchants, and digital partners in 200 countries.
Mastercard stayed resilient through 2025, with Q4 net revenues up 15% and value-added services revenue up 22% as payments data scaled attach rates.
Gross profit was not provided in the materials, but operating leverage remained strong with operating income up 17% on operating expenses up 12%.
Management linked the shift to cost discipline, with Head of Investor Relations Devin Corr stating on the Q4 2025 call, “Recently, we completed a strategic review of our business,” alongside a $200 million Q1 2026 restructuring charge and a 4% workforce reduction.
Volume trends remained supportive with Q4 GDV up 7%, cross-border volume up 14%, and contactless penetration at 77%, while nearly 4 billion cards in force sustain network utility.
The valuation assumes margins hold near 60% even as the exit multiple compresses to 28x, leaving $838 by 2028 dependent on execution staying ahead of rising payment-sovereignty scrutiny in Europe.
What the Model Says for MA Stock
Mastercard’s scaled payment network, asset-light structure, and high-margin services mix support elevated expectations despite regulatory and competitive scrutiny.
The model assumes 12.4% revenue growth, 59.9% operating margins, and a 28.2x exit multiple, generating a $838.49 target price by 2028.
The implied 52.8% total upside and 15.7% annualized return exceed typical equity opportunity costs, offering compensation relative to large-cap risk exposure.

The model signals a Buy, as a 15.7% annualized return supports capital appreciation under disciplined risk-adjusted valuation logic.
At a projected 15.7% annualized return above a standard 10% equity hurdle, the valuation offsets regulatory and execution risk, supports capital appreciation over preservation, and warrants a Buy based on disciplined capital-allocation reasoning.
Our Valuation Assumptions
TIKR’s Valuation Model lets you plug in your own assumptions for a company’s revenue growth, operating margins, and P/E multiple, and calculates the stock’s expected returns.
Here’s what we used for Mastercard stock:
1. Revenue Growth: 12.4%
Mastercard stock’s revenue expanded at a 16.4% 1-year CAGR, reflecting strong cross-border volumes, pricing strength, and rising contribution from value-added services across a global card network.
Current growth support comes from double-digit payment volume trends, continued services mix expansion, and stable consumer spending, sustaining a revenue base measured in tens of billions.
This assumption depends on resilient global consumption, limited regulatory disruption, and sustained pricing power, while slower travel recovery or merchant fee pressure would quickly soften topline momentum.
This level falls below the 1-year historical revenue growth of 16.4%, and the model assumes slower expansion as scale increases and market maturity rises.
2. Operating Margins: 59.9%
Operating margins averaged 58.4% over the past year, reflecting high incremental margins from network economics and disciplined expense control across technology and personnel spending.
Recent execution includes mid-teens revenue growth against low-double-digit expense growth, supporting margin expansion toward 59.9% as scale benefits outweigh incremental reinvestment.
Sustaining this level requires cost discipline, limited regulatory cost inflation, and continued services mix gains, while wage pressure or compliance spending would compress margins rapidly.
This is above the 1-year historical operating margin of 58.4%, indicating the model assumes incremental efficiency rather than aggressive reinvestment.
3. Exit P/E Multiple: 28.2x
Mastercard traded at a 32.7x P/E over the past year, supported by durable earnings, high returns on capital, and limited cyclicality relative to broader financial peers.
A 28.2x exit multiple assumes durable earnings quality and strong cash generation, while market sentiment normalizes and re-rating potential declines by 2028.
This is below the 1-year historical P/E multiple of 32.7x, indicating the model assumes valuation compression despite durable business fundamentals.
What Happens If Things Go Better or Worse?
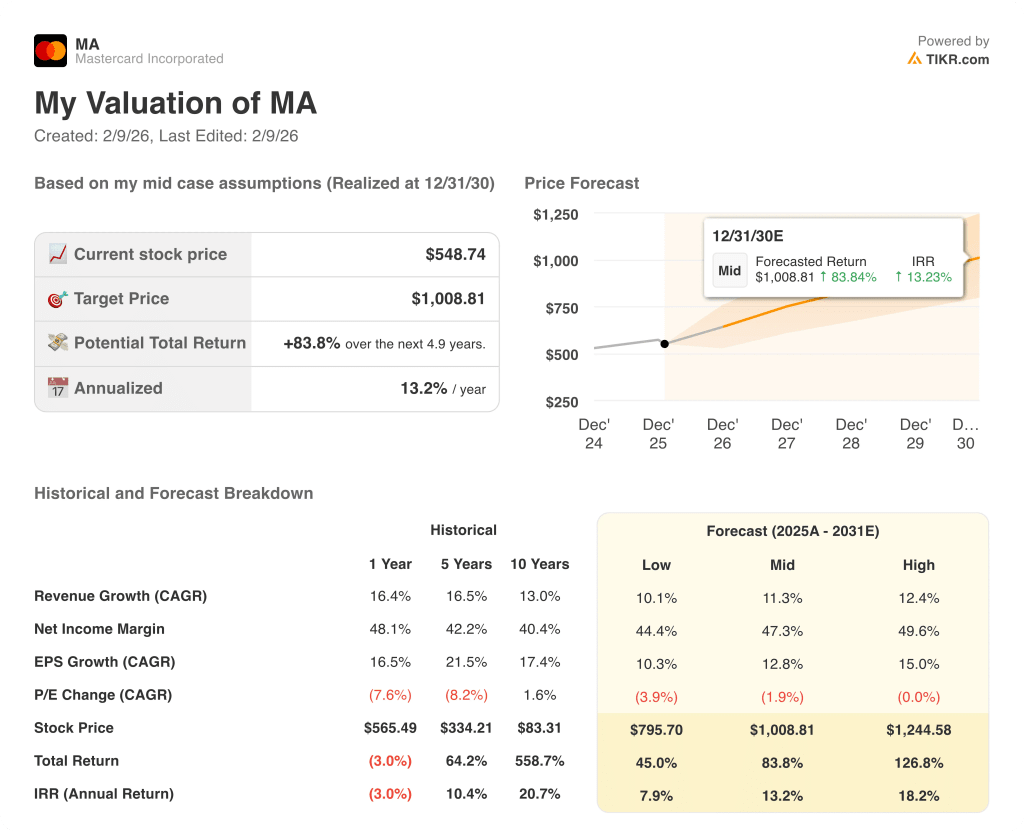
Mastercard stock performance depends on global consumer spending, cross-border payment volumes, and disciplined cost control, setting up a range of possible paths through 2030.
- Low Case: If regulatory pressure rises and volume growth cools, revenue grows near 10.1% and margins stay around 44.4% → 7.9% annualized return.
- Mid Case: With consumer spending steady and services expansion intact, revenue grows near 11.3% and margins improve toward 47.3% → 13.2% annualized return.
- High Case: f cross-border travel accelerates and cost discipline holds, revenue reaches 12.4% and margins approach 49.6% → 18.2% annualized return.
How Much Upside Does Mastercard Stock Have From Here?
With TIKR’s new Valuation Model tool, you can estimate a stock’s potential share price in under a minute.
All it takes is three simple inputs:
- Revenue Growth
- Operating Margins
- Exit P/E multiple
If you’re not sure what to enter, TIKR automatically fills in each input using analysts’ consensus estimates, giving you a quick, reliable starting point.
From there, TIKR calculates the potential share price and total returns under Bull, Base, and Bear scenarios so you can quickly see whether a stock looks undervalued or overvalued.
Looking for New Opportunities?
- See what stocks billionaire investors are buying so you can follow the smart money.
- Analyze stocks in as little as 5 minutes with TIKR’s all-in-one, easy-to-use platform.
- The more rocks you overturn… the more opportunities you’ll uncover. Search 100K+ global stocks, global top investor holdings, and more with TIKR.
Disclaimer:
Please note that the articles on TIKR are not intended to serve as investment or financial advice from TIKR or our content team, nor are they recommendations to buy or sell any stocks. We create our content based on TIKR Terminal’s investment data and analysts’ estimates. Our analysis might not include recent company news or important updates. TIKR has no position in any stocks mentioned. Thank you for reading, and happy investing!