Key Stats: James Hardie Industries (JHX) — Q4 FY2026
- Current Price: ~$19 as of May 20, 2026
- Full-Year FY2026 Revenue: $4.8B, +25% YoY
- Full-Year FY2026 Adjusted EPS: $0.30 (Q4); full-year adjusted EBITDA of $1.27B
- Q4 FY2026 Revenue: $1.4B, +45% YoY
- Q4 FY2026 Adjusted EPS: $0.30
- FY2027 Revenue Guidance: $5.25B to $5.41B (0% to 3% pro forma growth; 1% to 4% organic)
- FY2027 Adjusted EBITDA Guidance: $1.45B to $1.50B
- TIKR Model Price Target: $33 (mid case)
- Implied Upside: +74% from current price
JHX Q4 Delivered Above Expectations. The Question Is Whether FY2027 Can Absorb $100M in New Cost Pressure

James Hardie Industries (JHX) Q4 FY2026 revenue came in at $1.4B, up 45% year-over-year, with adjusted EBITDA of $381M at a 27.1% margin, ahead of expectations.
The AZEK acquisition accounts for much of that headline growth, with $445M of acquired revenue included in the Q4 figure, according to CFO Ryan Lada on the Q4 earnings call.
On an organic basis, Q4 net sales declined 1%, and full-year organic net sales declined 2%, reflecting weakness in the core fiber cement business.
The Siding & Trim segment posted Q4 net sales of $767M, up 7%, with adjusted EBITDA of $253M at a 33% margin.
Weather disrupted the quarter early, with February and March seeing above-average precipitation and storms across key markets, and management estimated the weather impact to fiber cement sales at approximately $20M in the quarter, according to Ryan Lada on the Q4 earnings call.
Deck, Rail & Accessories delivered Q4 net sales of $345M, up 5%, with adjusted EBITDA of $98M at a 28% margin.
DR&A sell-through grew low single digits in Q4, lapping strong growth in the prior year, according to Ryan Lada on the Q4 earnings call.
The Australia and New Zealand segment posted Q4 net sales of $140M, up 18%, primarily driven by FX, with adjusted EBITDA of $50M at a 36% margin.
Europe contributed Q4 net sales of $152M, up 13%, primarily driven by FX, with adjusted EBITDA of $23M at a 15% margin.
For the full year, free cash flow reached $314M, reflecting integration and acquisition-related costs that weighed on the figure, according to CEO Aaron Erter on the Q4 earnings call.
FY2027 guidance calls for net sales of $5.25B to $5.41B and adjusted EBITDA of $1.45B to $1.50B, with free cash flow expected to exceed $500M as integration costs roll off.
Management also flagged approximately $80M to $100M in new cost inflation for FY2027, driven largely by the Middle East conflict’s impact on raw materials, freight, and energy inputs, with roughly two-thirds of that pressure falling in North America, according to Ryan Lada on the Q4 earnings call.
Cost synergies exited FY2026 at an ~$80M run rate against an original target of ~$42M, and commercial revenue synergies are guided to reach a $125M run rate exiting FY2027.
From Peak Margin to Integration-Year Compression: What the Income Statement Shows
The income statement tells a clear compression story across the past eight quarters, with the AZEK acquisition reshaping the cost structure beginning in Q3 FY2026.
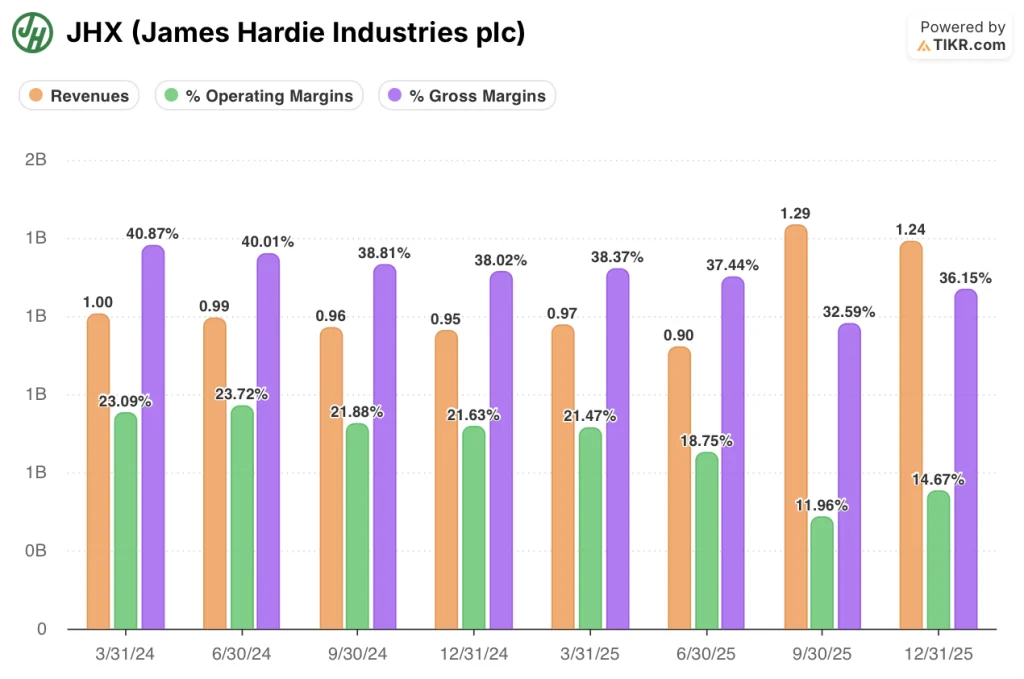
Operating margin peaked at 24% in Q2 FY2024 and trended steadily lower through FY2025, reaching 21% in Q1 FY2025 before dropping more sharply in Q2 FY2025 to 19%.
The step-down accelerated in the back half of FY2025, with operating margin hitting 12% in Q3 FY2025 as AZEK integration costs entered the P&L.
Q4 FY2026 operating margin recovered to 15%, up from 12% in Q3, as initial plant optimization benefits began flowing through.
Gross margin followed a similar arc, peaking at 41% in Q1 FY2024 and compressing to 37% by Q1 FY2025 before dropping further to 33% in Q3 FY2025; Q4 FY2026 shows a partial recovery to 36%.
Revenue scaled sharply with the acquisition, jumping from $970M in Q1 FY2025 to $1.29B in Q3 FY2025 and $1.24B in Q4 FY2025, then $1.4B in Q4 FY2026.
Management attributed early margin recovery to plant footprint optimization and expense management, including $25M in annualized savings from plant closures actioned in Q4, according to Ryan Lada on the Q4 earnings call.
TIKR Model Prices In a Rerating That Requires Margin Execution the Business Hasn’t Yet Demonstrated at Scale
The TIKR valuation model prices James Hardie Industries stock at $33 on the mid case, implying 74% total return from the current price of ~$19, realized over approximately 5 years.
The mid case assumes a revenue CAGR of 7.5% and a net income margin of 17%, against a historical one-year net income margin of 17% and a five-year average of 16%.
The P/E change CAGR embedded in the mid case is flat (0%), meaning the model assigns no multiple expansion to the target price: all of the implied return is driven by earnings growth, not rerating.
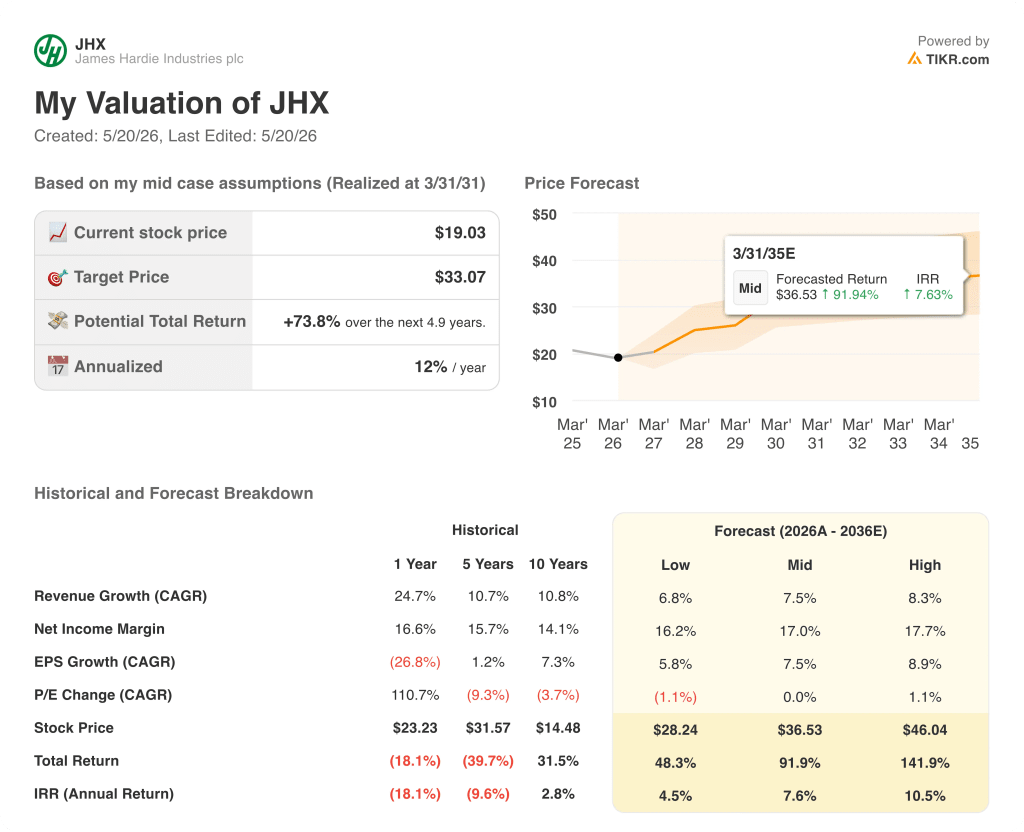
That is the load-bearing assumption: the model requires the business to deliver margin expansion toward 17% net income while absorbing $80M to $100M in new cost inflation and integrating a major acquisition, with no credit given for multiple re-expansion if sentiment improves.
The low case prices the stock at $28.24 (48% total return, 4.5% IRR), the mid at $36.53 (92% total return, 7.6% IRR), and the high at $46.04 (142% total return, 10.5% IRR), per the TIKR forecast table.
The spread between the low and high case is wide, reflecting the genuine uncertainty in whether AZEK integration synergies, fiber cement market share recovery, and cost discipline can converge on the same timeline.
The debate for James Hardie Industries stock in FY2027 is not whether the integration was worthwhile. It is whether the synergy runway can outrun a newly enlarged cost base at a moment when the macro is softening.
Should You Invest in James Hardie Industries plc?
The only way to really know is to look at the numbers yourself. TIKR gives you free access to the same institutional-quality financial data that professional analysts use to answer exactly that question.
Pull up James Hardie Industries stock and you’ll see years of historical financials, what Wall Street analysts expect for revenue and earnings in the quarters ahead, how valuation multiples have moved over time, and whether price targets are trending up or down.
You can build a free watchlist to track James Hardie Industries alongside every other stock on your radar. No credit card required. Just the data you need to decide for yourself.
Access Professional Tools to Analyze JHX stock on TIKR for Free →