
Every valuation model relies on assumptions about the future that are, by definition, uncertain. While a single target price suggests precision, it often masks the risks inherent in the underlying estimates. Sensitivity analysis is the process of testing how changes in key variables, such as growth rates or discount rates, affect a company’s final value.
The purpose of this analysis is to replace a single point estimate with a range of possible outcomes. By understanding which variables drive the most significant changes in value, you can focus your research on the factors that matter most to your returns.
Sensitivity analysis helps you identify stocks that might be “priced for perfection” where a small miss in revenue growth can lead to a massive decline in intrinsic value. Mastering this technique allows you to move beyond simple spreadsheets and toward a sophisticated understanding of investment probability.
Find out what a stock’s really worth in under 60 seconds with TIKR’s new Valuation Model (It’s free)>>>
Identifying Critical Value Drivers
Not every line item in a financial statement has an equal impact on a company’s valuation. This section is included because you must first determine which variables are the most “sensitive” before you can test them. For most businesses, the primary drivers are terminal growth rates, weighted average cost of capital (WACC), and long-term operating margins.
In a software company, a small change in retention rates or customer acquisition costs might swing the valuation by 30%. For a capital-intensive manufacturer, factory utilization or raw material costs often carry more weight. Identifying these levers ensures that your sensitivity analysis reflects the specific economic reality of the industry you are studying.
Once you identify these drivers, you can observe how they have fluctuated historically to set realistic boundaries for your testing. If a company’s operating margin has never exceeded 15% in twenty years, testing a 25% margin scenario provides little practical value. Using historical data to inform your sensitivity ranges keeps your analysis grounded in reality rather than optimism.

TIKR Tip: Use the Detailed Financials in TIKR to review 10 years of historical margins and revenue growth to establish realistic “base case” and “worst case” scenarios for your model inputs.
Review a stock’s net income and margins instantly (Free with TIKR) >>>
Constructing Sensitivity Tables for Multiple Variables
A sensitivity table, often called a data table, allows you to visualize how two variables interact to change a stock’s value simultaneously. This section explains why testing variables in isolation is often insufficient. In the real world, a decline in revenue growth often coincides with a contraction in margins, creating a compounding effect on valuation.
The most common table crosses the discount rate with the terminal growth rate. This grid shows you exactly what the company is worth if interest rates rise or if the industry matures faster than expected. It helps you identify the “valuation floor” at which the stock becomes attractive even under pessimistic assumptions.
These tables act as a stress test for your investment thesis. If the current market price sits at the very top of your sensitivity grid, the market is assuming the best possible outcome for both variables. If the price sits near the bottom, the market may be providing you with a significant margin of safety. This visual representation makes it easier to communicate a stock’s risk-reward profile.

TIKR Tip: Check the Estimates tab in TIKR to see the high and low range of analyst forecasts, which can serve as the vertical and horizontal axes for your sensitivity tables.
Look up forward estimates for any stock in less than 60 seconds with TIKR (It’s free) >>>
Evaluating the Impact of Margin Volatility
Operating margins often represent the most volatile component of a valuation model. This section is included because even minor efficiency shifts can lead to large swings in free cash flow. Sensitivity analysis allows you to model how a business handles inflationary pressures or competitive pricing wars.
You should test scenarios in which margins revert to historical means or remain at recent peaks. Many investors get caught in “value traps” because they assume recent margin expansion is permanent. Testing a “mean reversion” scenario helps you determine whether the current stock price requires record-breaking efficiency to remain afloat.
By modeling different margin levels, you can determine if the company possesses a genuine competitive moat. A business with a strong moat should maintain its value even if margins contract slightly. If a one-percent drop in margin destroys a significant portion of the company’s intrinsic value, the business may lack the pricing power necessary to protect its capital over the long term.
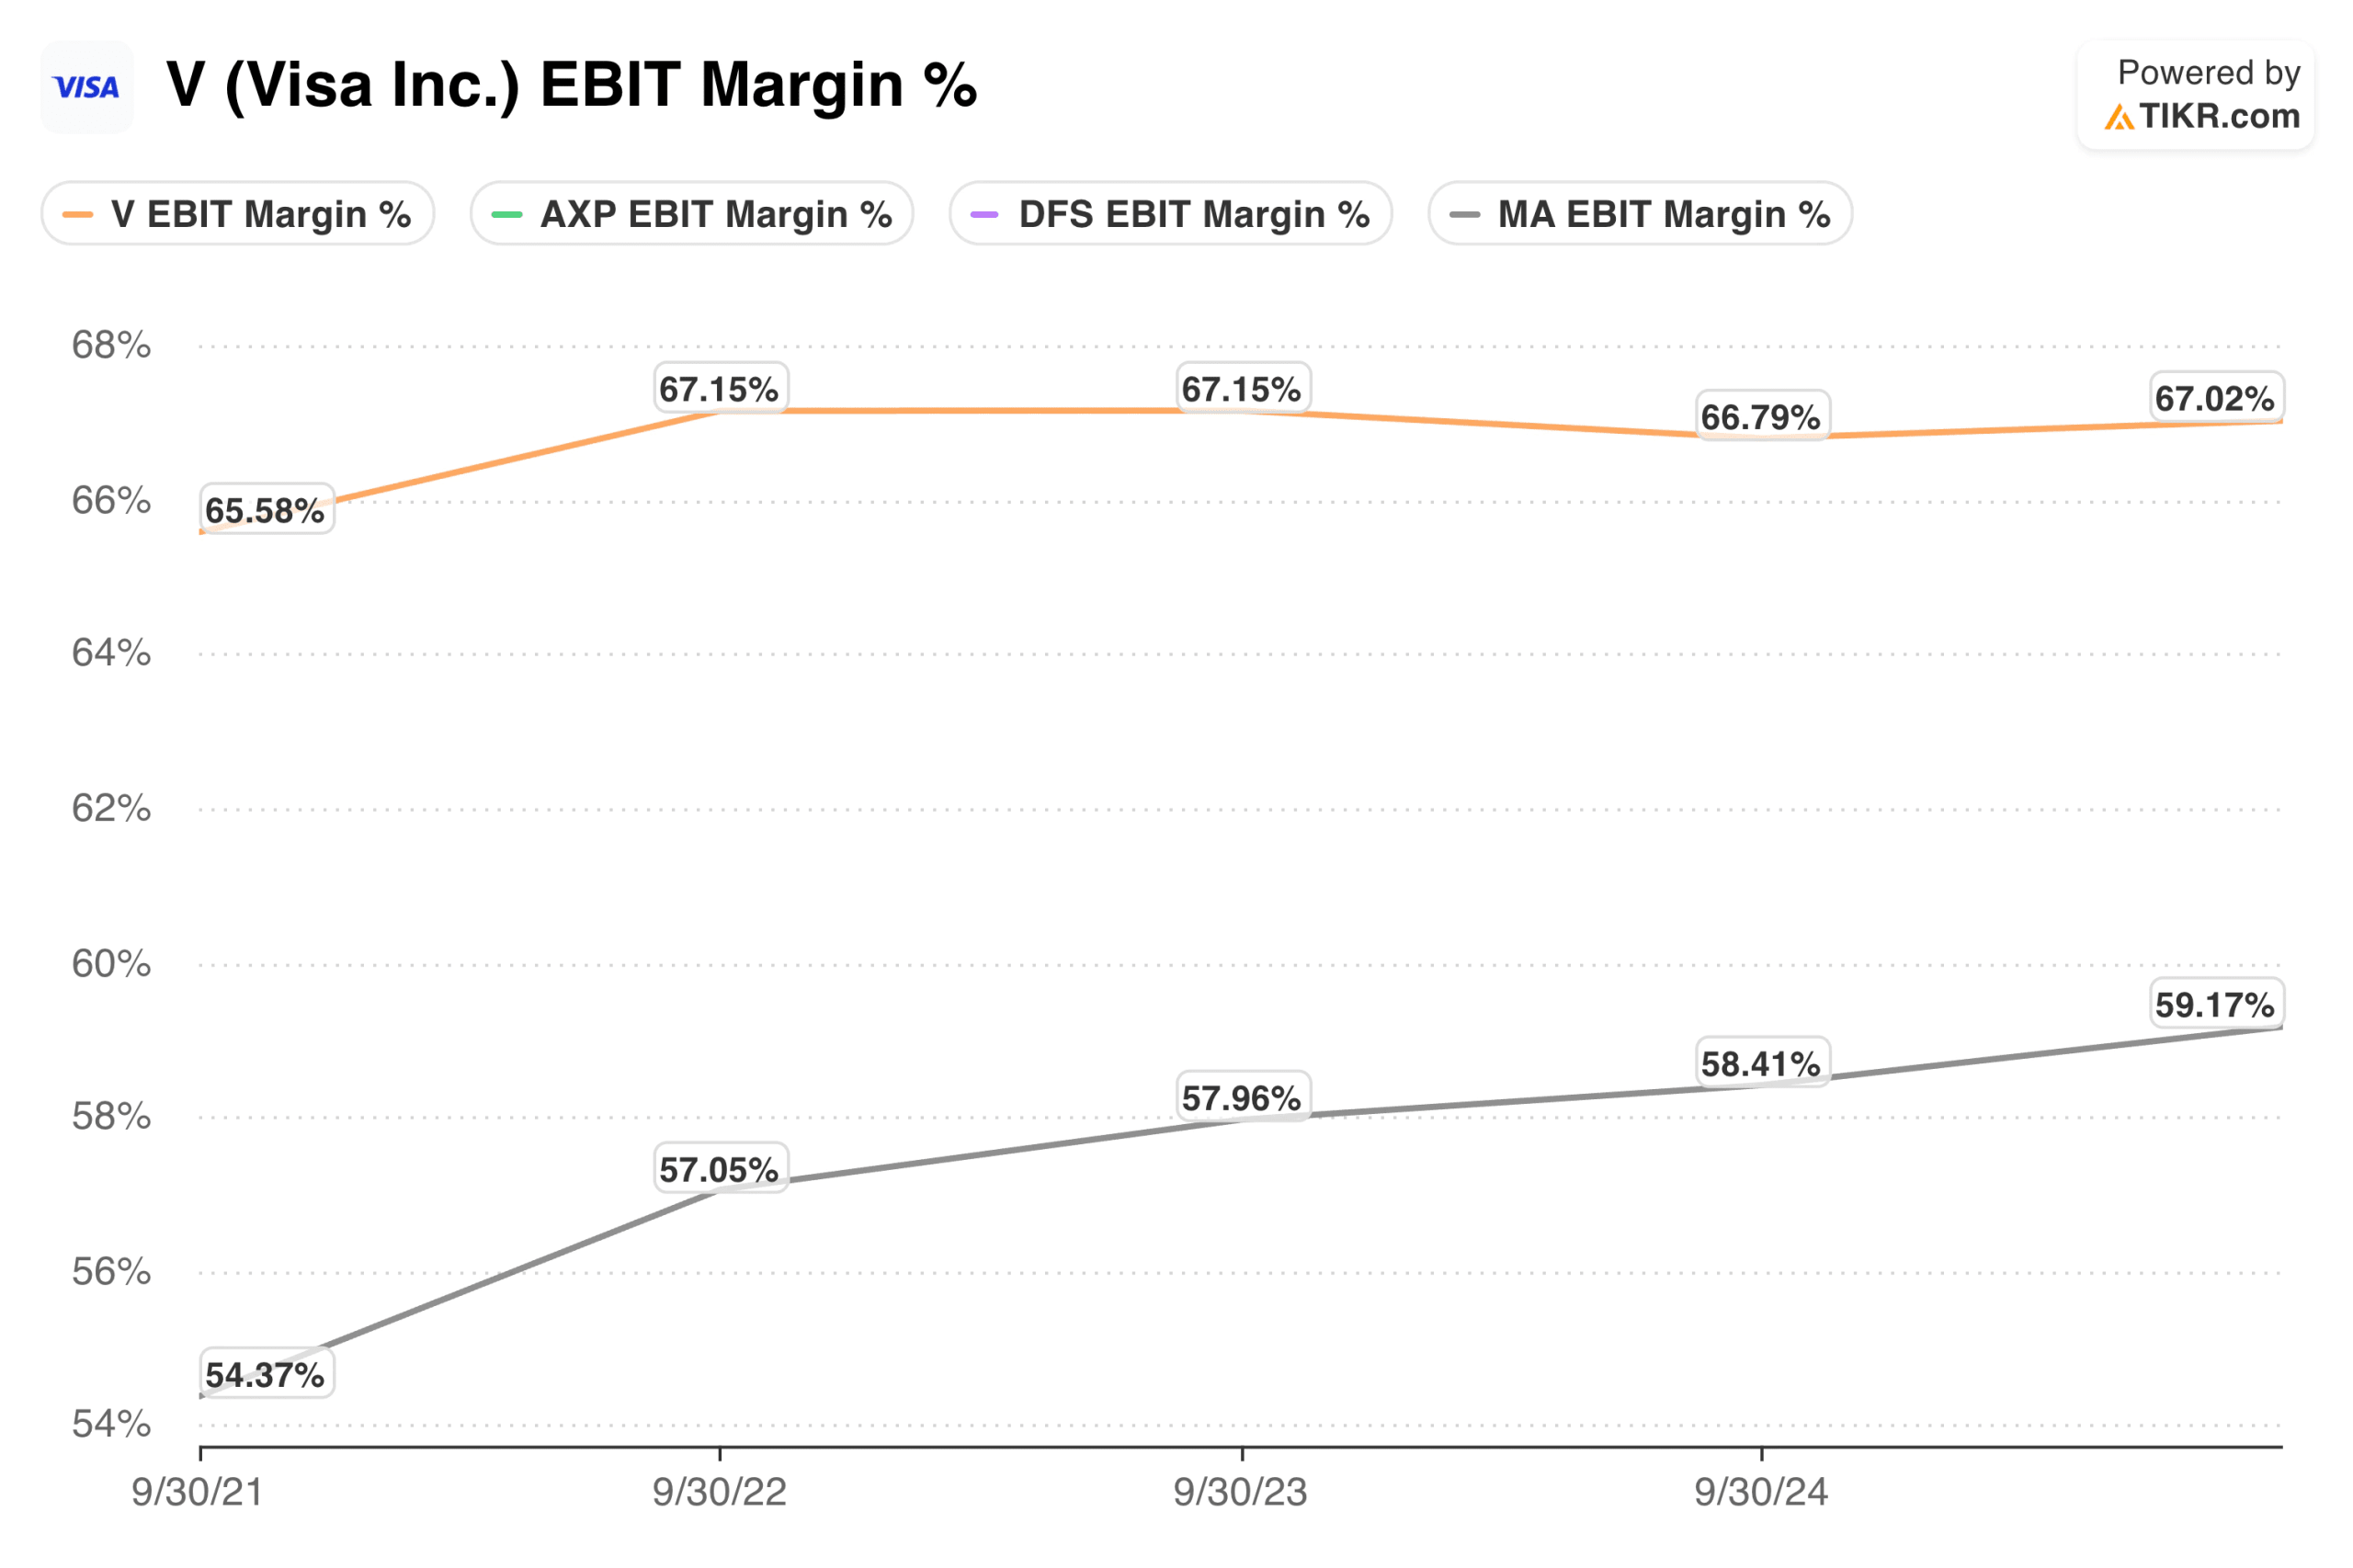
TIKR Tip: Use the Ratios section to compare EBIT Margins across the industry. Benchmarking against peers like Crown Castle (CCI) and SBA Communications (SBAC) ensures your “best case” profitability assumptions are grounded in competitive reality.
Get the most up-to-date margin information on 100K+ global stocks with TIKR (It’s free) >>>
Interpreting the Range of Outcomes
The final step is translating the results of your sensitivity analysis into a concrete investment decision. This section is essential because it helps you define your “conviction zone.” A wide range of outcomes indicates a high-risk investment, with the future difficult to predict. A narrow range suggests a stable, predictable business with a more limited downside.
A high-quality investment typically has a current price below most values in your sensitivity table. This indicates that even if several of your assumptions prove slightly wrong, you are still likely to earn a positive return. This “probabilistic” way of thinking protects you from the overconfidence that often leads to permanent capital loss.
Ultimately, sensitivity analysis is about preparation, not prediction. It prepares you for market volatility by showing you in advance how the stock should react to changing fundamental conditions. When you know the valuation impact of a growth slowdown before it happens, you can react with discipline rather than emotion when the news breaks.

TIKR Tip: Use TIKR’s Valuation section to see how the stock’s multiple has historically reacted to changes in growth, providing a real-world check on your sensitivity model’s outputs.
Track company multiples to quickly review pricing power with TIKR (It’s free) >>>
The TIKR Takeaway
Sensitivity analysis turns a static valuation into a dynamic tool for risk management. By testing your most important assumptions, you identify the specific conditions under which an investment succeeds or fails. This process ensures you never rely on a single “perfect” forecast and instead build a portfolio grounded in a clear understanding of the margin of safety.
The best investors prioritize businesses that remain valuable across a wide range of scenarios. When the gap between the market price and your range of outcomes is wide, you have found a high-probability opportunity. TIKR provides the historical depth and forward-looking estimates you need to build these stress tests and invest with confidence.
Find undervalued stocks in less than 60 seconds with TIKR’s new Valuation Model (It’s free) >>>
Value Any Stock in Under 60 Seconds with TIKR
With TIKR’s new Valuation Model tool, you can estimate a stock’s potential share price in under a minute.
All it takes is three simple inputs:
- Revenue Growth
- Operating Margins
- Exit P/E Multiple
If you’re not sure what to enter, TIKR automatically fills in each input using analysts’ consensus estimates, giving you a quick, reliable starting point.
From there, TIKR calculates the potential share price and total returns under Bull, Base, and Bear scenarios so you can quickly see whether a stock looks undervalued or overvalued.
See a stock’s true value in under 60 seconds (Free with TIKR) >>>
Looking for New Opportunities?
- Discover which stocks billionaire investors are purchasing, so you can follow the smart money.
- Analyze stocks in as little as 5 minutes with TIKR’s all-in-one, easy-to-use platform.
- The more rocks you overturn… the more opportunities you’ll uncover. Search 100K+ global stocks, global top investor holdings, and more with TIKR.
Disclaimer:
Please note that the articles on TIKR are not intended to serve as investment or financial advice from TIKR or our content team, nor are they recommendations to buy or sell any stocks. We create our content based on TIKR Terminal’s investment data and analysts’ estimates. Our analysis might not include recent company news or important updates. TIKR has no position in any stocks mentioned. Thank you for reading, and happy investing!