Capital allocation determines whether a company builds value or destroys it over time. Every dollar of profit presents management with choices: reinvest in the business, acquire other companies, pay down debt, repurchase shares, or distribute dividends. The cumulative result of these decisions shapes long-term shareholder returns more than almost any other factor.
Yet most investors focus on earnings growth while ignoring how management deploys the cash those earnings generate. They assume profitable companies automatically create value.
This assumption fails when management squanders profits on overpriced acquisitions or on projects that earn returns below the cost of capital. Spending an hour or two studying how a company allocates capital can often be one of the most useful exercises an investor can do.
Examine Where the Cash Goes
Management teams choose from five primary uses of capital: reinvesting in the business, making acquisitions, paying down debt, repurchasing shares, and paying dividends. Each choice carries different implications for shareholders. Understanding the mix reveals management’s priorities and philosophy.
Track the pattern over multiple years rather than any single period. A company that consistently reinvests 60% of cash flow in high-return projects operates differently from one that acquires competitors or returns most cash through buybacks. Neither approach is inherently superior, but the pattern should match the company’s opportunities and competitive position.
Watch for shifts in allocation that signal changing circumstances. A company that historically reinvested heavily but now emphasizes buybacks may have exhausted attractive growth opportunities, which might be a concern for companies like Applied Digital (APLD). One that suddenly pursues large acquisitions after years of organic growth may be responding to competitive pressure or management ambition.
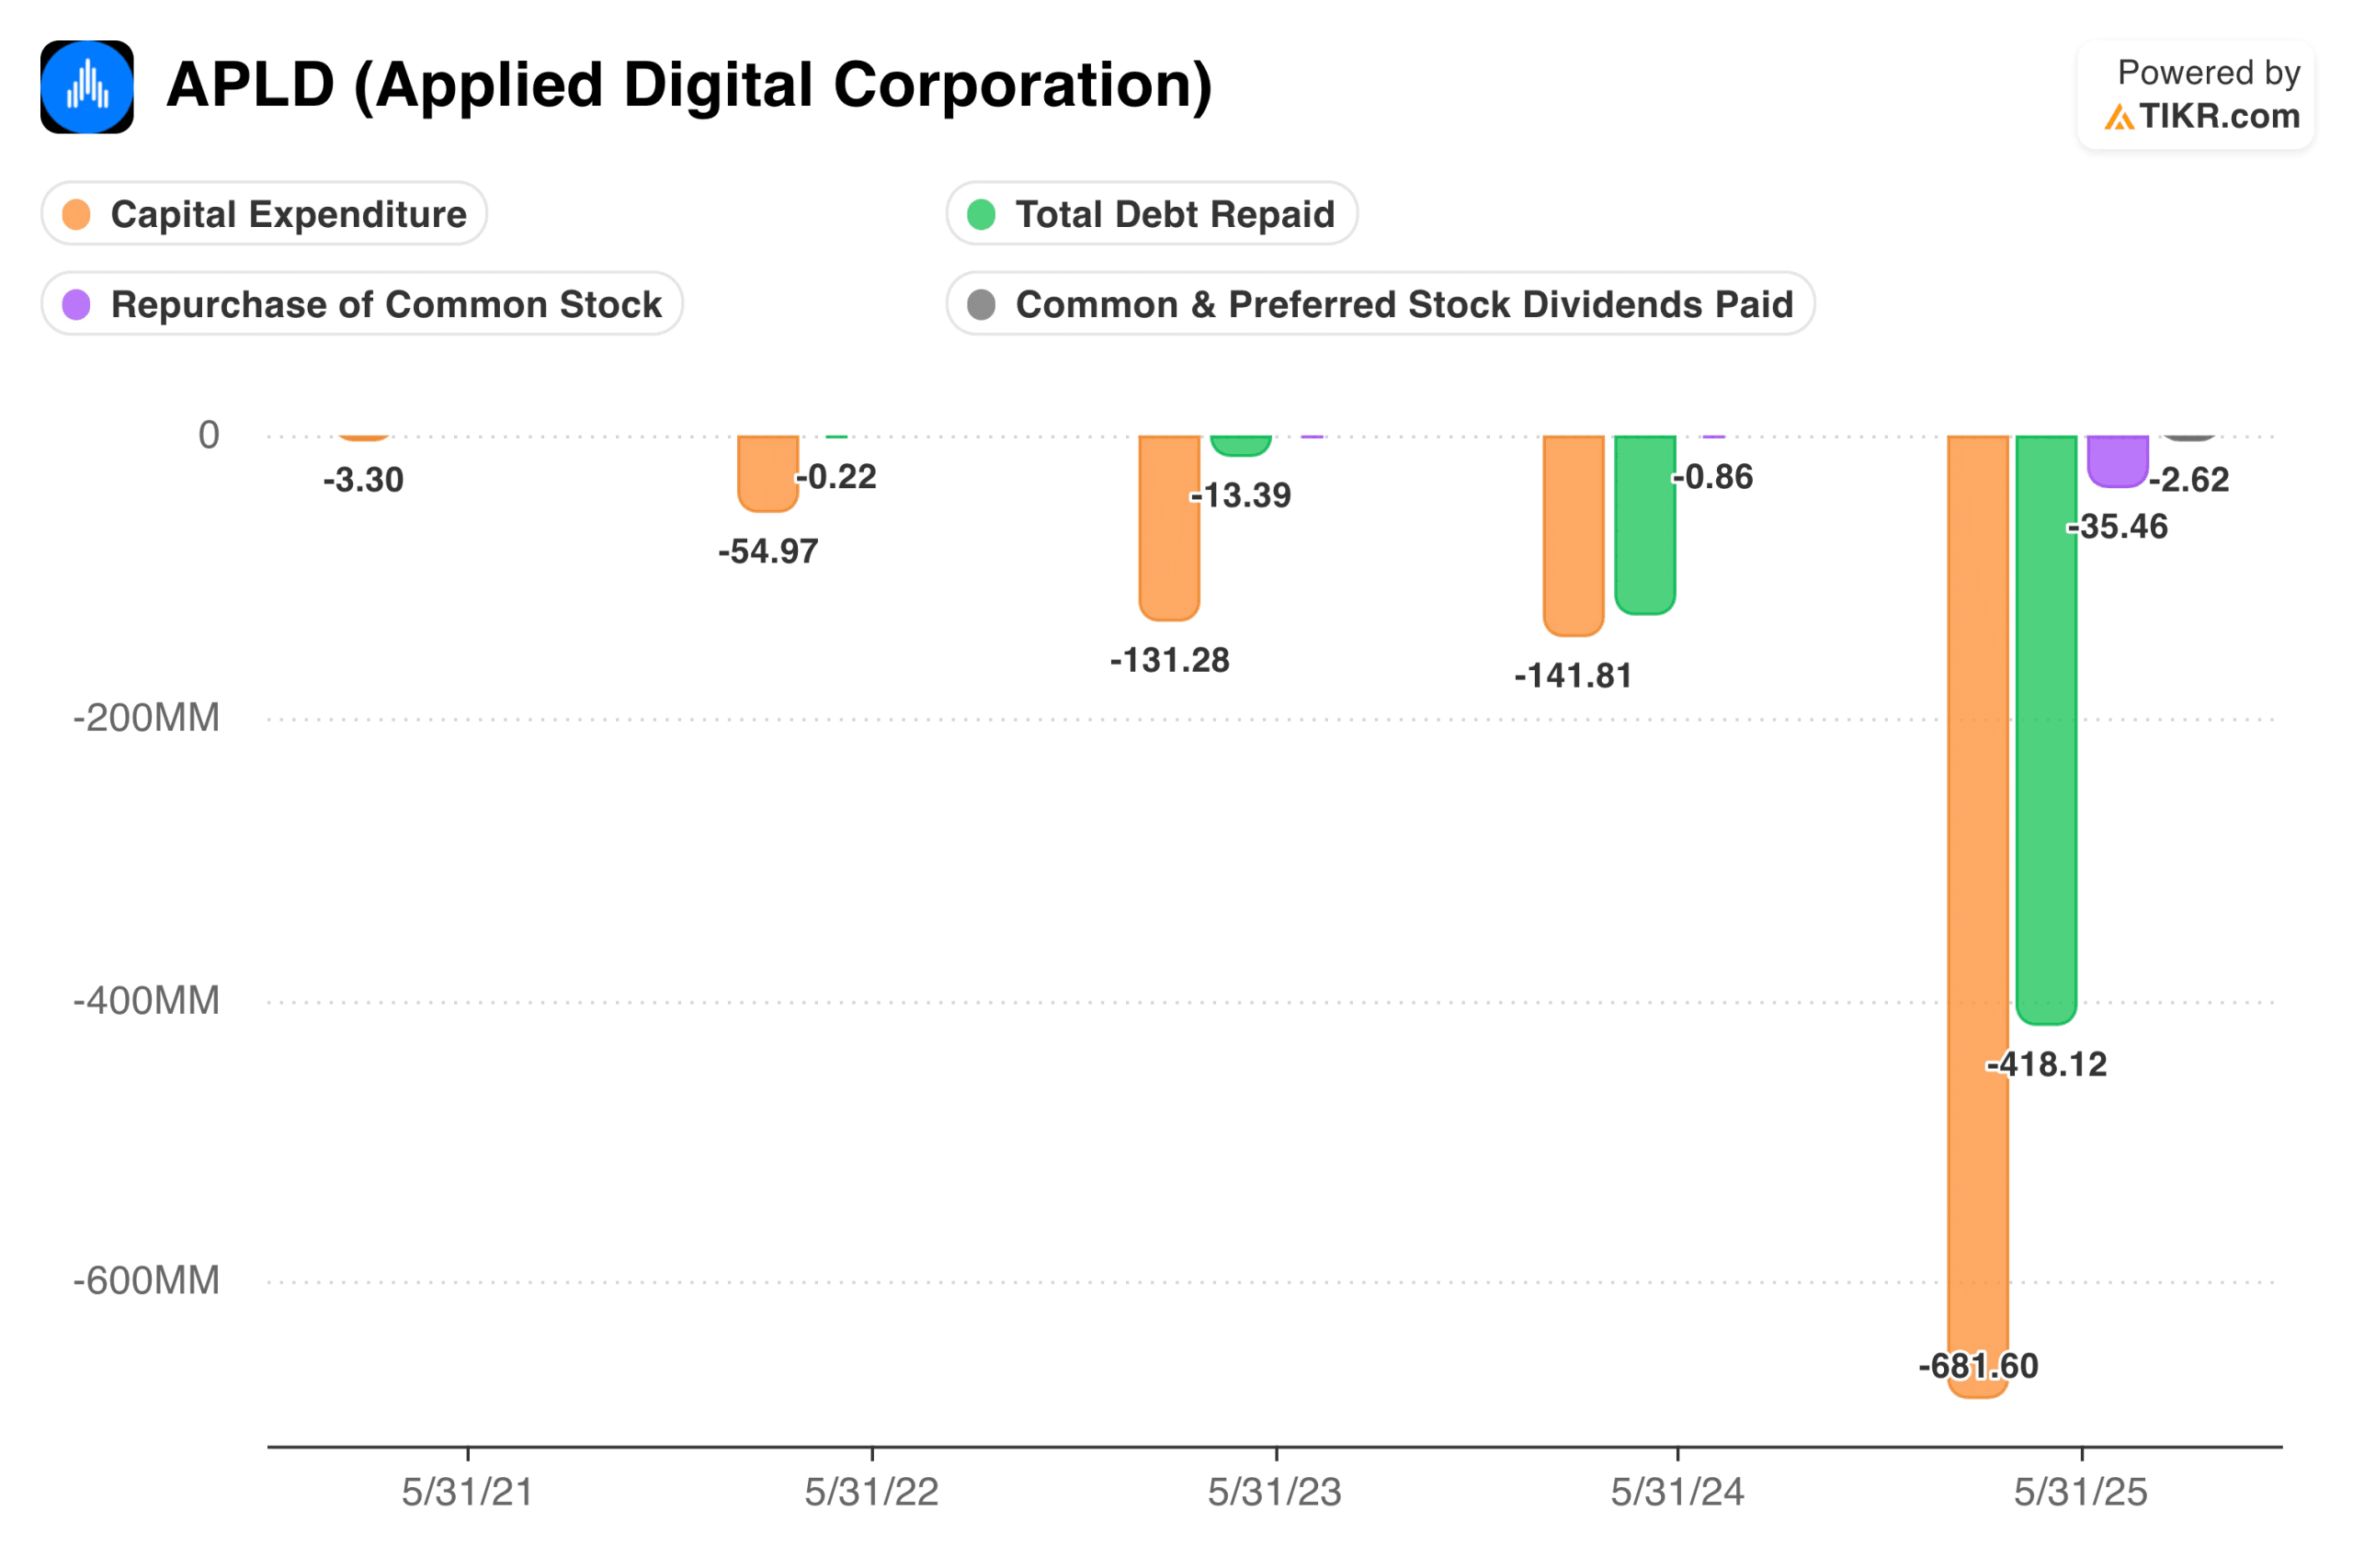
TIKR tip: Review the Cash Flow Statement in TIKR’s Detailed Financials to see capital expenditures, acquisitions, debt payments, repurchases, and dividends as separate line items showing exactly where money goes each year.
Evaluate a company’s capital expenditure and total debt repaid instantly (Free with TIKR) >>>
Evaluate Returns on Reinvestment
Internal reinvestment creates value only when projects earn returns above the cost of capital. A company that spends $500 million annually on growth initiatives that deliver 20% returns creates substantial value. One spends the same amount on projects, earning 6%, and destroys it despite identical investment levels.
Compare ROC trends to capital expenditure levels over time. Rising investment, accompanied by stable or improving returns, suggests that management identifies and executes strong projects. Rising investment with declining returns suggests management is chasing growth regardless of economics or has exhausted attractive opportunities.
Examine whether management communicates return targets for major investments and whether those targets are met. Leaders who set specific hurdle rates and report against them demonstrate discipline. Those who speak vaguely about “strategic investments” without quantifying expected returns often lack the rigor that separates value creation from value destruction.
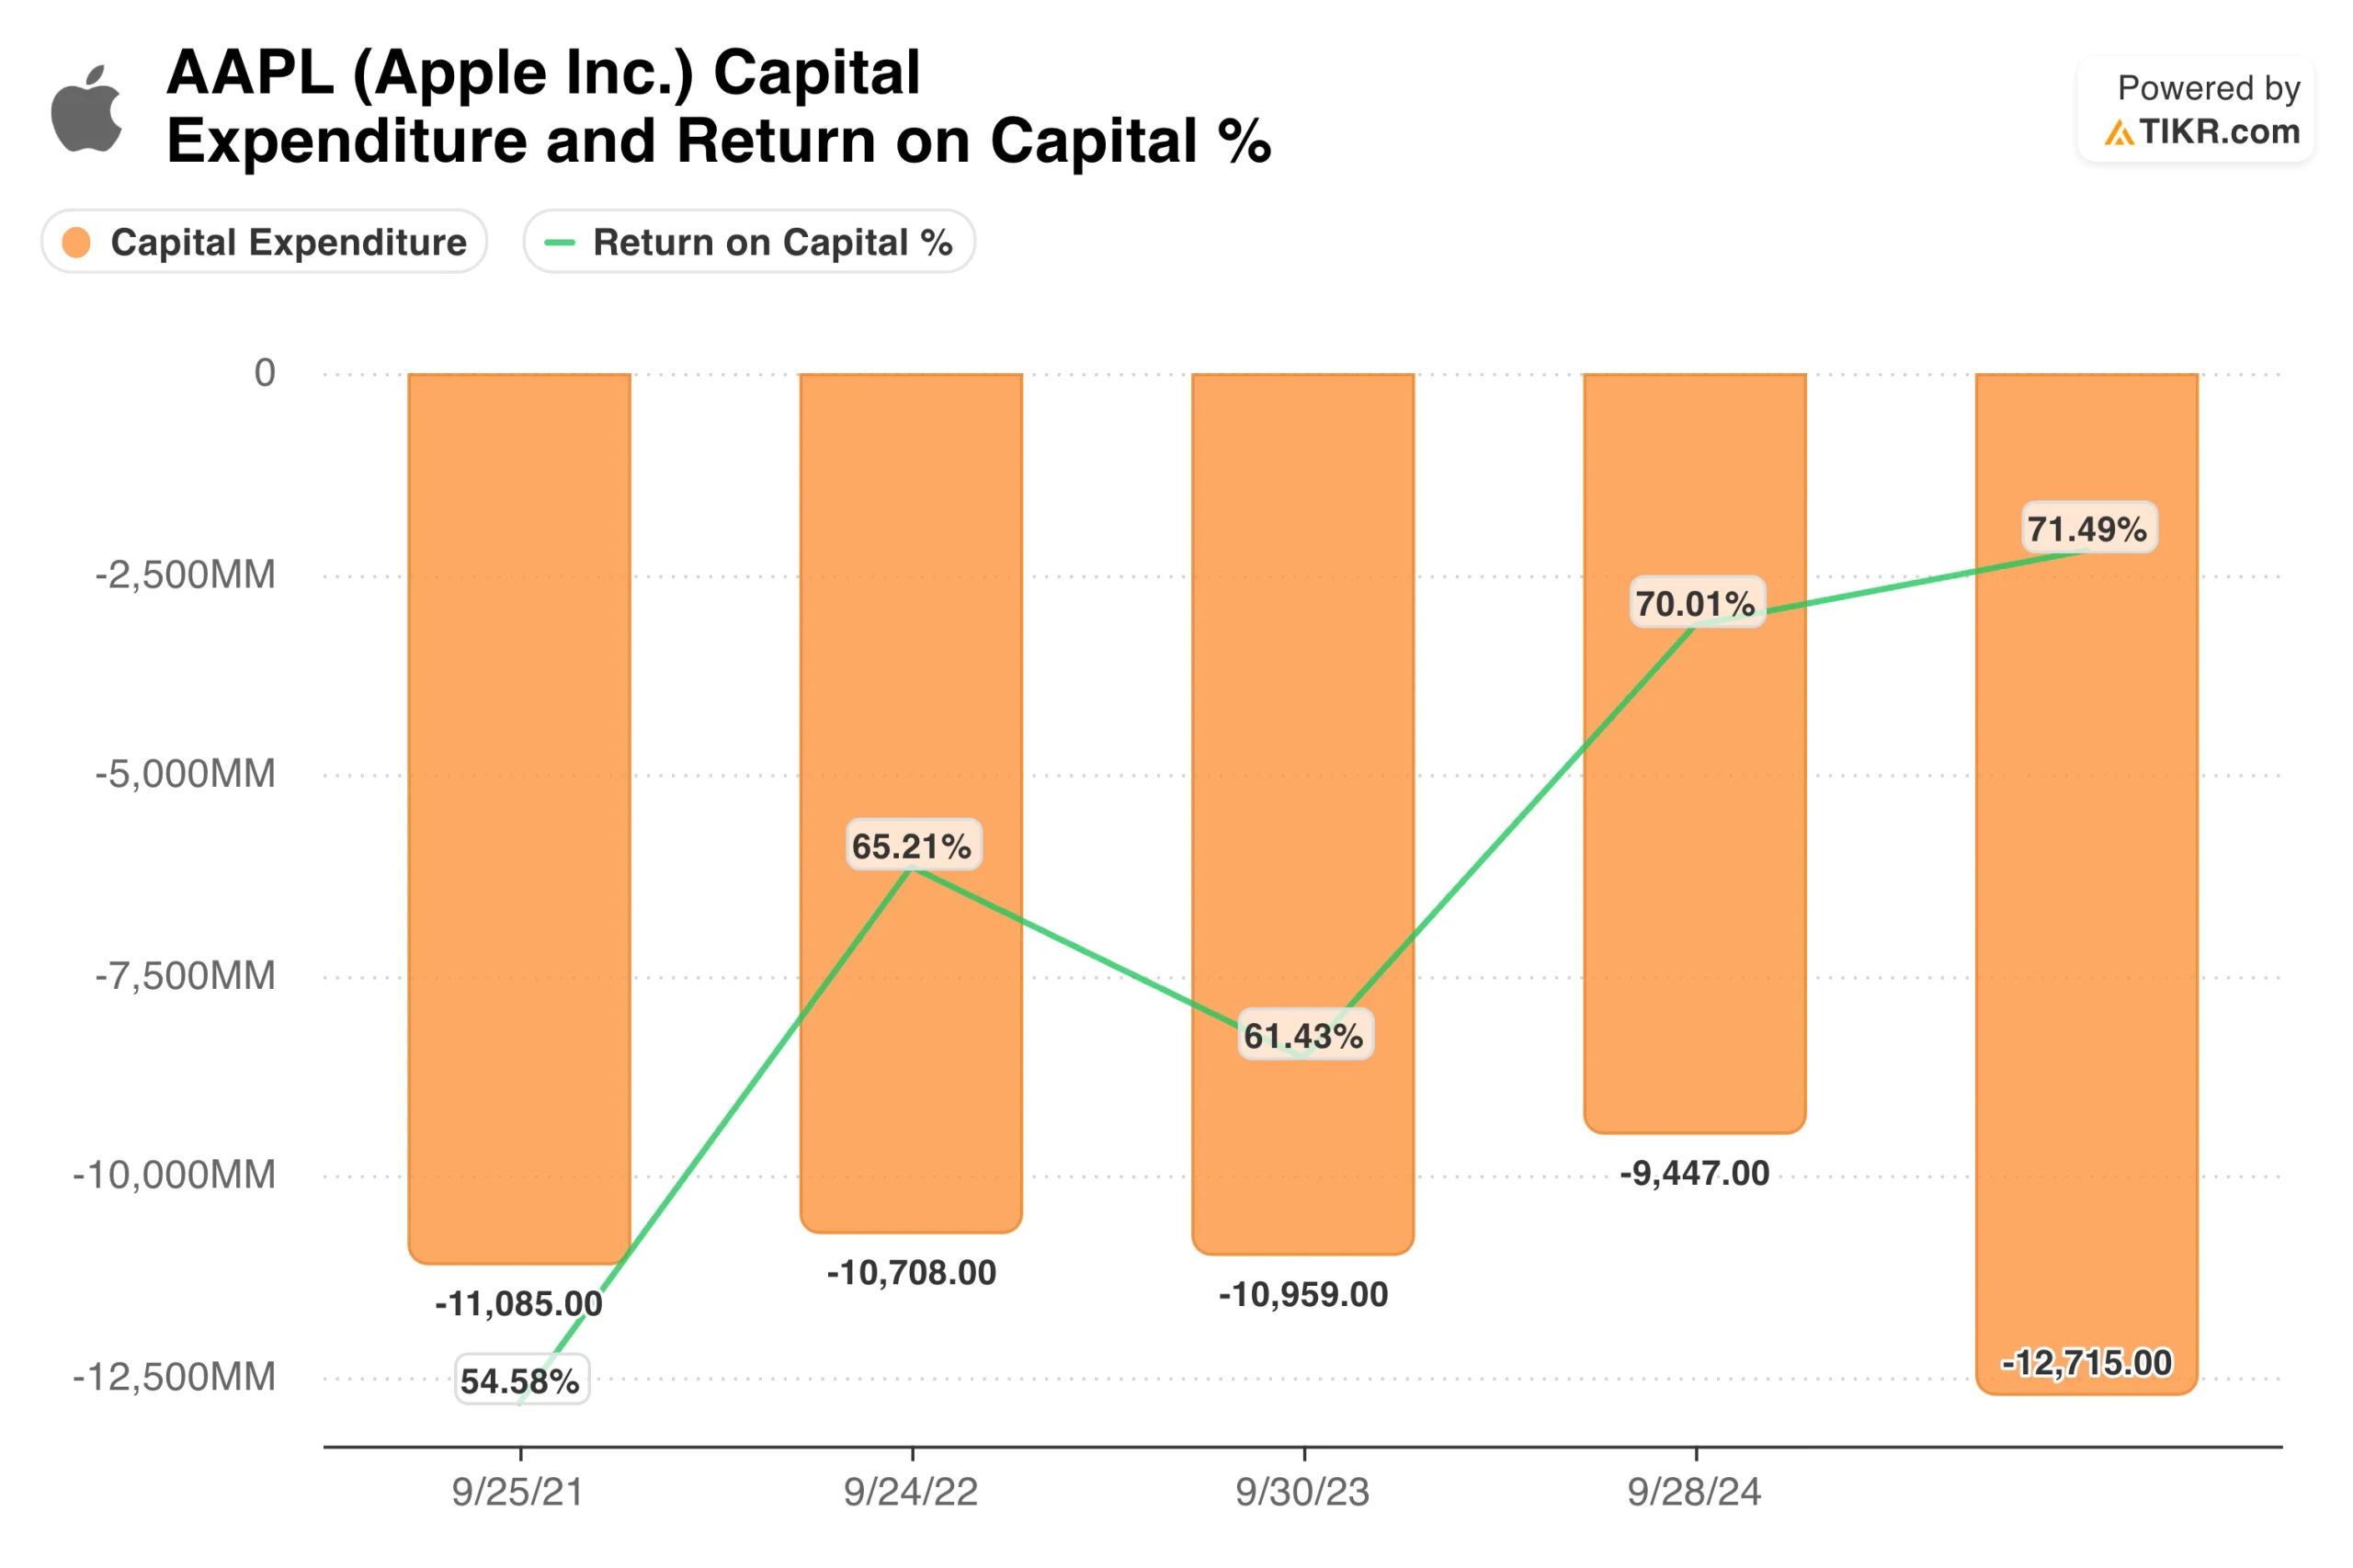
TIKR tip: Track ROC alongside capital expenditure trends in TIKR’s Detailed Financials under Ratios. Sustained high returns despite continued investment signals that management allocates reinvestment capital effectively, something that Apple (AAPL) seems to do very effectively, and is a prime market example.
Value any stock in less than 60 seconds with TIKR’s new Valuation Model (It’s free) >>>
Scrutinize the Acquisition Record
Acquisitions serve as the ultimate test of capital allocation discipline. Deals can accelerate growth and provide entry into new markets, but they carry high risks of overpayment and integration failure. M&A is frequently where the largest amounts of shareholder capital are multiplied or destroyed.
Evaluate deals made five or more years ago to assess whether they created value. Did acquired businesses grow revenue and improve margins? Did integration proceed smoothly? Or did the company eventually write down goodwill and quietly acknowledge failure? Serial acquirers with histories of write-downs have demonstrated poor judgment that typically persists.
Compare acquisition spending to organic investment over time. Companies that grow primarily through acquisition often struggle to integrate effectively and overpay in competitive deal processes. Those that acquire selectively, emphasizing organic growth, tend to create more value per dollar deployed.
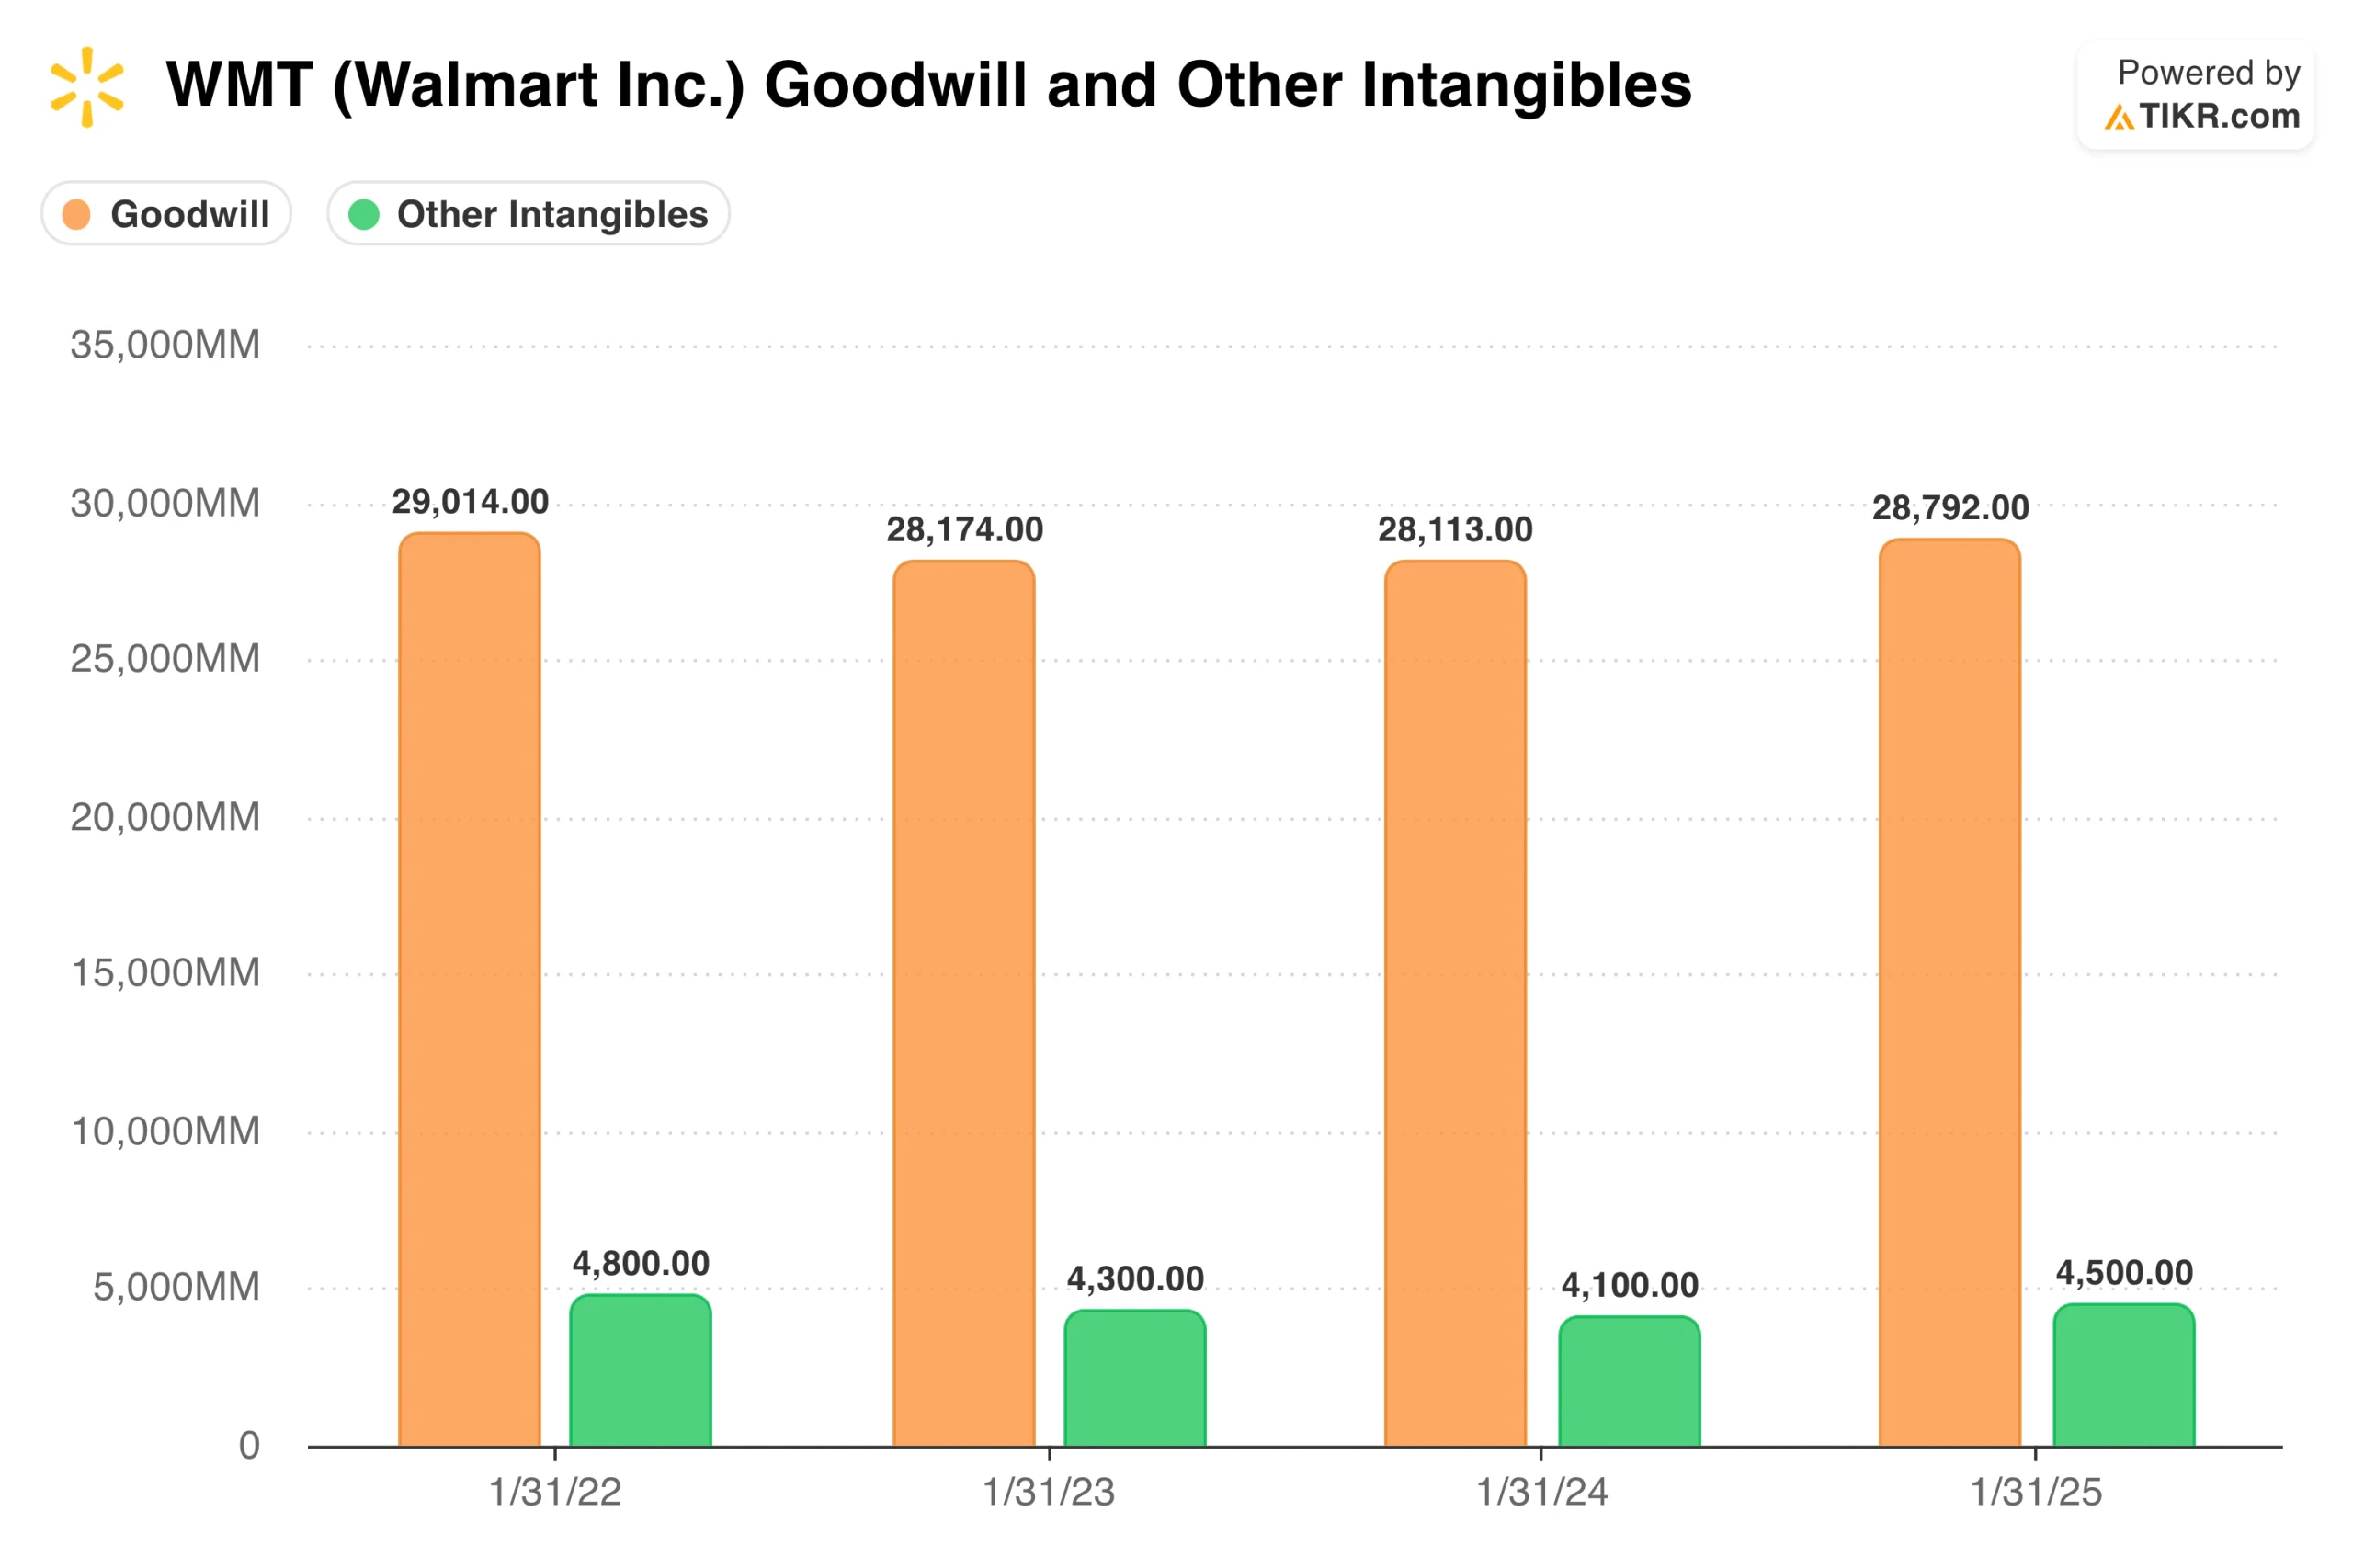
TIKR tip: Review goodwill and intangible assets on the Balance Sheet in TIKR’s Detailed Financials. A steadily growing goodwill balance indicates acquisition-driven growth, while write-downs reveal deals that failed to deliver. These numbers should be of note to Walmart (WMT) investors, who appear more balanced than growing.
Assess Buyback and Dividend Discipline
Share repurchases and dividends return capital directly to shareholders but require different forms of discipline. Buybacks create value only when executed below intrinsic value. Dividends provide certainty but remove flexibility to pursue opportunities.
Examine whether the share count actually declines over time. Many companies announce large buyback programs while share count stays flat because repurchases merely offset stock compensation dilution. A shrinking share count confirms that buybacks genuinely return capital rather than subsidize employee pay.
Evaluate buyback timing relative to stock price. Management teams that repurchase aggressively when prices are high and stop when prices fall systematically destroy value. Those who accelerate purchases during weakness and slow them during strength demonstrate the discipline that creates value.

TIKR tip: Track shares outstanding over multiple years in TIKR’s Detailed Financials. Declining share count confirms that buybacks reduce dilution rather than merely offset stock-based compensation, a pattern that Microsoft (MSFT) appears to be moving in the right direction, albeit slowly.
Track outstanding share numbers to quickly review share buybacks with TIKR (It’s free) >>>
The TIKR Takeaway
Capital allocation separates management teams that build value from those that destroy it. The analysis requires examining where cash goes, what returns reinvestment generates, whether acquisitions create or destroy value, and how disciplined buyback and dividend programs are executed.
TIKR provides the historical data to evaluate these decisions systematically. Cash Flow Statements reveal allocation patterns over time. ROC trends show whether reinvestment earns adequate returns. Balance Sheet data exposes acquisition outcomes through goodwill levels and write-downs. Share count history confirms whether buybacks actually benefit shareholders. Together, these tools help you identify management teams whose capital allocation decisions compound value over time.
Find undervalued stocks in less than 60 seconds with TIKR’s new Valuation Model (It’s free) >>>
Value Any Stock in Under 60 Seconds with TIKR
With TIKR’s new Valuation Model tool, you can estimate a stock’s potential share price in under a minute.
All it takes is three simple inputs:
- Revenue Growth
- Operating Margins
- Exit P/E Multiple
If you’re not sure what to enter, TIKR automatically fills in each input using analysts’ consensus estimates, giving you a quick, reliable starting point.
From there, TIKR calculates the potential share price and total returns under Bull, Base, and Bear scenarios so you can quickly see whether a stock looks undervalued or overvalued.
See a stock’s true value in under 60 seconds (Free with TIKR) >>>
Looking for New Opportunities?
- Discover which stocks billionaire investors are purchasing, so you can follow the smart money.
- Analyze stocks in as little as 5 minutes with TIKR’s all-in-one, easy-to-use platform.
- The more rocks you overturn… the more opportunities you’ll uncover. Search 100K+ global stocks, global top investor holdings, and more with TIKR.
Disclaimer:
Please note that the articles on TIKR are not intended to serve as investment or financial advice from TIKR or our content team, nor are they recommendations to buy or sell any stocks. We create our content based on TIKR Terminal’s investment data and analysts’ estimates. Our analysis might not include recent company news or important updates. TIKR has no position in any stocks mentioned. Thank you for reading, and happy investing!