
Valuation multiples are the most common shorthand for assessing whether a stock is cheap or expensive. Price-to-earnings, EV-to-EBITDA, price-to-sales, and several other ratios aim to quantify the extent to which investors are paying relative to measures of business performance.
The problem is that different multiples tell different stories, and using the wrong one for a particular business can lead to wildly misleading conclusions.
A software company and a bank might both trade at 15x earnings, but that comparison is nearly meaningless. The software company might look expensive on a price-to-book basis but cheap on an EV-to-sales basis.
The bank might look cheap on a price-to-book basis but expensive on a price-to-deposits basis. Each multiple captures a different aspect of value, and each has blind spots that can obscure rather than illuminate the true picture.
Find out what a stock’s really worth in under 60 seconds with TIKR’s new Valuation Model (It’s free)>>>
Choosing the right multiple requires understanding what each one measures, why it matters for specific types of businesses, and what distortions can make even the appropriate multiple misleading.
A multiple that works perfectly for one industry might be useless for another. A multiple that provides clarity for mature businesses might confuse the picture for high-growth companies. The goal is to match the valuation tool to the specific characteristics of the business you are analyzing.
This guide explains the major valuation multiples, when each applies, the pitfalls to avoid, and how to use TIKR to compare companies using the metrics that matter most to their specific situations.
Why the Right Multiple Matters
Using the wrong multiple can make a cheap stock look expensive or an expensive stock look cheap. A capital-intensive industrial company might appear overvalued on price-to-book because its assets are depreciated well below replacement cost. A high-growth software company might appear absurdly expensive on trailing P/E because current earnings are suppressed by investment in growth. In both cases, the multiple is technically accurate but practically useless for making investment decisions.
The right multiple aligns with how the business creates value. For asset-heavy businesses, book value and tangible assets matter because the company’s earning power derives from its physical capital base. For asset-light businesses, earnings and cash flow matter more because the company’s value comes from its ability to generate profits without tying up capital. For unprofitable but growing businesses, revenue may be the only meaningful anchor until the company reaches scale.
Industry conventions exist for good reasons. Financial analysts covering a sector converge on particular multiples because those metrics best capture what drives value in that industry. Retail investors who ignore these conventions and apply generic multiples across all businesses miss important context. A bank trading at 1.2x book value means something very different than a software company at the same multiple.
The comparison set also matters. A multiple is only meaningful relative to something: the company’s own history, its competitors, or the broader market. Using the right multiple ensures the comparison is apples-to-apples. Comparing a capital-intensive manufacturer to a software company on EV-to-EBITDA ignores that one requires ongoing reinvestment, while the other converts nearly all EBITDA into free cash flow.
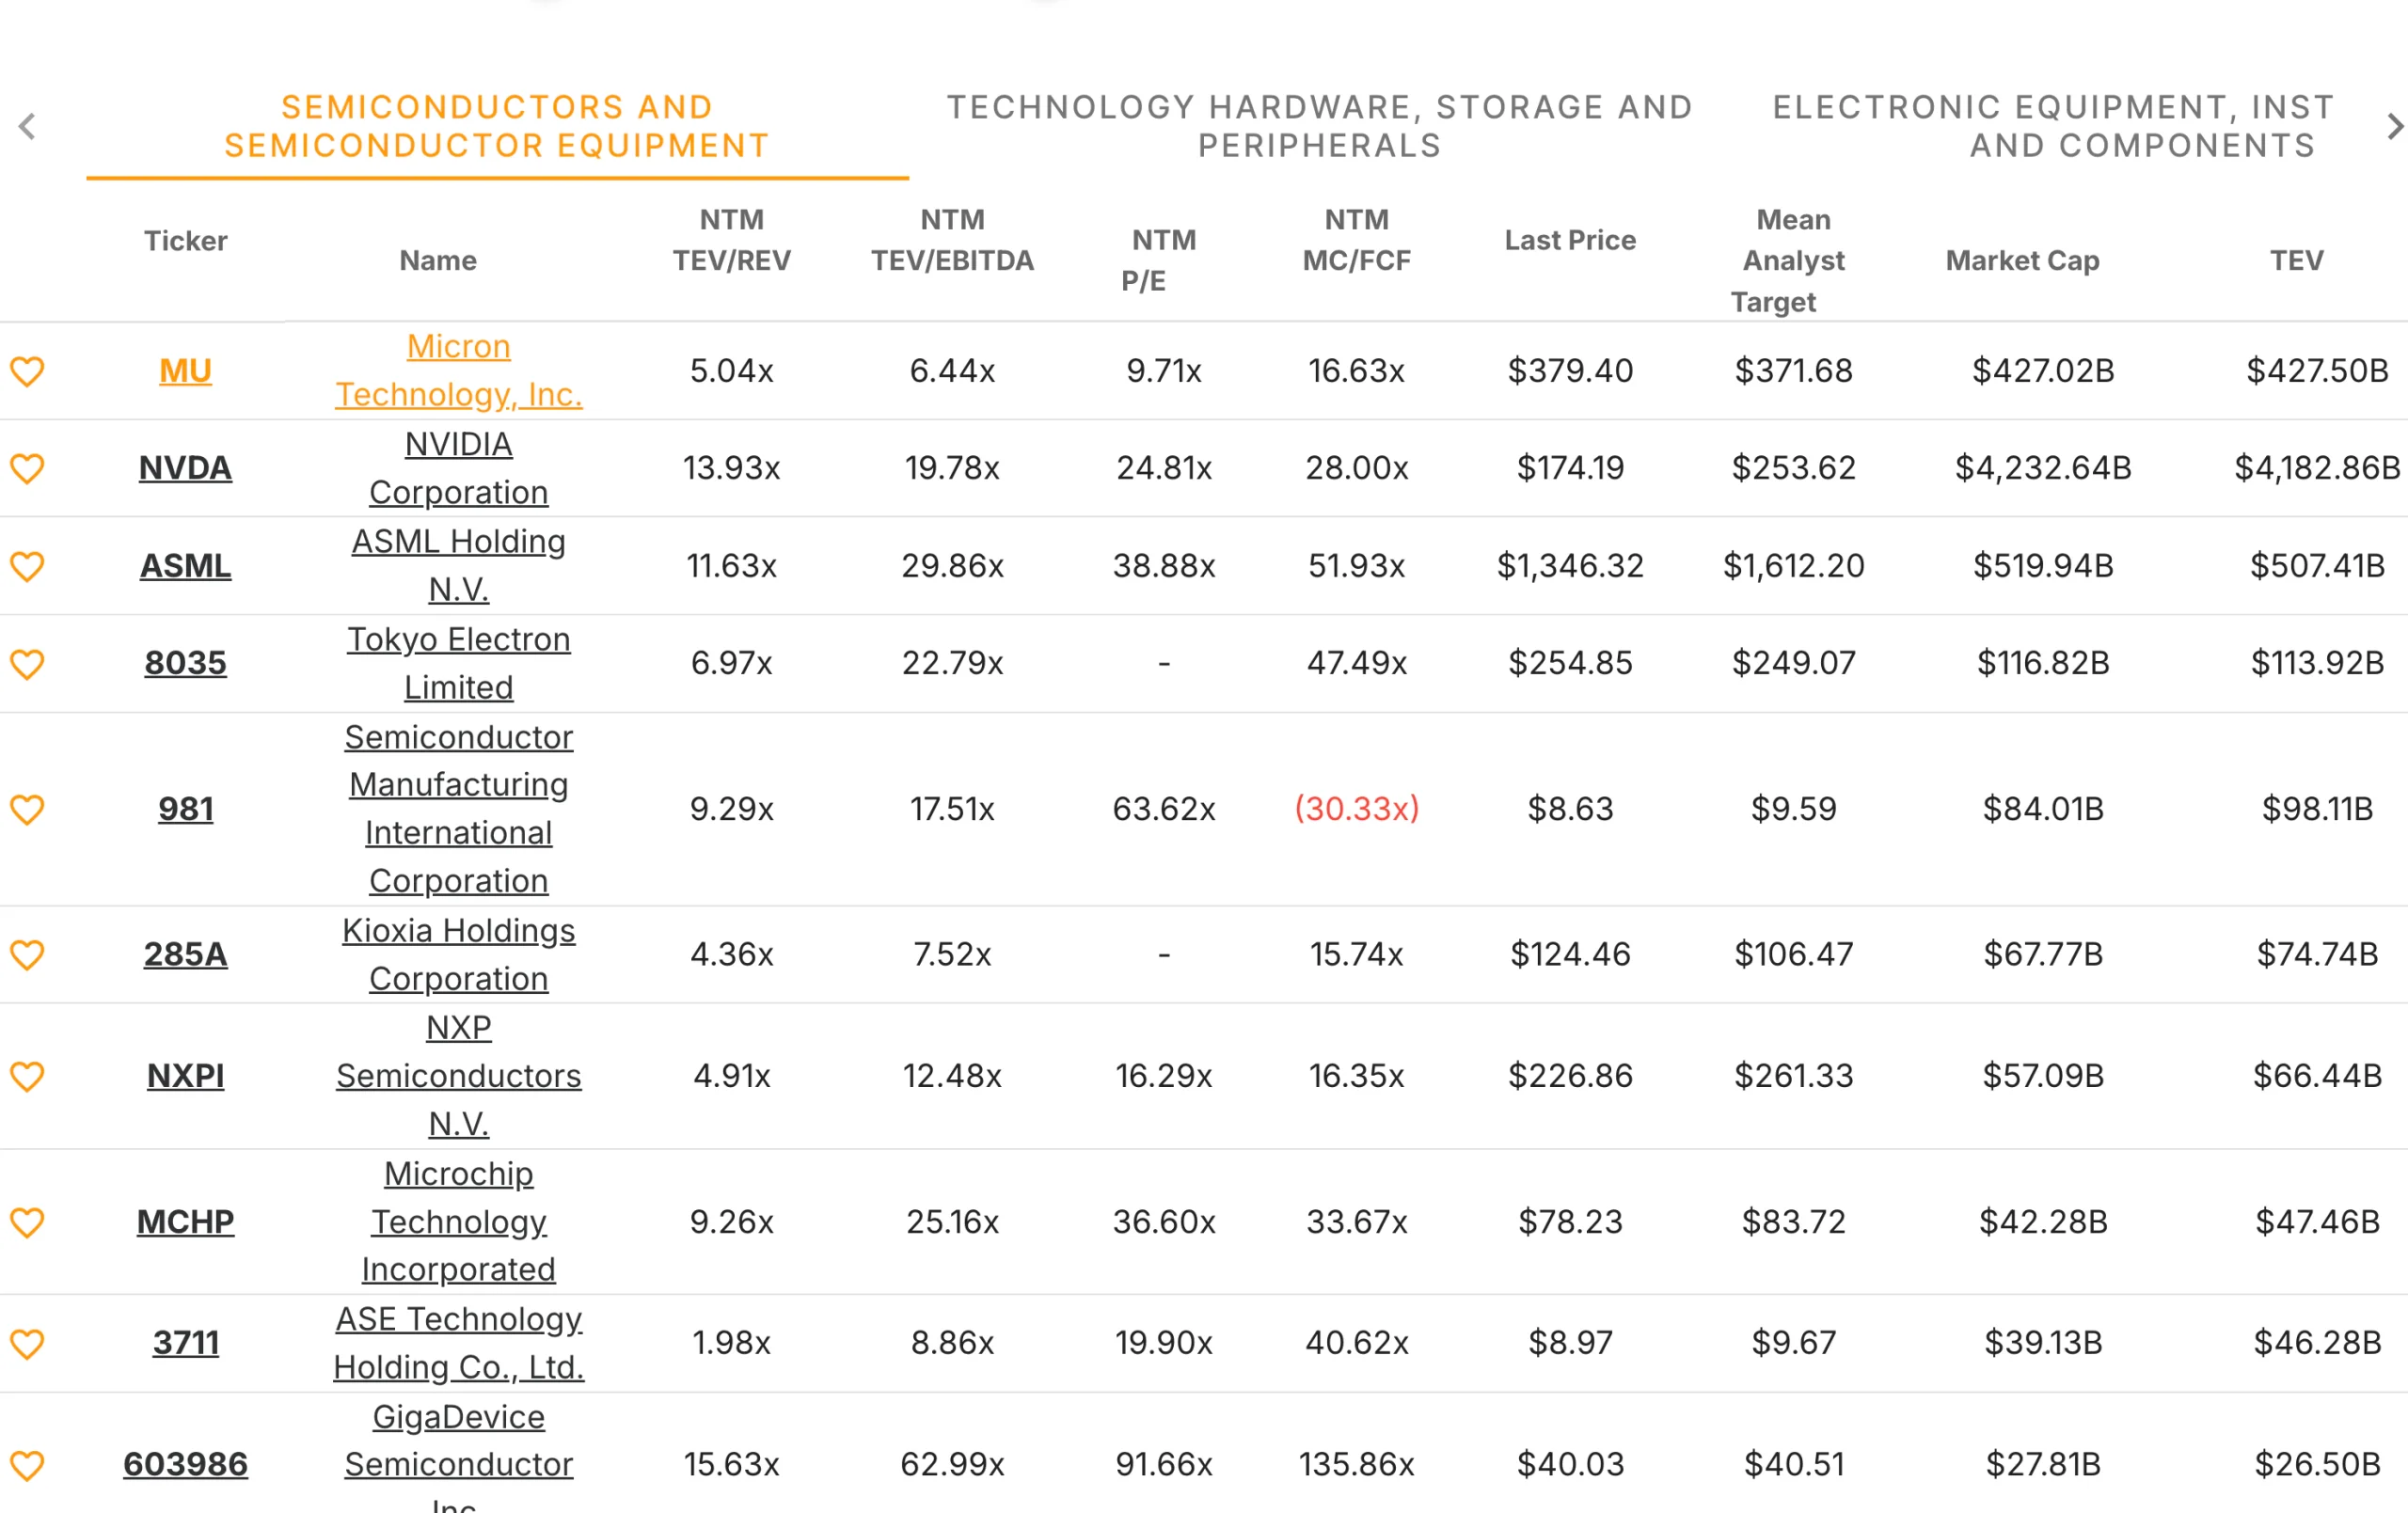
TIKR tip: TIKR displays multiple valuation metrics simultaneously, allowing you to see which ones are most relevant for a particular business. The Competitors tab helps ensure you are using the same metrics that analysts apply to peer companies.
Earnings-Based Multiples
Price-to-earnings is the most widely recognized valuation multiple because earnings ultimately belong to shareholders. A company trading at 15x earnings is priced at fifteen dollars for every dollar of annual profit. Lower multiples suggest cheaper valuations, all else equal, while higher multiples indicate investors are paying more for each dollar of earnings.
P/E works best for profitable companies with relatively stable earnings. It provides a clear, intuitive measure that connects price to the profits the business generates. Forward P/E, based on estimated future earnings, is generally more useful than trailing P/E because stocks are priced on expectations rather than history. A company with declining earnings might show a low trailing P/E but a high forward P/E as profits fall.
The limitations of P/E become apparent when earnings are volatile, negative, or distorted by accounting choices. A company that earned $2 per share last year but is expected to earn $0.50 this year has a trailing P/E that bears no relationship to its current valuation. A company with significant non-cash charges might show depressed GAAP earnings that understate its actual profitability. For these situations, other multiples provide clearer pictures.
P/E also ignores capital structure. Two companies with identical P/E ratios might have very different enterprise values if one carries significant debt while the other holds net cash. The levered company has higher total claims against its business even though the equity multiple looks the same. For comparing companies with different balance sheets, enterprise value multiples are more appropriate.
TIKR tip: TIKR shows both trailing and forward P/E ratios. For most analyses, focus on forward P/E based on next-twelve-month estimates, which reflects what you are actually paying for expected earnings.
Value any stock in less than 60 seconds with TIKR’s new Valuation Model (It’s free) >>>
Enterprise Value Multiples
Enterprise value multiples like EV-to-EBITDA and EV-to-EBIT account for capital structure by measuring total firm value rather than just equity value. Enterprise value equals market capitalization plus debt minus cash, representing what an acquirer would pay to own the entire business free and clear. This makes EV multiples more appropriate for comparing companies with different leverage.
EV-to-EBITDA is popular because EBITDA approximates operating cash flow before capital expenditures. It strips out the effects of depreciation policies, interest expenses, and tax rates that can differ across companies for reasons unrelated to their underlying businesses. Two companies with similar operations but different accounting choices will show similar EV/EBITDA ratios even if their P/E ratios diverge.
The limitation of EBITDA is that it ignores capital expenditures, which are real cash costs for many businesses. A manufacturing company with heavy ongoing capex requirements converts far less of its EBITDA to free cash flow than a software company with minimal capex. Comparing them on EV/EBITDA alone overstates the relative value of the capital-intensive business. For these situations, EV-to-EBIT or EV-to-free-cash-flow provides a more accurate picture.
EV/EBIT includes depreciation expense, which serves as a rough proxy for maintenance capital requirements. This makes it more conservative than EV/EBITDA and more useful for capital-intensive businesses. The tradeoff is that depreciation schedules vary across companies and may not accurately reflect true capital needs, introducing a different set of distortions.
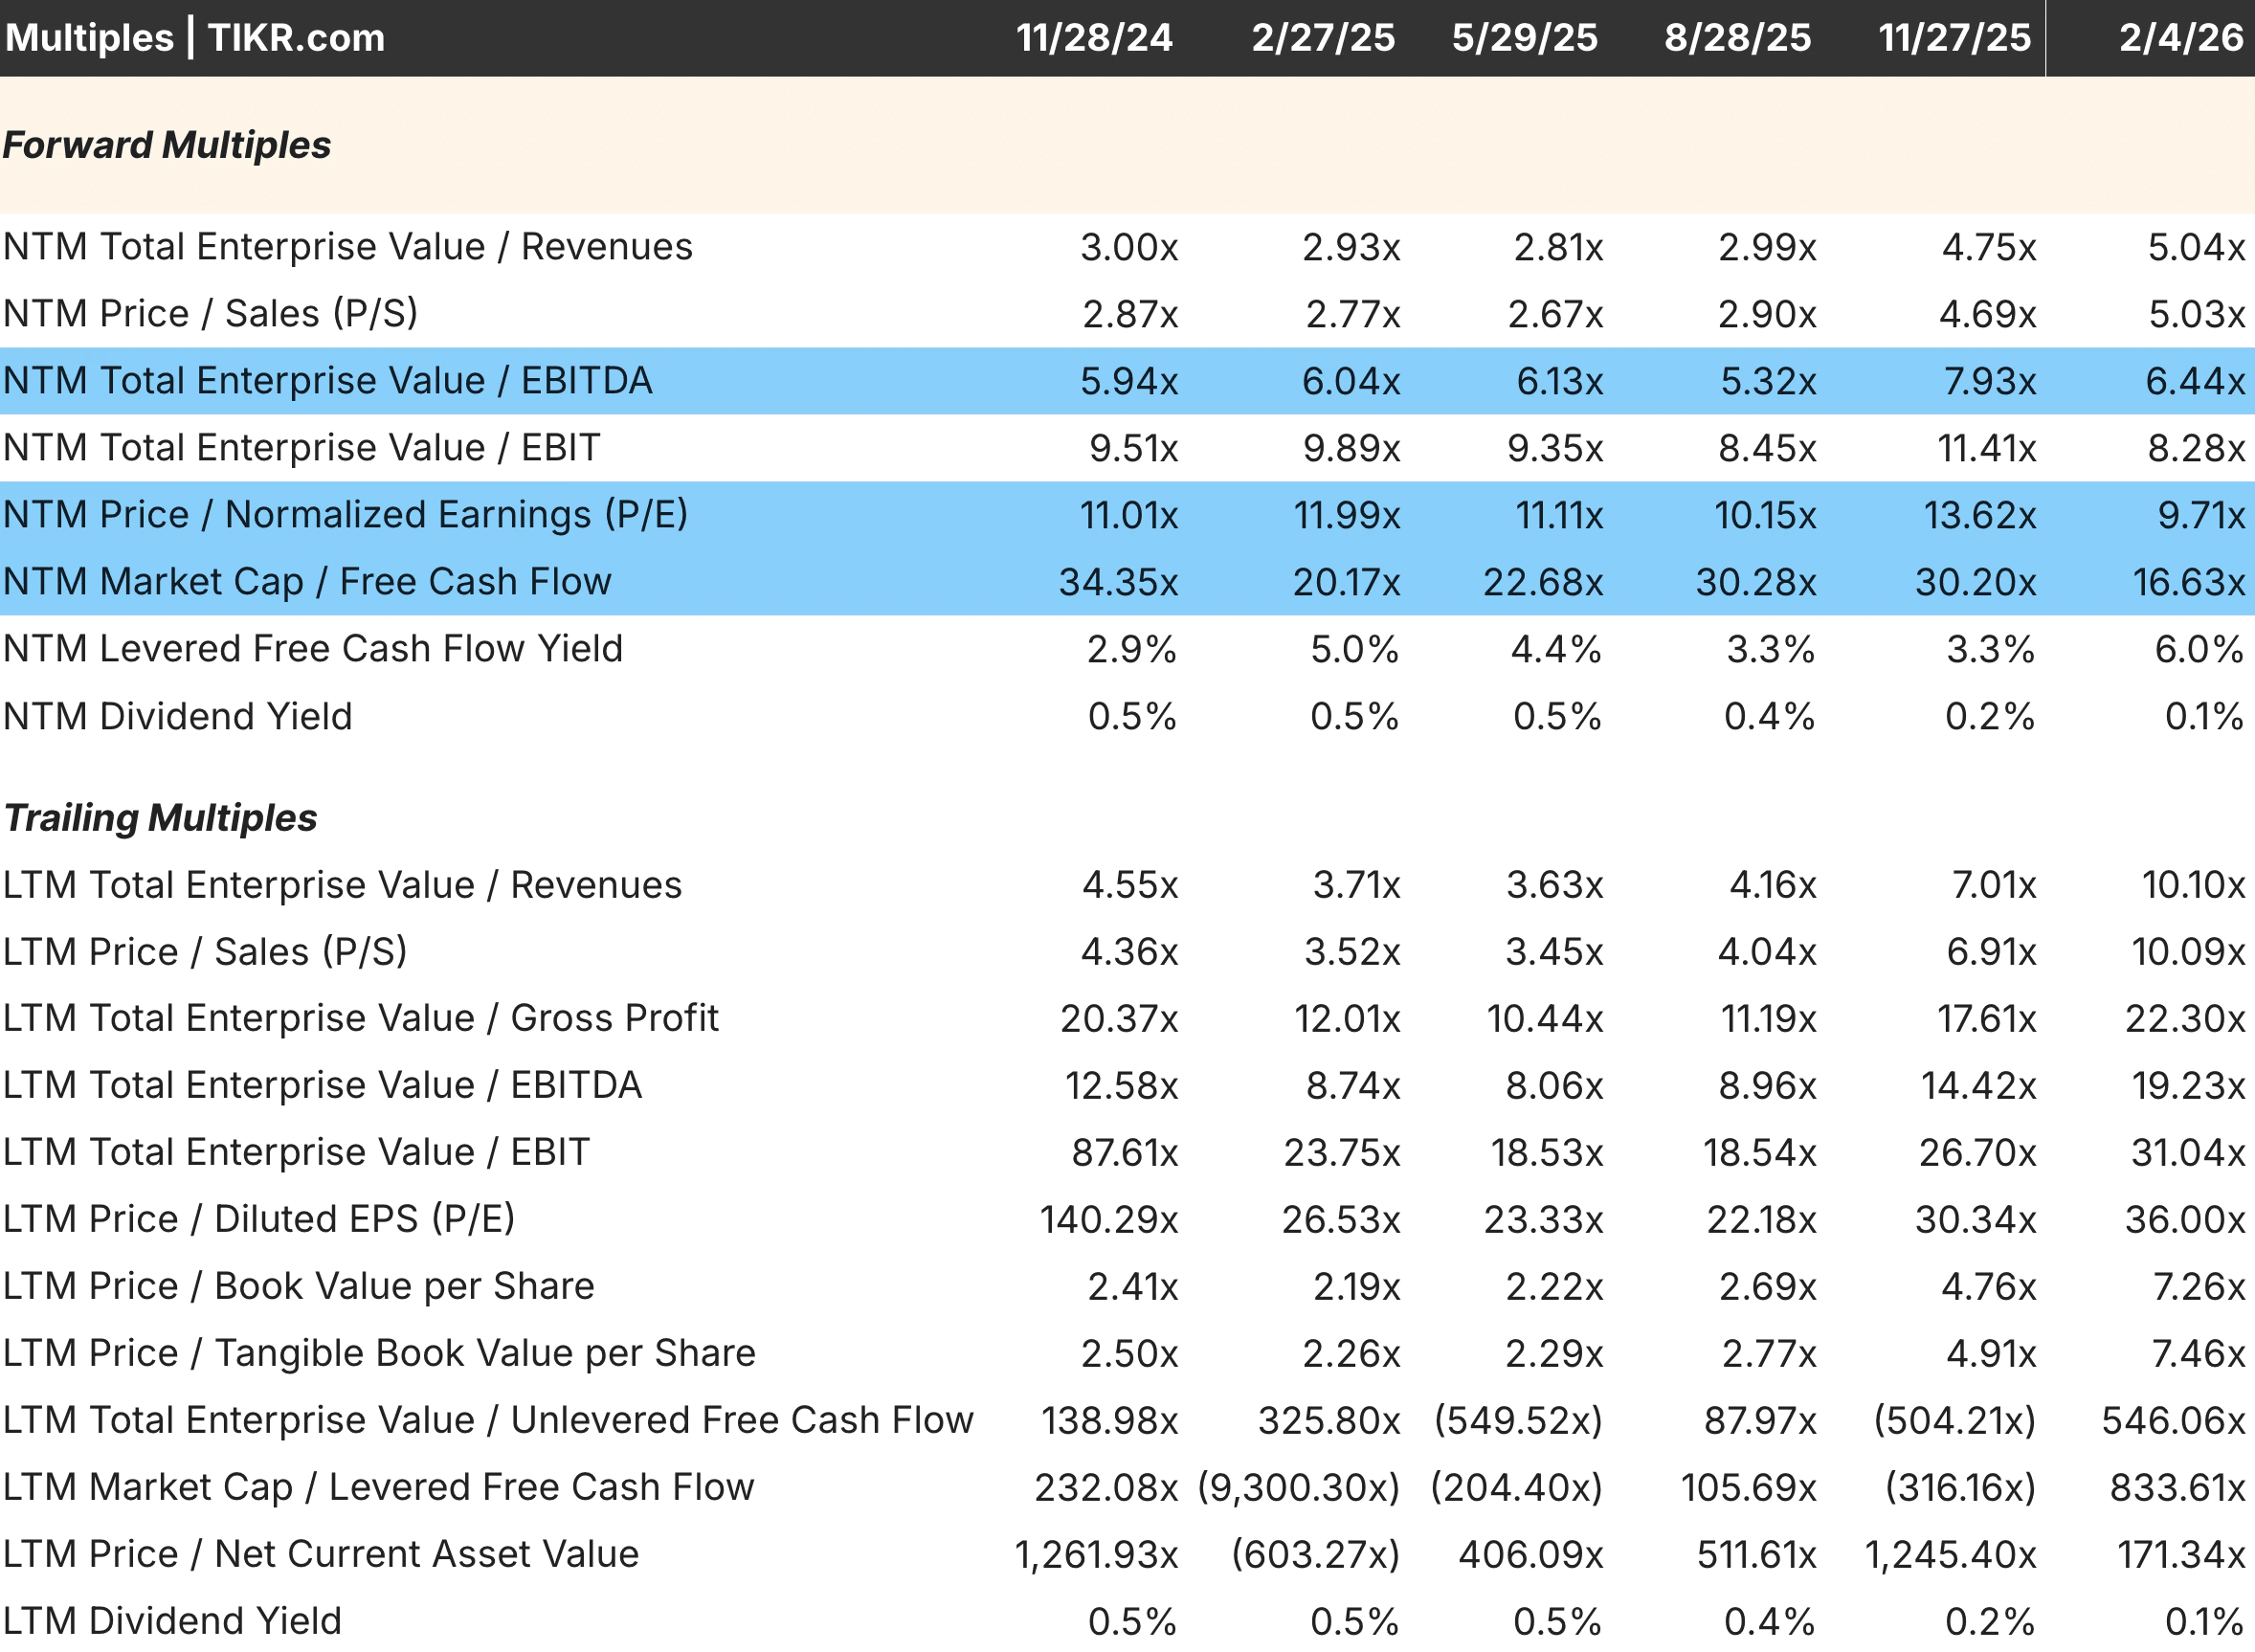
TIKR tip: TIKR displays EV/EBITDA, EV/EBIT, and other enterprise value multiples in the Valuation tab. Compare these to P/E to understand how leverage affects the relative valuation picture.
Build your own screener to find stocks with solid earnings revenue to buy today (Free with TIKR) >>>
Revenue and Cash Flow Multiples
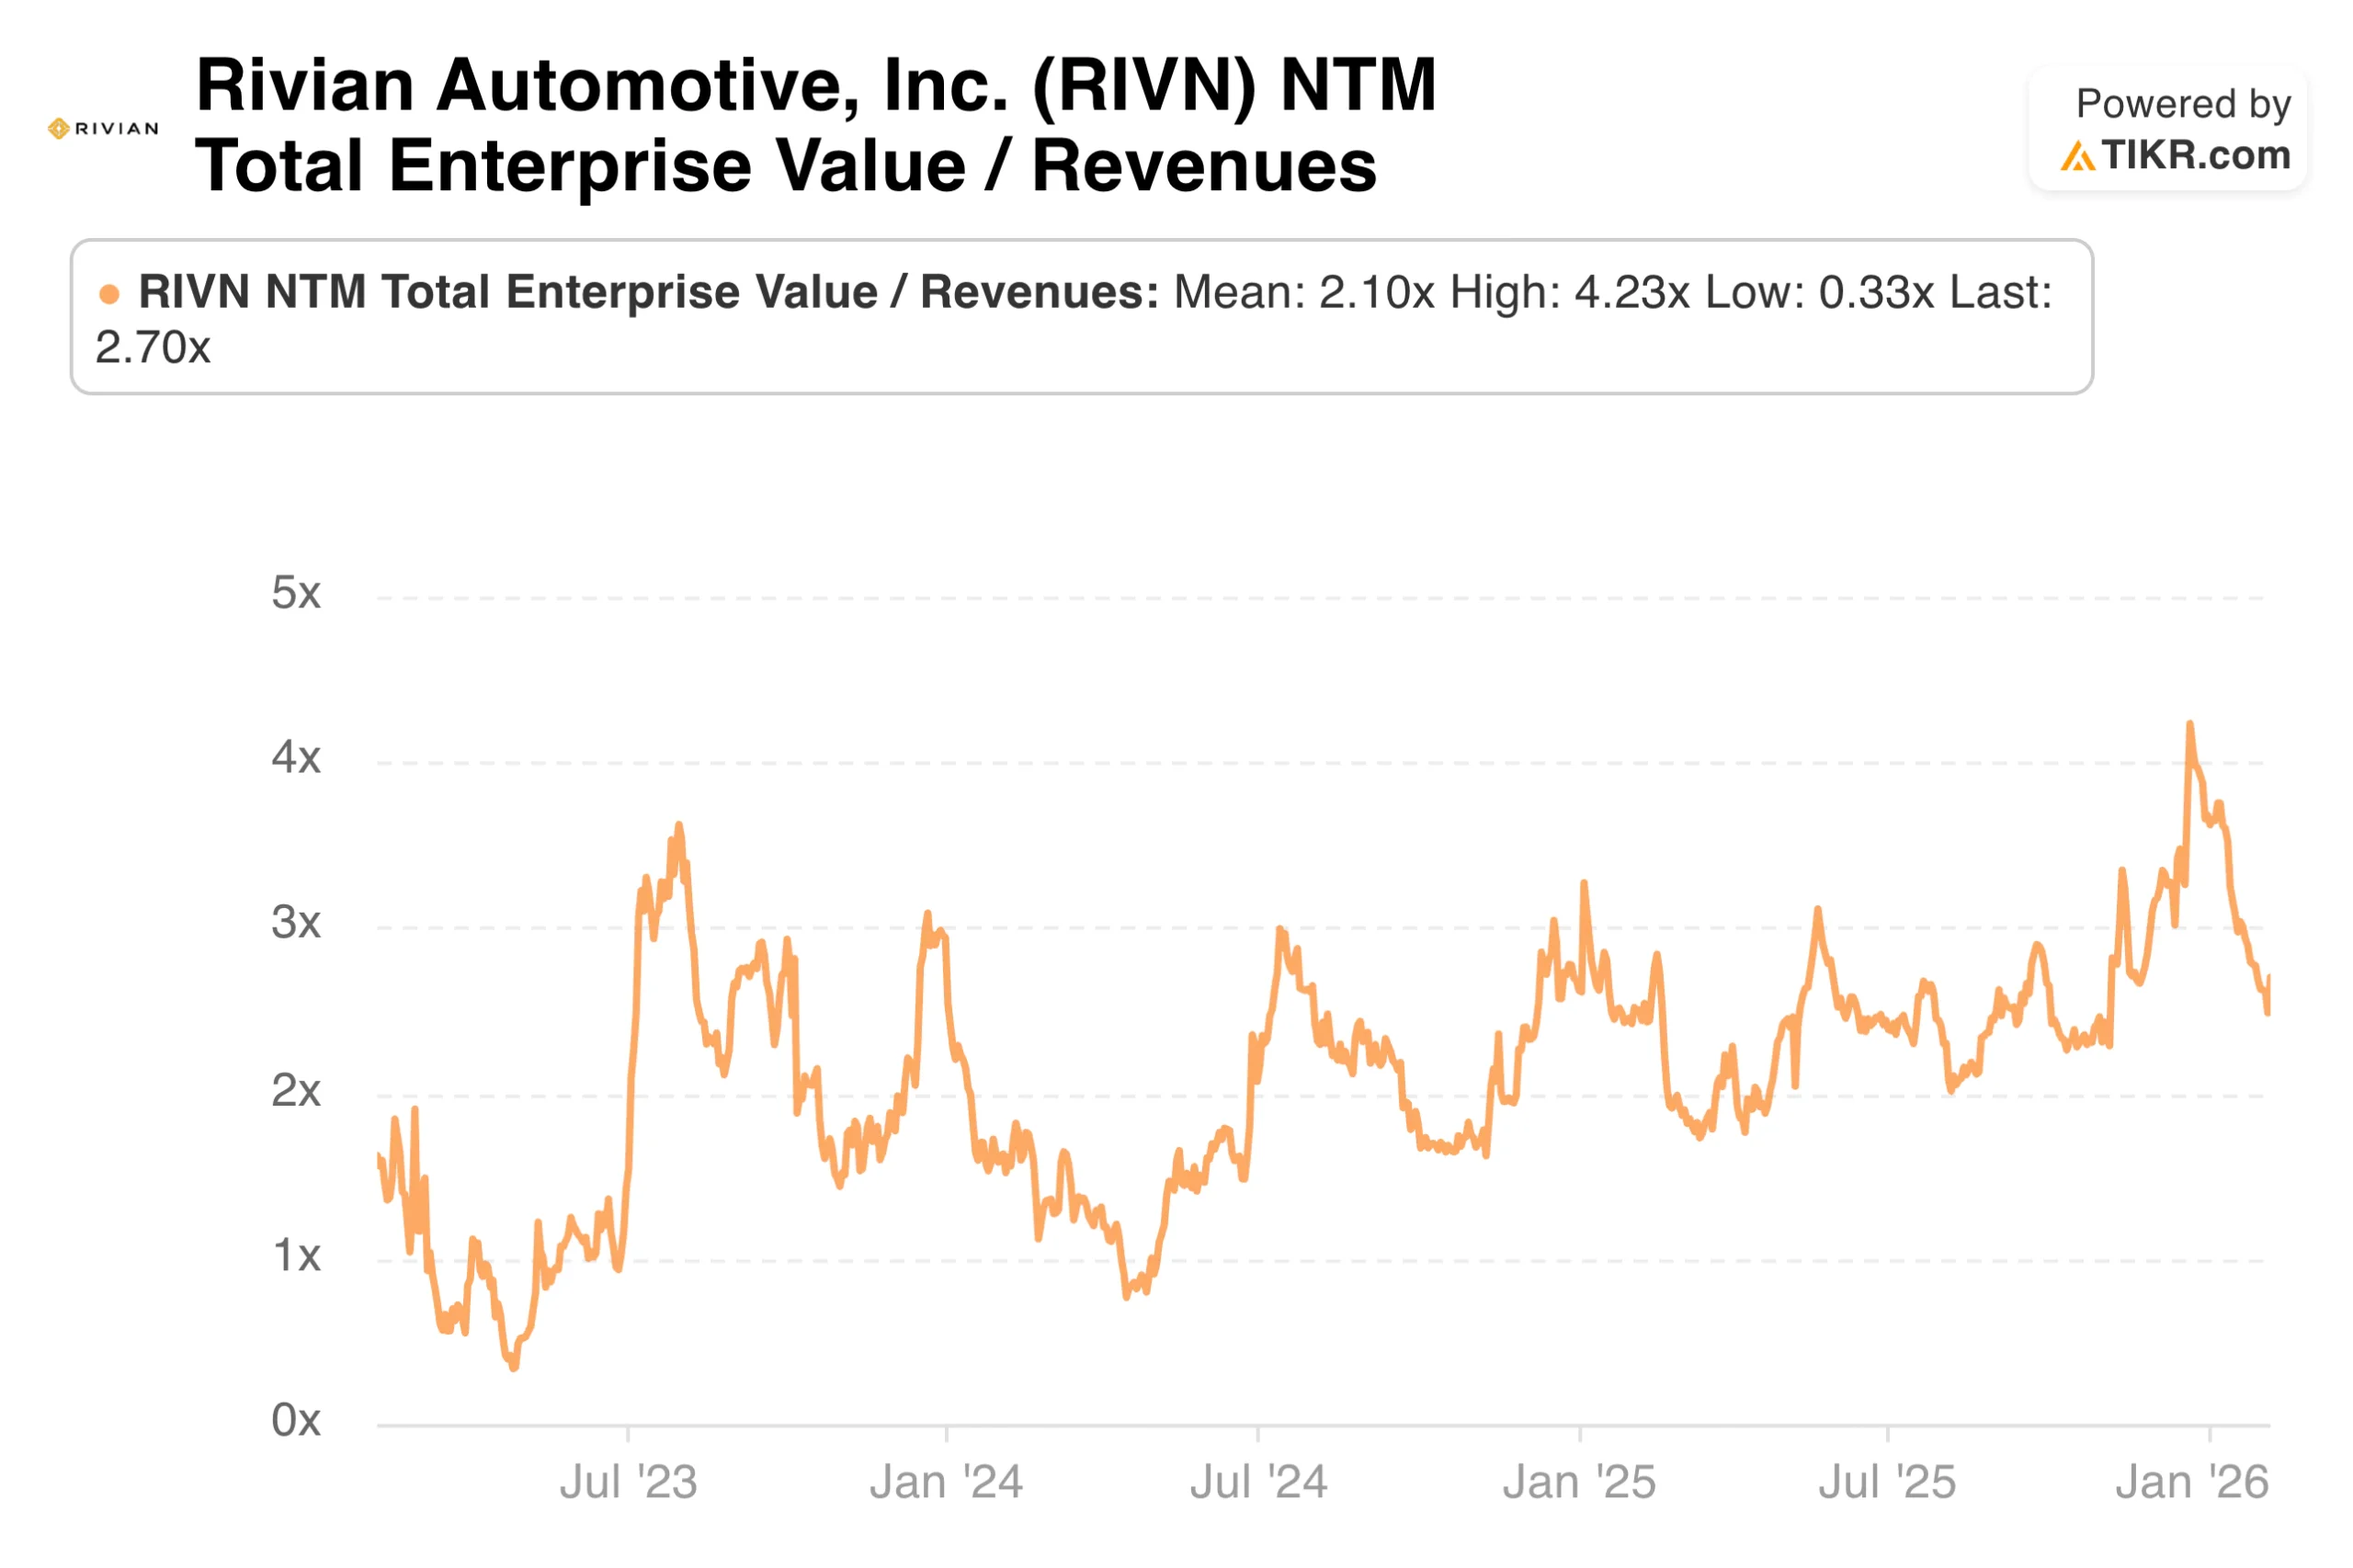
Price-to-sales and EV-to-revenue become necessary when earnings are negative or too volatile to provide a meaningful anchor. High-growth companies often operate at a loss as they invest aggressively in customer acquisition, product development, and geographic expansion. Valuing them on earnings would imply they are worthless, which is obviously false when they are generating substantial and growing revenue.
Revenue multiples work best for companies with clear paths to profitability and predictable margin structures at scale. A software company growing revenue 40% annually with gross margins of 80% will eventually generate substantial profits once growth investments moderate. The revenue multiple implicitly values those future profits by applying a multiple to today’s sales and assuming margins will reach industry norms over time.
The danger of revenue multiples is that they ignore profitability entirely. A company can grow revenue forever while destroying value if its unit economics are fundamentally broken. Two companies with identical revenue and revenue growth can have dramatically different values if one has 80% gross margins and the other has 30%. Revenue multiples should always be interpreted alongside gross margin and a realistic path to profitability.
Price-to-free-cash-flow provides the cleanest picture of what shareholders actually receive because free cash flow represents cash available after all operating costs and capital expenditures. This multiple works well for mature businesses with stable capital requirements and limited growth investment. It works poorly for growing companies that are reinvesting heavily, since their current free cash flow understates earning power.
TIKR tip: For unprofitable companies, use TIKR’s Estimates tab to see when analysts expect profitability. A company with negative earnings but expected profitability in two years can be valued on forward P/E at that point and discounted back.
Industry-Specific Considerations
Certain industries have developed specialized multiples that better capture how value is created in those sectors. Using generic multiples for these businesses ignores important characteristics that drive their economics.
Financial institutions are typically valued using price-to-book or price-to-tangible-book ratios because their assets and liabilities are largely marked to market. A bank’s book value represents a reasonable approximation of its liquidation value, making it a natural anchor. Earnings-based multiples are less useful because bank earnings depend heavily on the interest rate environment and the credit cycle, which can distort results in any single period.
REITs and other real estate companies are valued on price-to-FFO (funds from operations) or price-to-AFFO (adjusted funds from operations). Standard earnings include depreciation charges that may not reflect actual declines in property value, understating economic profitability. FFO adds back depreciation to provide a clearer picture of the cash the properties generate.
Insurance companies are often valued on price-to-book with adjustments for reserve adequacy. An insurer’s reported book value depends heavily on estimates of future claims, which can be wrong in either direction. Understanding the reserving assumptions is essential before comparing insurance companies on book value multiples.
Subscription and SaaS businesses are sometimes valued on EV-to-annual-recurring-revenue because ARR captures the contracted, predictable portion of their business. This multiple makes sense for companies with high retention rates where ARR is likely to persist. It is less appropriate for businesses with high churn, where today’s ARR may not translate to tomorrow’s revenue.
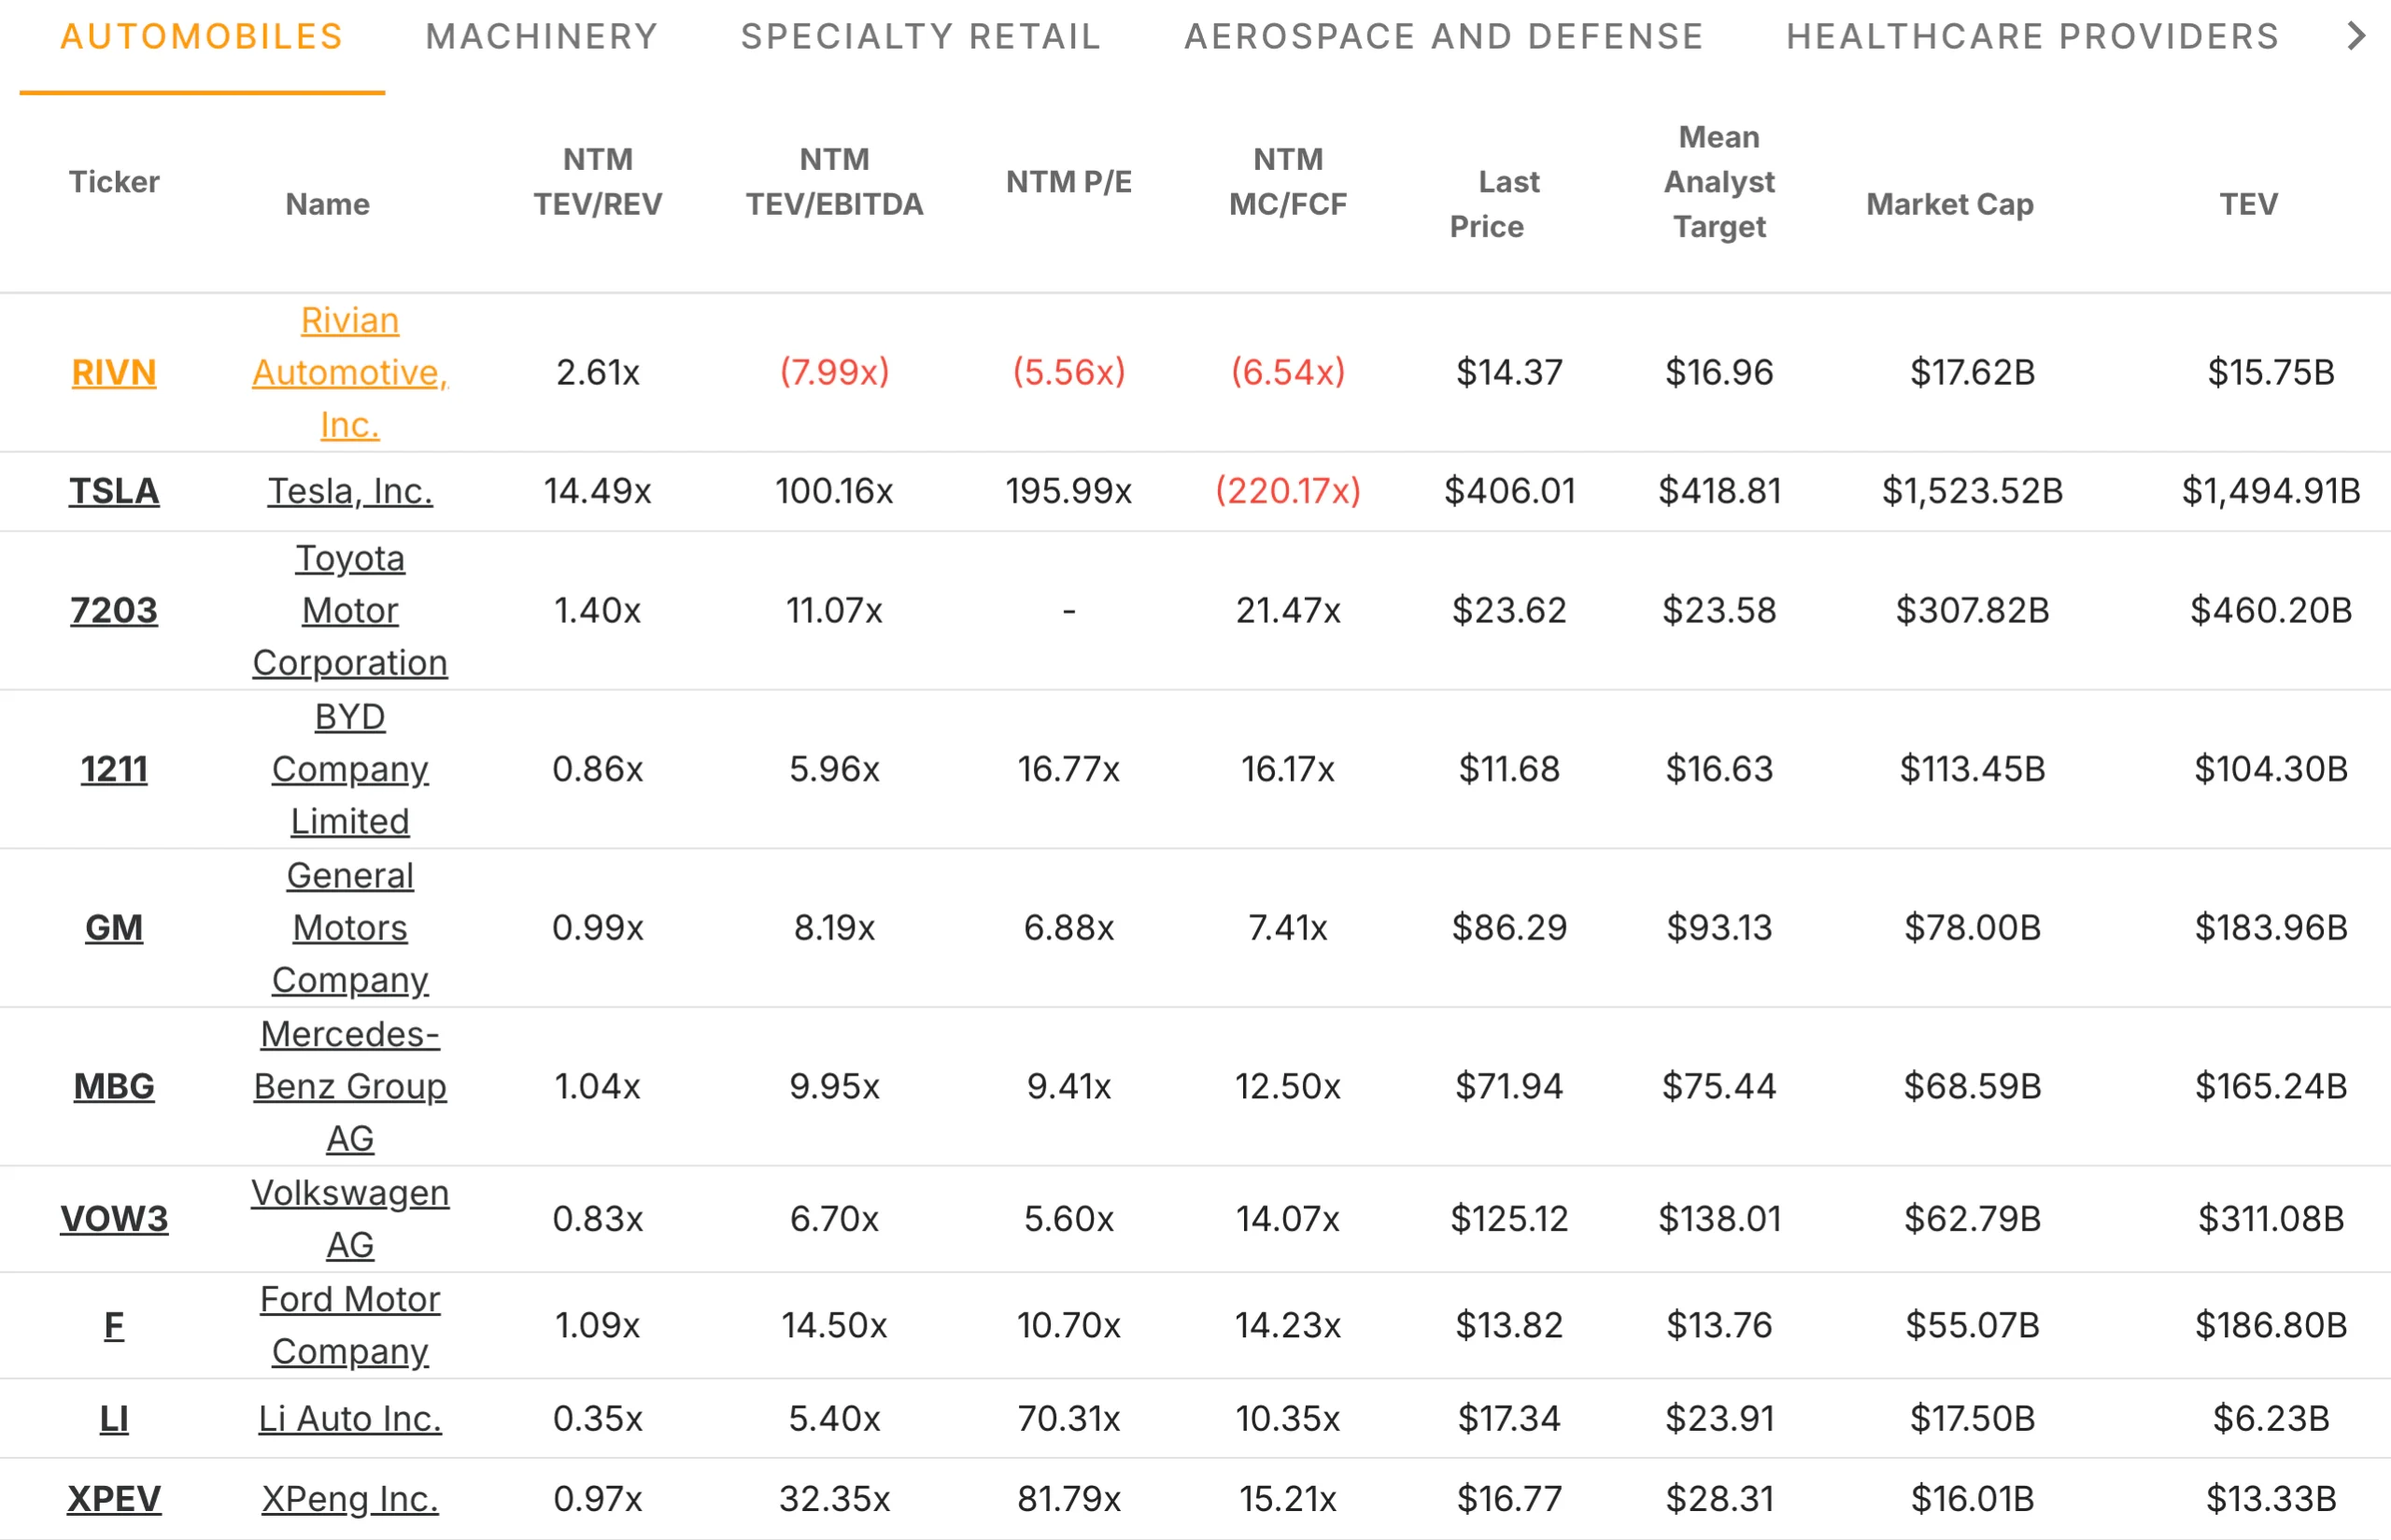
TIKR tip: When analyzing a company in an unfamiliar industry, use TIKR’s Competitors tab to see which multiples analysts emphasize for peer companies. Industry conventions reflect accumulated wisdom about what metrics matter.
Screen earnings growth for over 75,000 global stocks with TIKR (It’s free) >>>
Comparing Across Time and Peers
A multiple is only meaningful in context. A P/E of 20x might be cheap for one company and expensive for another, depending on growth rates, quality, and historical norms. The right comparison depends on what question you are trying to answer.
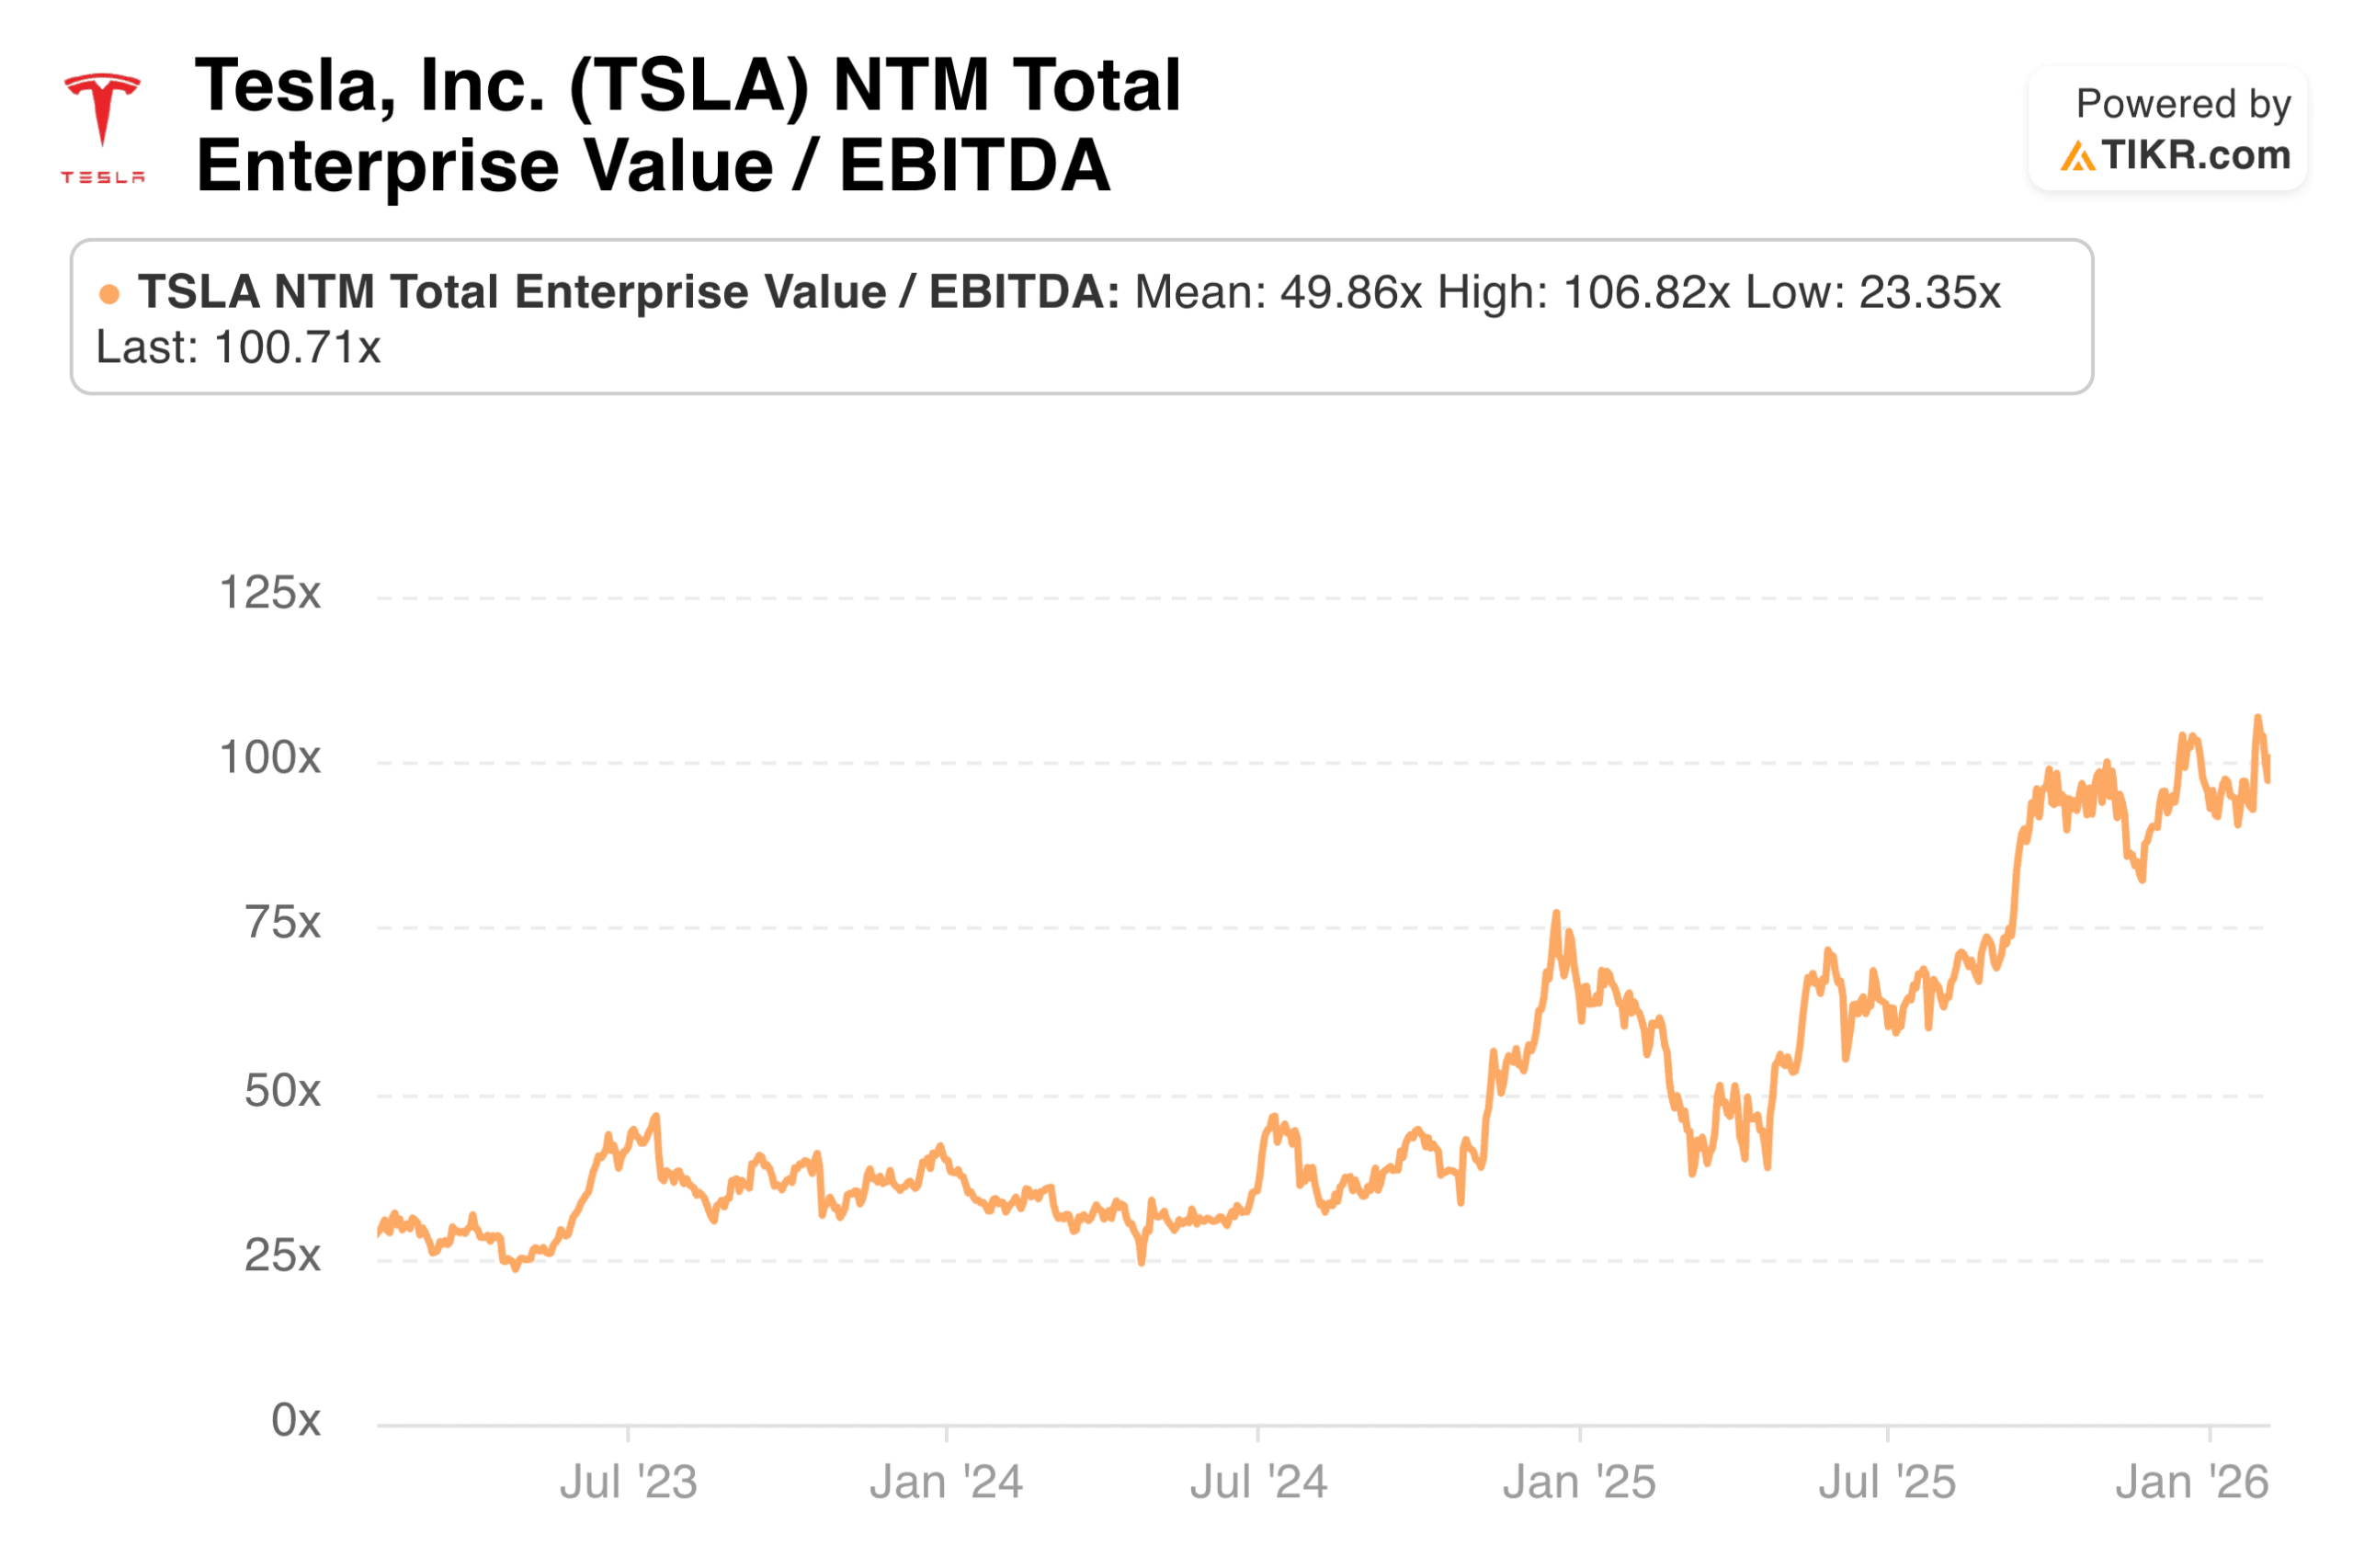
A historical comparison reveals whether a stock is cheap or expensive relative to its own history. A company that has traded between 12x and 20x forward earnings over the past decade and currently trades at 13x is near the low end of its historical range. That might indicate opportunity if fundamentals remain strong, or it might reflect genuine deterioration that justifies a lower multiple. The historical range provides context; judgment determines interpretation.
Peer comparison reveals whether a stock is cheap or expensive relative to competitors. A company trading at 15x earnings while peers trade at 20x might be undervalued by the market or might deserve its discount due to inferior growth, margins, or returns on capital. Compare multiples alongside the fundamental metrics that should drive valuation differences.
Market comparison provides the broadest context but the least specificity. Knowing that a stock trades at a premium or discount to the market average tells you something, but stocks should not all trade at the same multiple. High-quality compounders deserve premiums. Declining businesses deserve discounts. Market-relative valuation is a starting point, not a conclusion.
The growth rate is critical to interpreting any multiple. A stock at 25x earnings growing at 20% annually is cheaper on a growth-adjusted basis than one at 15x earnings growing at 5%. The PEG ratio formalizes this comparison by dividing P/E by growth rate, though it has limitations at extreme growth rates.
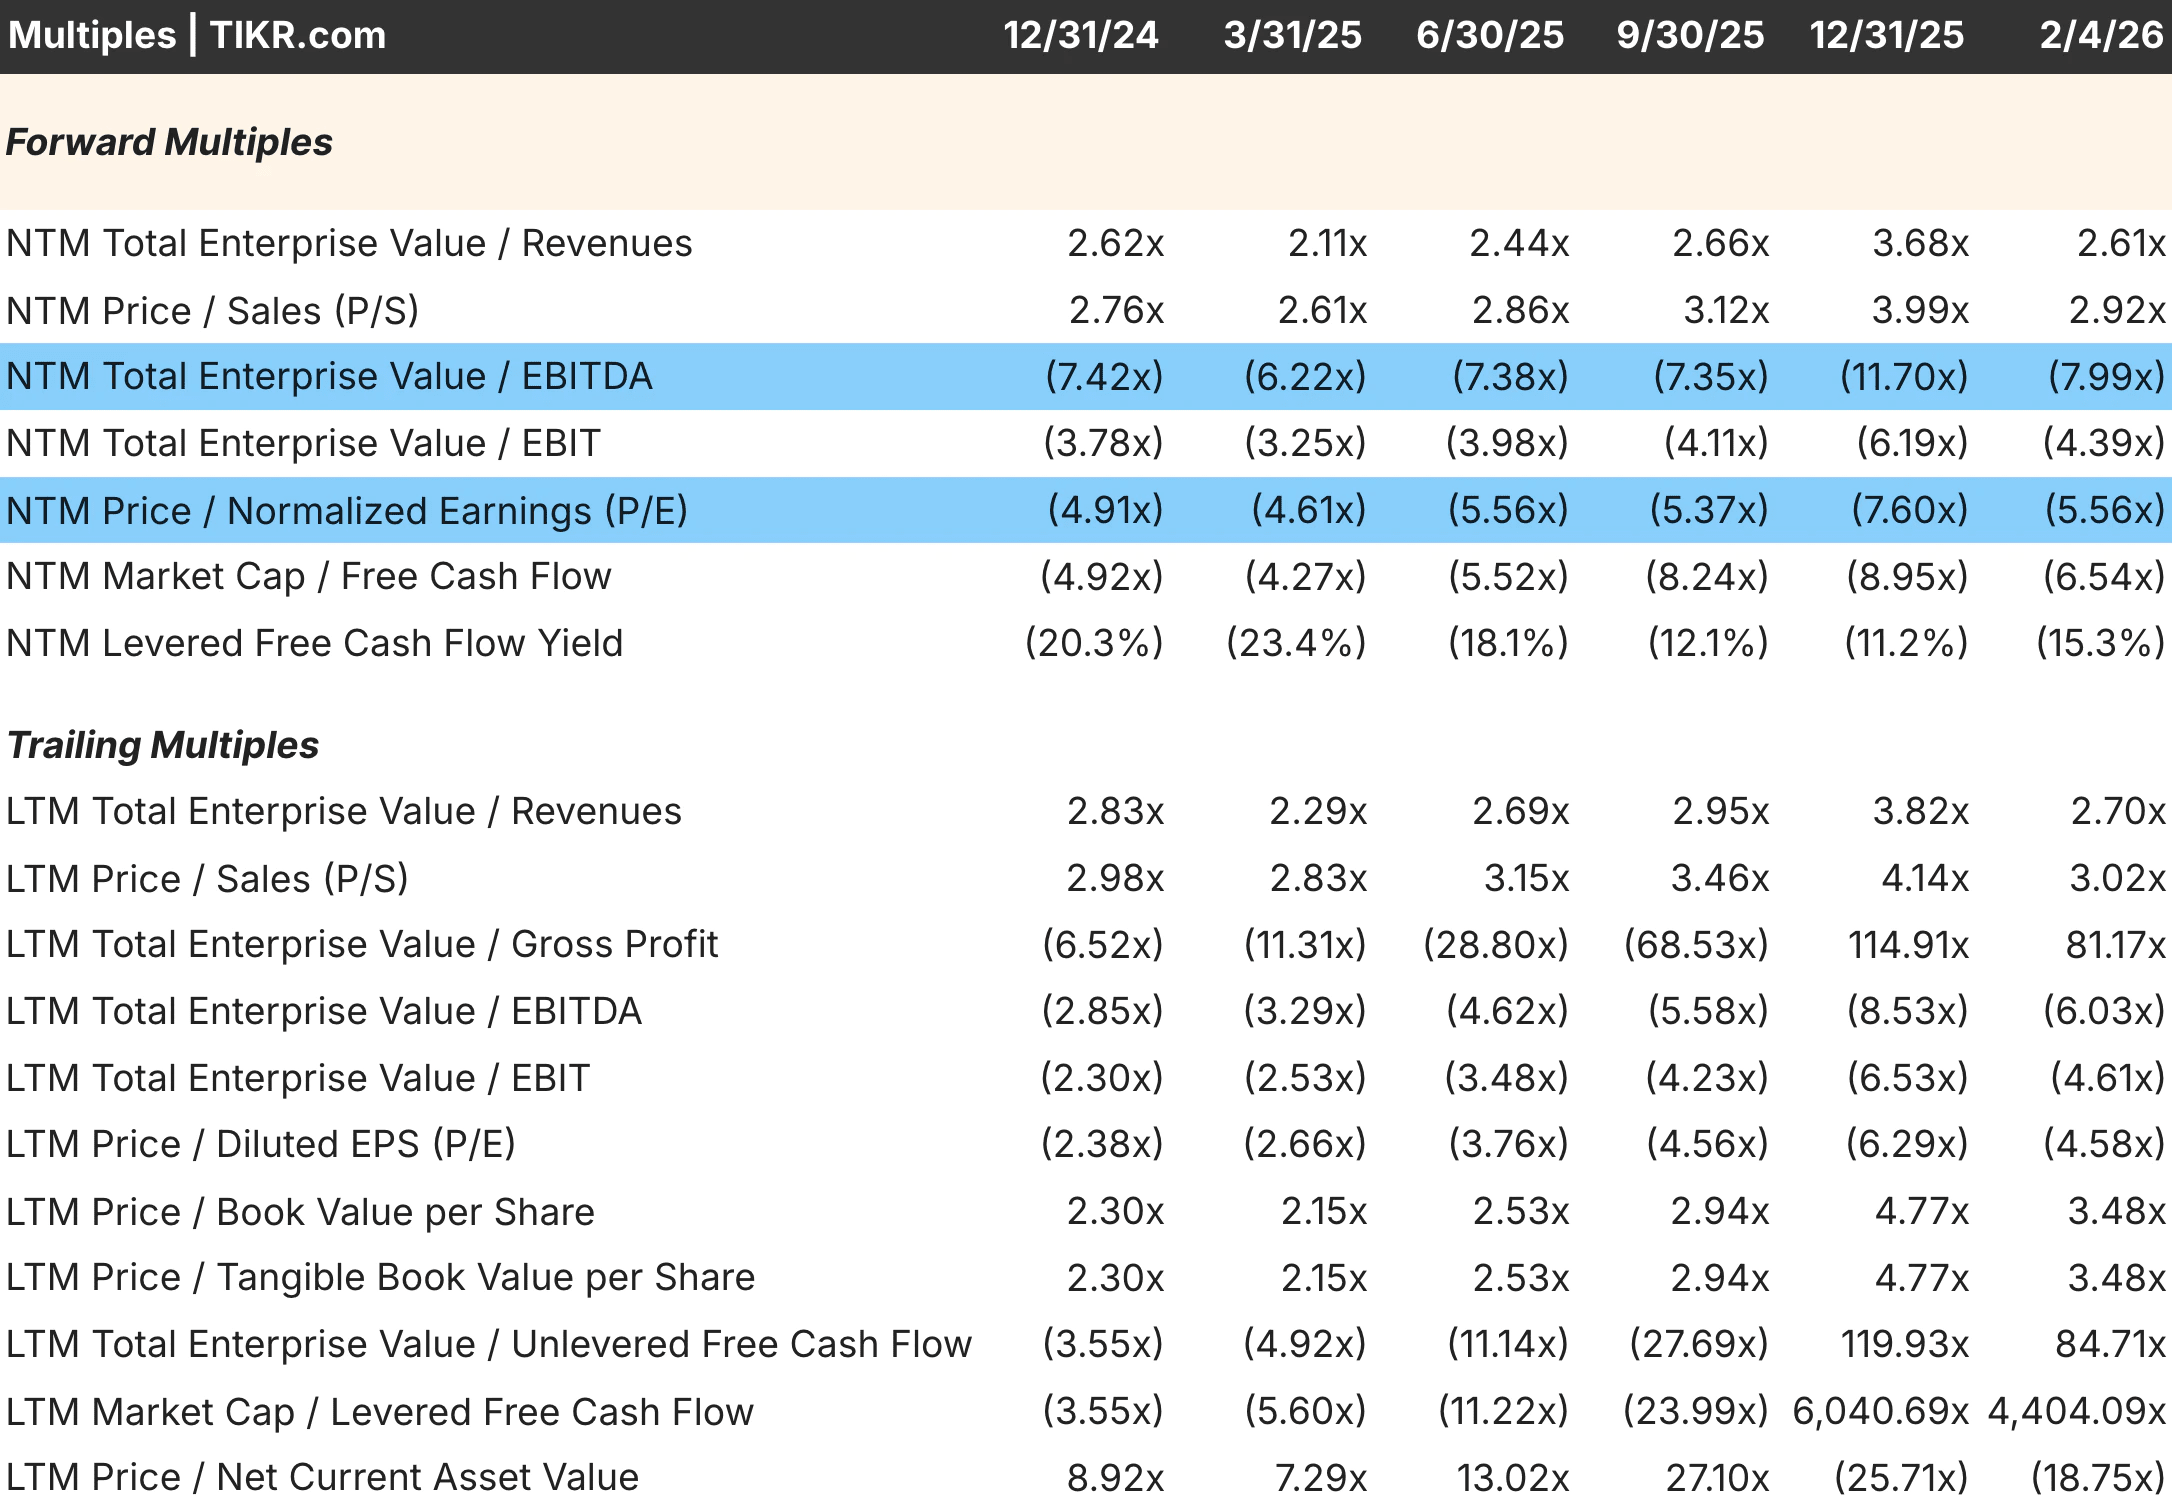
TIKR tip: TIKR’s Valuation tab shows current multiples alongside historical averages. The Competitors tab displays peer multiples for direct comparison. Use both to develop a complete picture of relative valuation.
Common Mistakes to Avoid
Even with the right multiple, common errors can lead to flawed conclusions. Awareness of these pitfalls helps you avoid the traps that catch less careful investors.
Using trailing multiples when the future looks different from the past distorts the picture. A company whose earnings are about to drop 50% looks cheap on trailing P/E but expensive on forward P/E. Always consider whether current-period results represent normalized performance or a cyclical peak or trough.
Ignoring the denominator’s quality leads to misleading comparisons. Earnings can be inflated by aggressive accounting, one-time gains, or unsustainable margins. Two companies with identical P/E ratios but different earnings quality have very different true valuations. Confirm that the earnings, EBITDA, or revenue you are using reflect economic reality.
Forgetting that multiples reflect expectations can lead to confusion about what “cheap” or “expensive” means. A stock with a high multiple might decline even if results are good, because good results were already priced in. A stock with a low multiple might rise despite mediocre results if expectations were even worse. Valuation is about price relative to expectations, not price relative to outcomes.
Applying the same multiple across different business models leads to flawed comparisons. A capital-light business converting 90% of EBITDA to free cash flow is worth more than a capital-intensive business converting 40%, even at the same EV/EBITDA. Adjust for differences in capital intensity, growth rates, and returns on capital when comparing across companies.
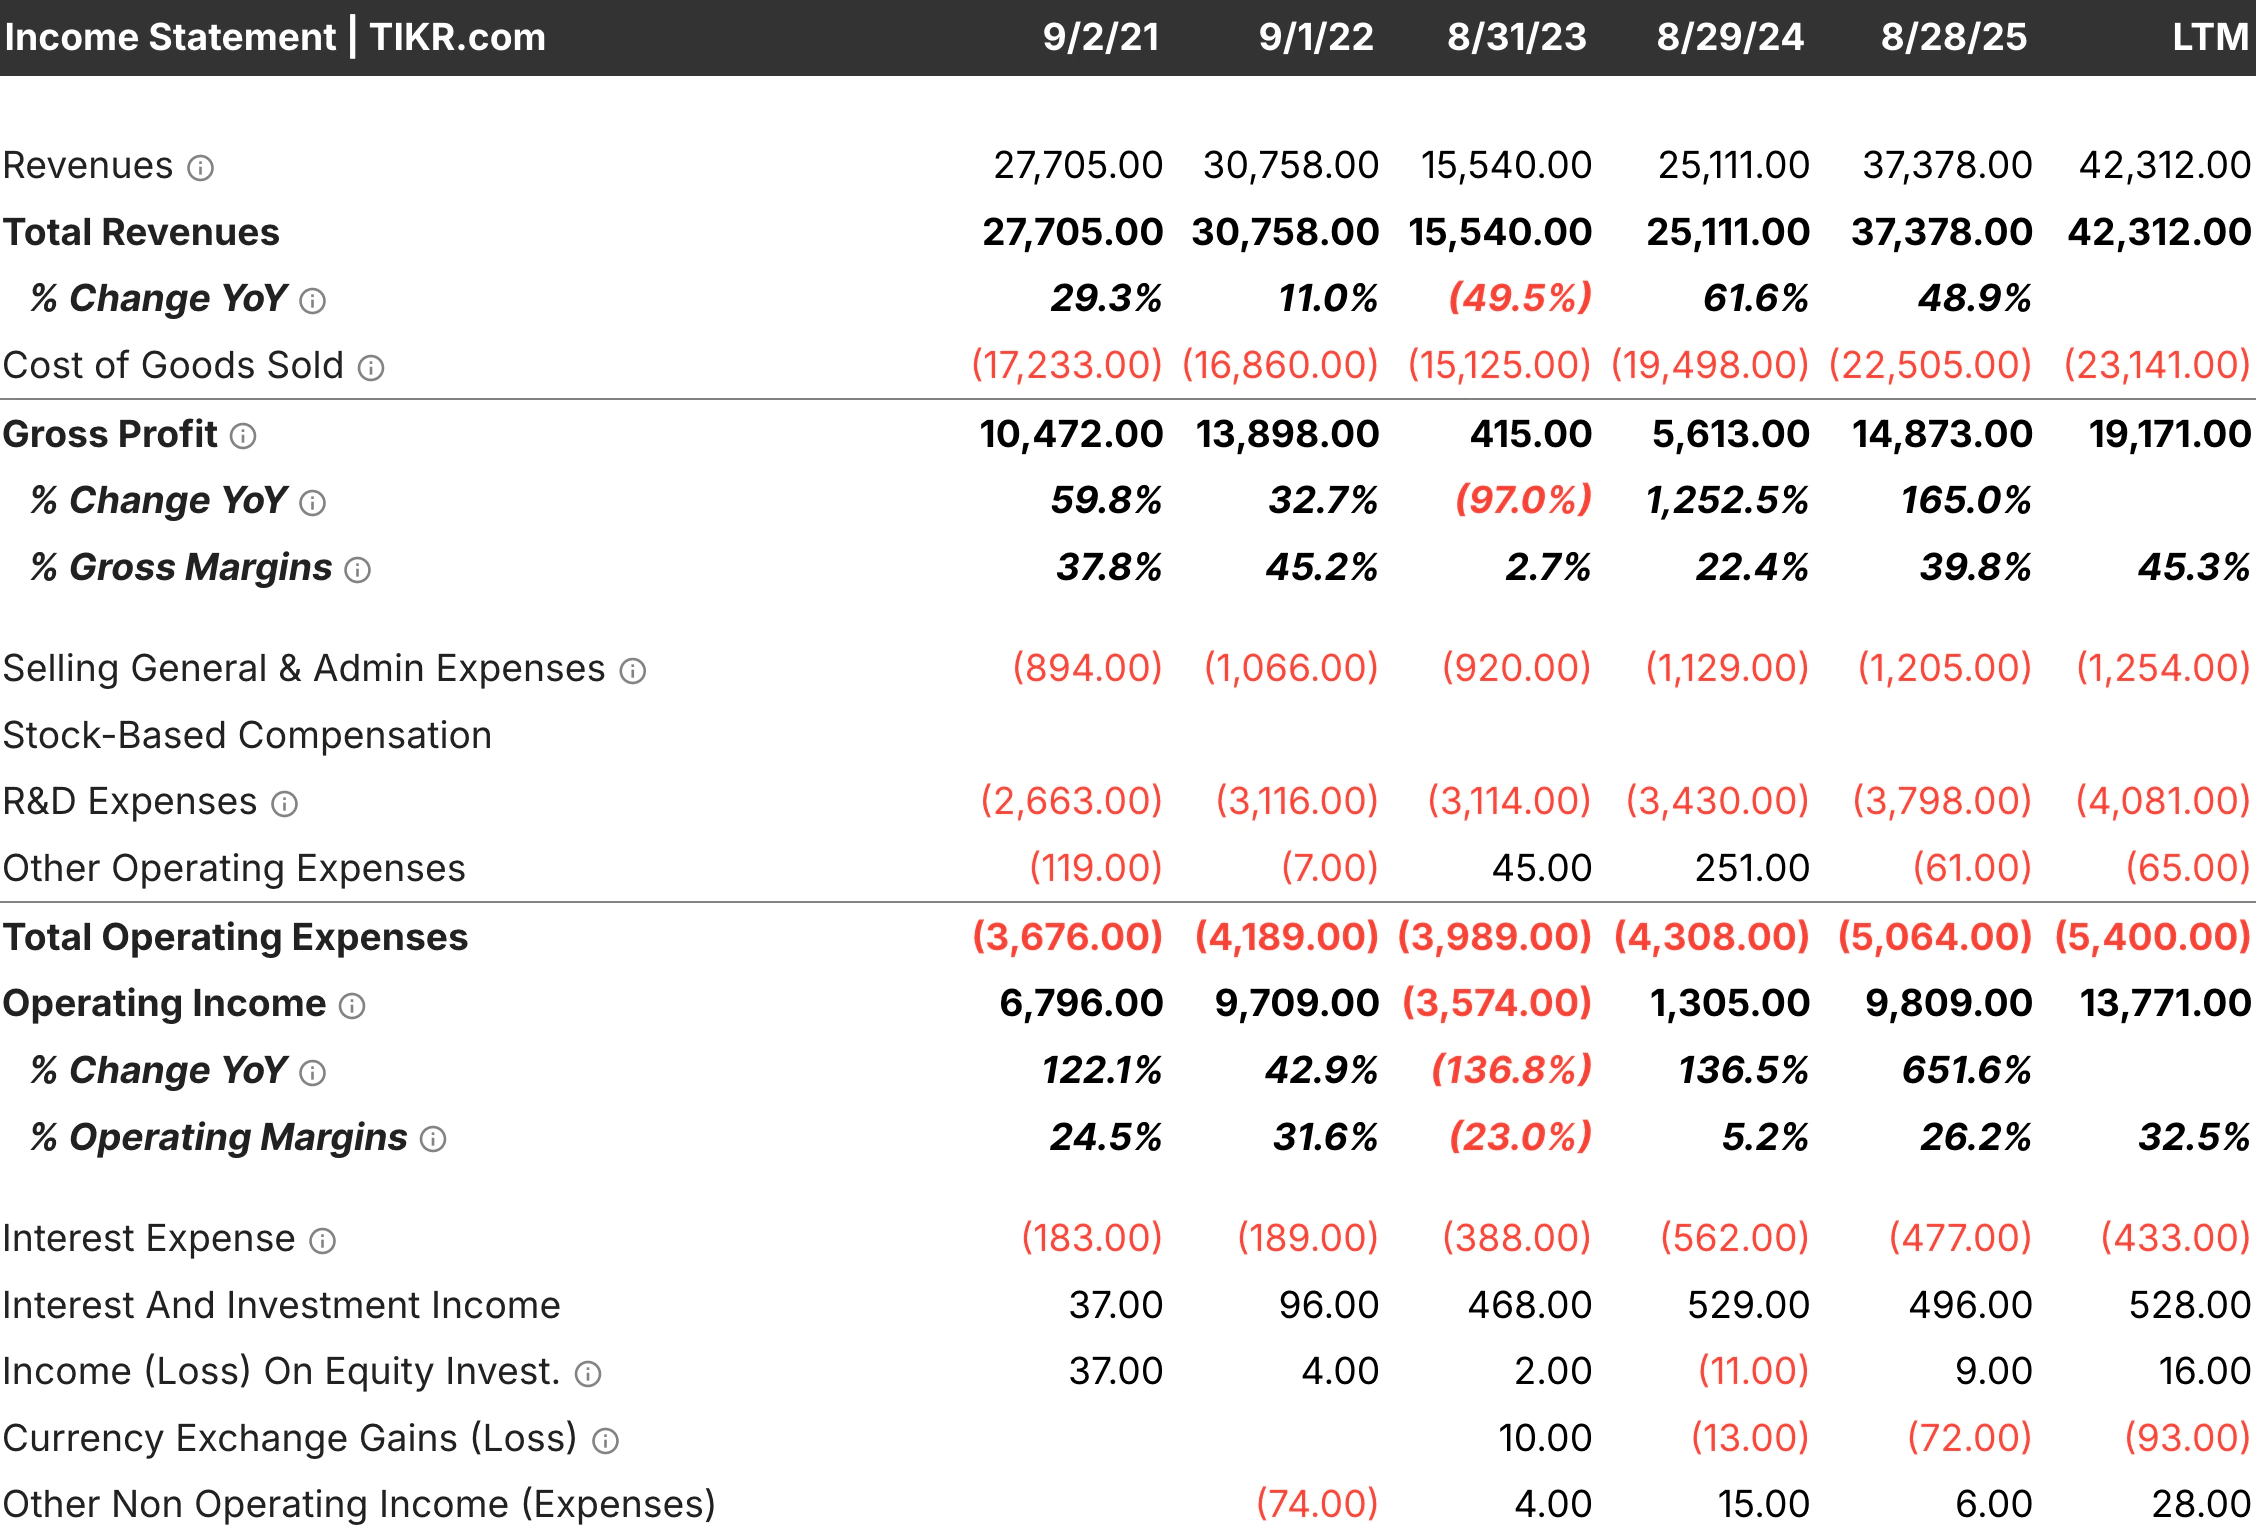
TIKR tip: Before concluding a stock is cheap or expensive, use TIKR’s Detailed Financials to verify that the fundamental inputs to your multiple are sustainable. A low multiple on inflated earnings is not actually cheap.
Run a competitor analysis on TIKR for the top stocks in your portfolio (It’s free) >>>
The TIKR Takeaway
Choosing the right valuation multiple is foundational to sound investment analysis. The wrong multiple can make a cheap stock look expensive or an expensive stock look cheap, leading to missed opportunities or costly mistakes. Matching the metric to the business ensures your comparisons are meaningful.
Earnings-based multiples like P/E work well for profitable, stable businesses, but break down when earnings are negative or volatile. Enterprise value multiples like EV/EBITDA account for capital structure differences but ignore capital intensity. Revenue multiples provide anchors for unprofitable companies but ignore profitability entirely. Specialized multiples for financials, REITs, and subscription businesses capture industry-specific value drivers.
TIKR provides all of these multiples in one platform, allowing you to choose the right metric for each situation. Historical ranges indicate whether the current valuation is high or low relative to the company’s past performance. Peer comparisons reveal relative positioning within an industry. Together, these tools help you develop valuation views grounded in the metrics that actually matter.
The best investors know that valuation multiples are tools, not answers. The right multiple for the situation, interpreted with judgment about quality, growth, and sustainability, provides insight that generic comparisons cannot match.
Find undervalued stocks in less than 60 seconds with TIKR’s new Valuation Model (It’s free) >>>
Value Any Stock in Under 60 Seconds with TIKR
With TIKR’s new Valuation Model tool, you can estimate a stock’s potential share price in under a minute.
All it takes is three simple inputs:
- Revenue Growth
- Operating Margins
- Exit P/E Multiple
If you’re not sure what to enter, TIKR automatically fills in each input using analysts’ consensus estimates, giving you a quick, reliable starting point.
From there, TIKR calculates the potential share price and total returns under Bull, Base, and Bear scenarios, so you can quickly determine whether a stock is undervalued or overvalued.
See a stock’s true value in under 60 seconds (Free with TIKR) >>>
Looking for New Opportunities?
- Discover which stocks billionaire investors are purchasing, so you can follow the smart money.
- Analyze stocks in as little as 5 minutes with TIKR’s all-in-one, easy-to-use platform.
- The more rocks you overturn… the more opportunities you’ll uncover. Search 100K+ global stocks, global top investor holdings, and more with TIKR.
Disclaimer:
Please note that the articles on TIKR are not intended to serve as investment or financial advice from TIKR or our content team, nor are they recommendations to buy or sell any stocks. We create our content based on TIKR Terminal’s investment data and analysts’ estimates. Our analysis might not include recent company news or important updates. TIKR has no position in any stocks mentioned. Thank you for reading, and happy investing!