
Key Takeaways:
- Value-Led Execution Reset: McDonald’s Corporation accelerated traffic recovery in 2025 through Extra Value Meals and McValue, which management tied to stabilizing U.S. comps despite low-income QSR traffic declines near double digits.
- Menu and Digital Momentum: McDonald’s Corporation expanded growth drivers in 2025 through Snack Wraps, beverage pilots across 500 stores, and app-led promotions that lifted systemwide sales 8% globally.
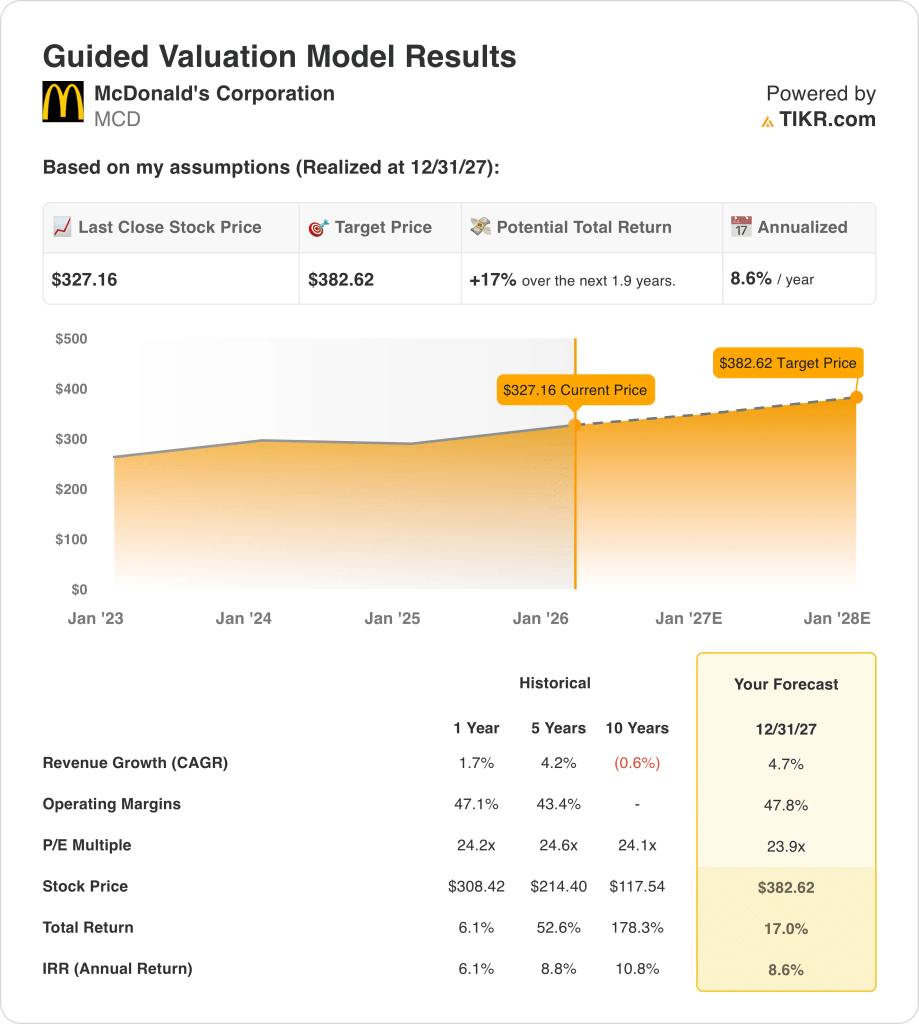
- Valuation Anchor: McDonald’s Corporation stock reflects a $383 target price by December 2027, based on 5% revenue growth, 48% operating margins, and a normalized 24x earnings multiple.
- Return Profile: McDonald’s Corporation offers 17% total upside from the current $327 price, translating into an 9% annualized return over roughly 2 years under disciplined valuation math.
McDonald’s Corporation (MCD) runs and franchises quick-service restaurants worldwide, selling burgers, chicken, beverages, and breakfast items to value-oriented consumers across developed and emerging markets at massive global scale.
In the last fiscal year, revenue reached $26 billion, gross profit totaled $15 billion, operating expenses were $3 billion, and operating income reached $12 billion, supporting operating margins near 46%.
Profitability remained resilient as pricing discipline and mix offset wage and food inflation, while digital channels and loyalty programs reinforced repeat traffic and higher average checks across major geographies.
Recent execution centered on restoring everyday affordability, with management reintroducing Extra Value Meals in September 2025 and pairing them with targeted marketing investments exceeding $100 million through early 2026.
Chief Executive Officer Chris Kempczinski stated, “Delivering industry-leading value is part of McDonald’s DNA,” reinforcing management’s focus on traffic-led growth over margin maximization in a pressured consumer environment.
International momentum strengthened as Germany, Australia, and Japan posted share gains in 2025, while China expansion continued with plans for 1,000 new restaurants despite deflationary delivery competition.
With the stock trading near $327 and valuation assuming sustained mid-single-digit growth into 2027, investors face tension between McDonald’s durable cash flows and a return profile capped below historical double-digit norms.
What the Model Says for MCD Stock
McDonald’s stock benefits from scale, a franchised model, and value positioning, while mature markets and capital intensity constrain growth expectations.
The valuation model applies 4.7% revenue growth, 47.8% margins, and a 23.9x exit multiple, and it produces a $382.62 target price.
This setup implies 17% total upside and an 8.6% annualized return, and that return sits modestly against public equity risk alternatives.
Therefore, the model issues a Sell because the 8.6% annualized return does not compensate investors for public equity risk.
As the 8.6% annualized return falls below a typical 10% equity hurdle, the valuation prioritizes capital preservation over appreciation, and disciplined valuation logic supports a Sell.
Our Valuation Assumptions
TIKR’s Valuation Model lets you plug in your own assumptions for a company’s revenue growth, operating margins, and P/E multiple, and calculates the stock’s expected returns.
Here’s what we used for McDonald stock:
1. Revenue Growth: 4.7%
McDonald stock’s revenue expanded at a 1.7% CAGR over the past year as mature markets offset unit additions and pricing actions.
Current performance supports a 4.7% growth outlook as global comparable sales rose 3.6% and systemwide sales increased 6% in constant currency.
This assumption requires continued traffic support from value programs, menu innovation, and new unit openings, while consumer pressure or competitive discounting would slow momentum quickly.
This is above the 1-year historical revenue growth of 1.7%, indicating the model assumes a rebound that depends on sustained execution rather than structural acceleration.
2. Operating Margins: 47.8%
McDonald stock’s operating margins averaged 47.1% over the past year, supported by a highly franchised model and strong restaurant-level economics.
Recent results justify a 47.8% margin assumption as year-to-date margins reached 47.2% despite higher marketing spend and food cost inflation.
Maintaining this level requires stable franchise profitability, disciplined value investments, and cost control, while prolonged inflation or heavier corporate support would pressure margins.
This is above the 1-year historical operating margin of 47.1%, indicating the model assumes modest efficiency gains rather than a structural margin shift.
3. Exit P/E Multiple: 23.9x
The exit multiple capitalizes McDonald stock’s net earnings at a level consistent with a global consumer brand in a mature, capital-intensive industry.
A 23.9x P/E reflects durable cash flows, brand resilience, and steady growth expectations already embedded through margin stability and revenue expansion assumptions.
The market currently prices McDonald’s at a 25.2x NTM P/E, and the model therefore embeds modest multiple compression as execution normalizes into 2027.
This is slightly below the 1-year historical P/E of 24.2x, indicating the model assumes mild valuation normalization rather than a re-rating opportunity.
What Happens If Things Go Better or Worse?
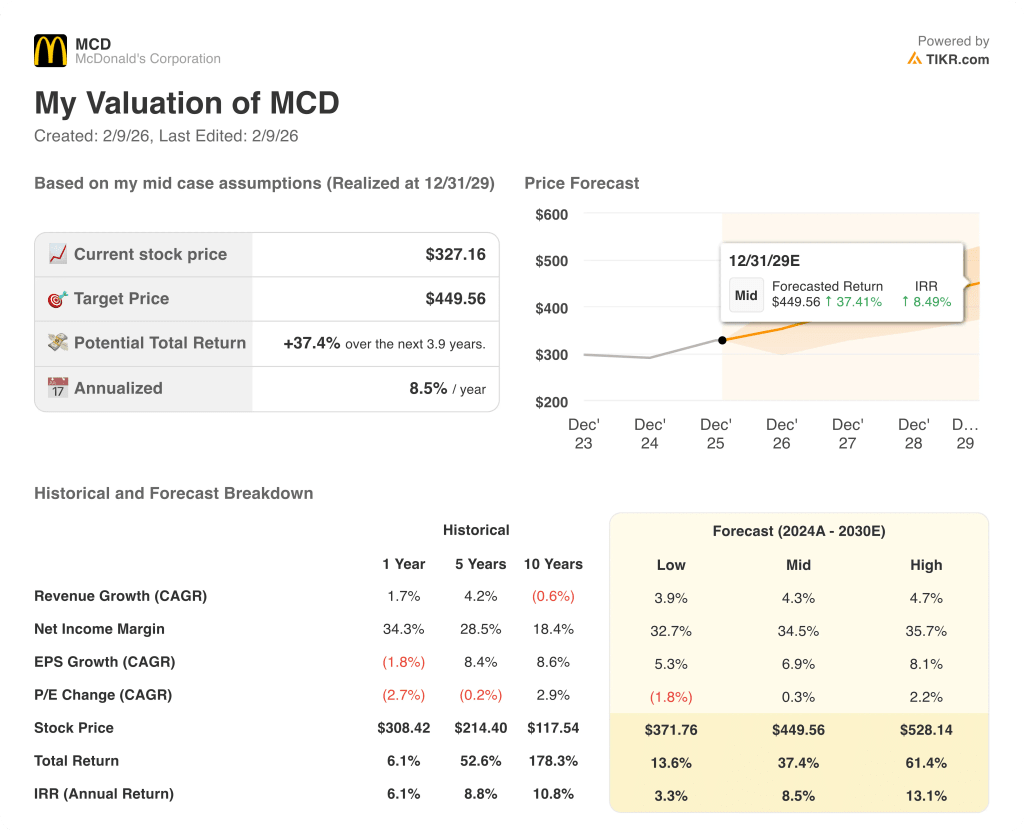
McDonald’s stock outcomes depend on global consumer demand, franchise execution, value positioning, and cost discipline, setting up a range of possible paths through 2029.
- Low Case: If traffic weakens and value pressure persists, revenue grows around 3.9% and margins stay near 32.7% → 3.3% annualized return.
- Mid Case: With core demand steady and franchise execution intact, revenue growth near 4.3% and margins improve toward 34.5% → 8.5% annualized return.
- High Case: If menu innovation scales and digital engagement accelerates, revenue reaches about 4.7% and margins approach 35.7% → 13.1% annualized return.
How Much Upside Does McDonald Stock Have From Here?
With TIKR’s new Valuation Model tool, you can estimate a stock’s potential share price in under a minute.
All it takes is three simple inputs:
- Revenue Growth
- Operating Margins
- Exit P/E multiple
If you’re not sure what to enter, TIKR automatically fills in each input using analysts’ consensus estimates, giving you a quick, reliable starting point.
From there, TIKR calculates the potential share price and total returns under Bull, Base, and Bear scenarios so you can quickly see whether a stock looks undervalued or overvalued.
Looking for New Opportunities?
- See what stocks billionaire investors are buying so you can follow the smart money.
- Analyze stocks in as little as 5 minutes with TIKR’s all-in-one, easy-to-use platform.
- The more rocks you overturn… the more opportunities you’ll uncover. Search 100K+ global stocks, global top investor holdings, and more with TIKR.
Disclaimer:
Please note that the articles on TIKR are not intended to serve as investment or financial advice from TIKR or our content team, nor are they recommendations to buy or sell any stocks. We create our content based on TIKR Terminal’s investment data and analysts’ estimates. Our analysis might not include recent company news or important updates. TIKR has no position in any stocks mentioned. Thank you for reading, and happy investing!