Key Takeaways:
- Demand Recovery Signal: Microchip Technology stock reflects improving bookings after Q3 revenue guidance rose to $1 billion, signaling inventory normalization across industrial and automotive markets.
- Execution Update: Microchip Technology stock reflects margin stabilization as factory utilization improves and internal inventory reductions lower write-offs after a sharp 42% revenue decline.
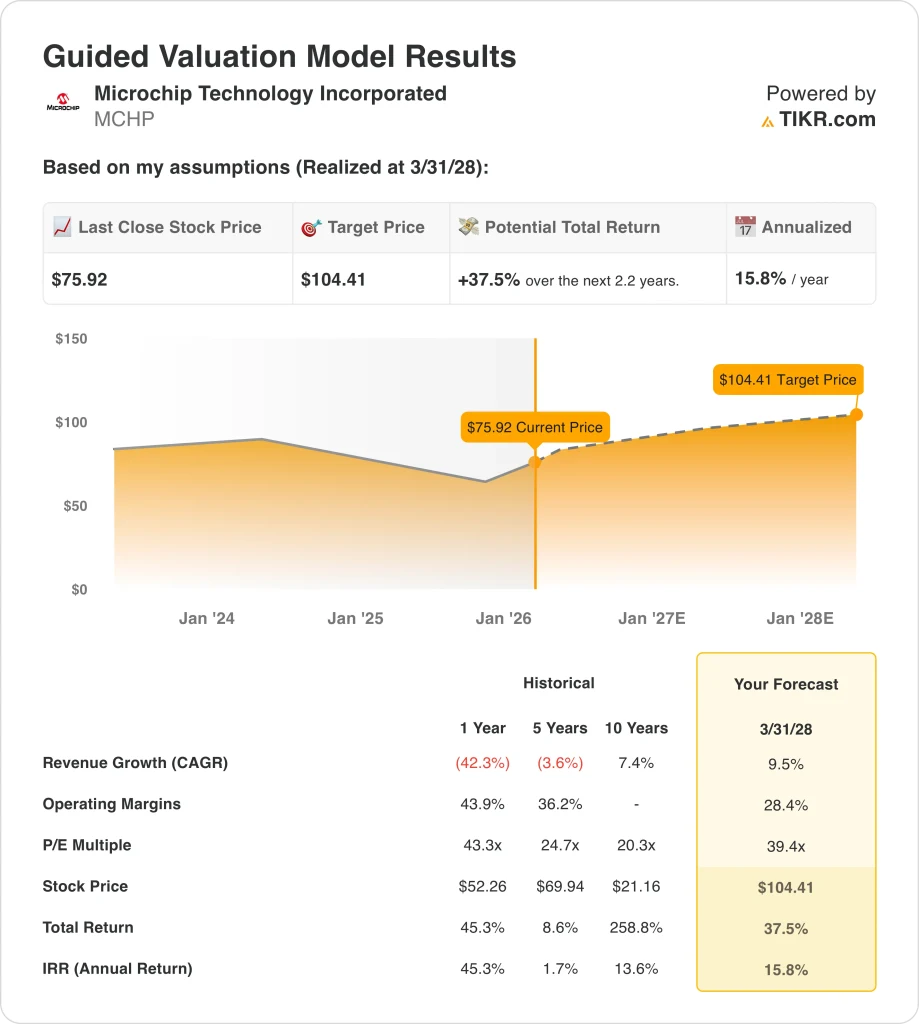
- Price Target: Based on normalized demand recovery, Microchip Technology stock could reach $104 by March 2028 under conservative growth and margin assumptions.
- Upside Math: From the current $76 price, Microchip Technology stock implies 38% total upside and a 16% annualized return over 2 years.
Microchip Technology (MCHP) develops embedded semiconductors for industrial and automotive markets, holding scale advantages across microcontrollers after generating $4 billion in LTM revenue.
In January, Microchip Technology raised its Q3 sales outlook to $1 billion which signals improving bookings as customers cleared excess pandemic-era inventory.
Microchip Technology produced $2 billion in LTM gross profit, with margins compressing to 54% as factory underutilization weighed on near-term profitability.
Profitability recovery depends on volume stabilization, inventory discipline, and operating leverage, supported by a 28% operating margin assumption as utilization improves.
Microchip stock trades near $76 while valuation implies $104, reflecting tension between improving fundamentals and cautious market pricing.
What the Model Says for MCHP Stock
We modeled Microchip stock using assumptions tied to demand recovery, margin improvement, and capital returns across industrial and automotive markets.
Based on 9.5% revenue growth, 28.4% operating margins, and a 39.4x exit multiple, the model points to $104.
That implies a 38% total return, or a 16% annualized return, over roughly 2 years to a $104 target price.
Our Valuation Assumptions
TIKR’s Valuation Model lets you plug in your own assumptions for a company’s revenue growth, operating margins, and P/E multiple, and calculates the stock’s expected returns.
Here’s what we used for MCHP stock:
1. Revenue Growth: 9.5%
Microchip Technology revenue declined sharply over the past year as customers worked through excess inventory across industrial and automotive semiconductor markets.
Recent guidance upgrades show bookings improving, with third quarter sales expected near $1 billion as demand normalizes across embedded and analog end markets.
Growth is supported by inventory reductions, backlog recovery, and cross-selling across microcontrollers and analog, while risks include uneven industrial recovery.
According to consensus analyst estimates, 9.5% revenue growth reflects cyclical recovery balanced against slower global capital spending trends.
2. Operating Margins: 28.4%
Microchip stock historically generated operating margins above 30% during peak embedded semiconductor demand cycles.
Margins compressed recently to single digits as underutilization charges and lower volumes weighed on profitability during the inventory correction phase.
Improving factory utilization, lower write-offs, and operating leverage from revenue recovery support margin adjustment toward prior cycle averages.
In line with analyst consensus projections, 28.4% operating margins balance recovery leverage against continued pricing and utilization discipline.
3. Exit P/E Multiple: 39.4x
MCHP stock currently trades below prior peak multiples following earnings volatility and concerns around industrial and automotive demand durability.
Historically, the Microchip stock traded at higher multiples during periods of steady growth, stable margins, and clear long-term demand.
Multiple expansion requires consistent revenue and margin recovery, and confidence in recurring product design wins across end markets.
Based on street consensus estimates, a 39.4x exit multiple reflects improved earnings visibility without assuming investor enthusiasm.
What Happens If Things Go Better or Worse?
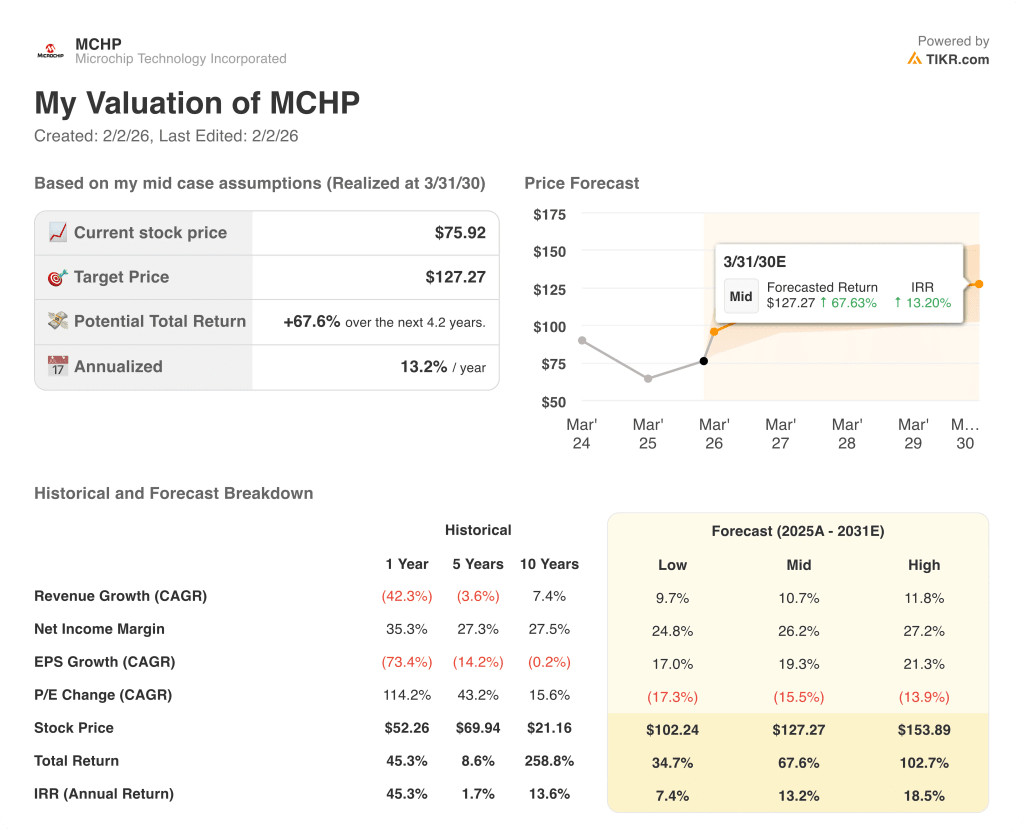
Microchip stock outcomes depend on demand recovery, inventory normalization, and operating leverage through 2030.
- Low Case: If industrial recovery lags and utilization stays pressured, revenue grows around 9.7% → 7.4% annualized return.
- Mid Case: With bookings improving and costs controlled, revenue growth near 10.7% supports a 13.2% per-year return.
- High Case: If end markets rebound faster and leverage improves, revenue reaches about 11.8% → 18.5% annualized return.
The $127 target price reflects inventory recovery, higher utilization, and margin recovery, without relying on multiple expansion.
How Much Upside Does It Have From Here?
With TIKR’s new Valuation Model tool, you can estimate a stock’s potential share price in under a minute.
All it takes is three simple inputs:
- Revenue Growth
- Operating Margins
- Exit P/E multiple
If you’re not sure what to enter, TIKR automatically fills in each input using analysts’ consensus estimates, giving you a quick, reliable starting point.
From there, TIKR calculates the potential share price and total returns under Bull, Base, and Bear scenarios so you can quickly see whether a stock looks undervalued or overvalued.
Looking for New Opportunities?
- See what stocks billionaire investors are buying so you can follow the smart money.
- Analyze stocks in as little as 5 minutes with TIKR’s all-in-one, easy-to-use platform.
- The more rocks you overturn… the more opportunities you’ll uncover. Search 100K+ global stocks, global top investor holdings, and more with TIKR.
Disclaimer:
Please note that the articles on TIKR are not intended to serve as investment or financial advice from TIKR or our content team, nor are they recommendations to buy or sell any stocks. We create our content based on TIKR Terminal’s investment data and analysts’ estimates. Our analysis might not include recent company news or important updates. TIKR has no position in any stocks mentioned. Thank you for reading, and happy investing!