Key Stats for Figma Stock
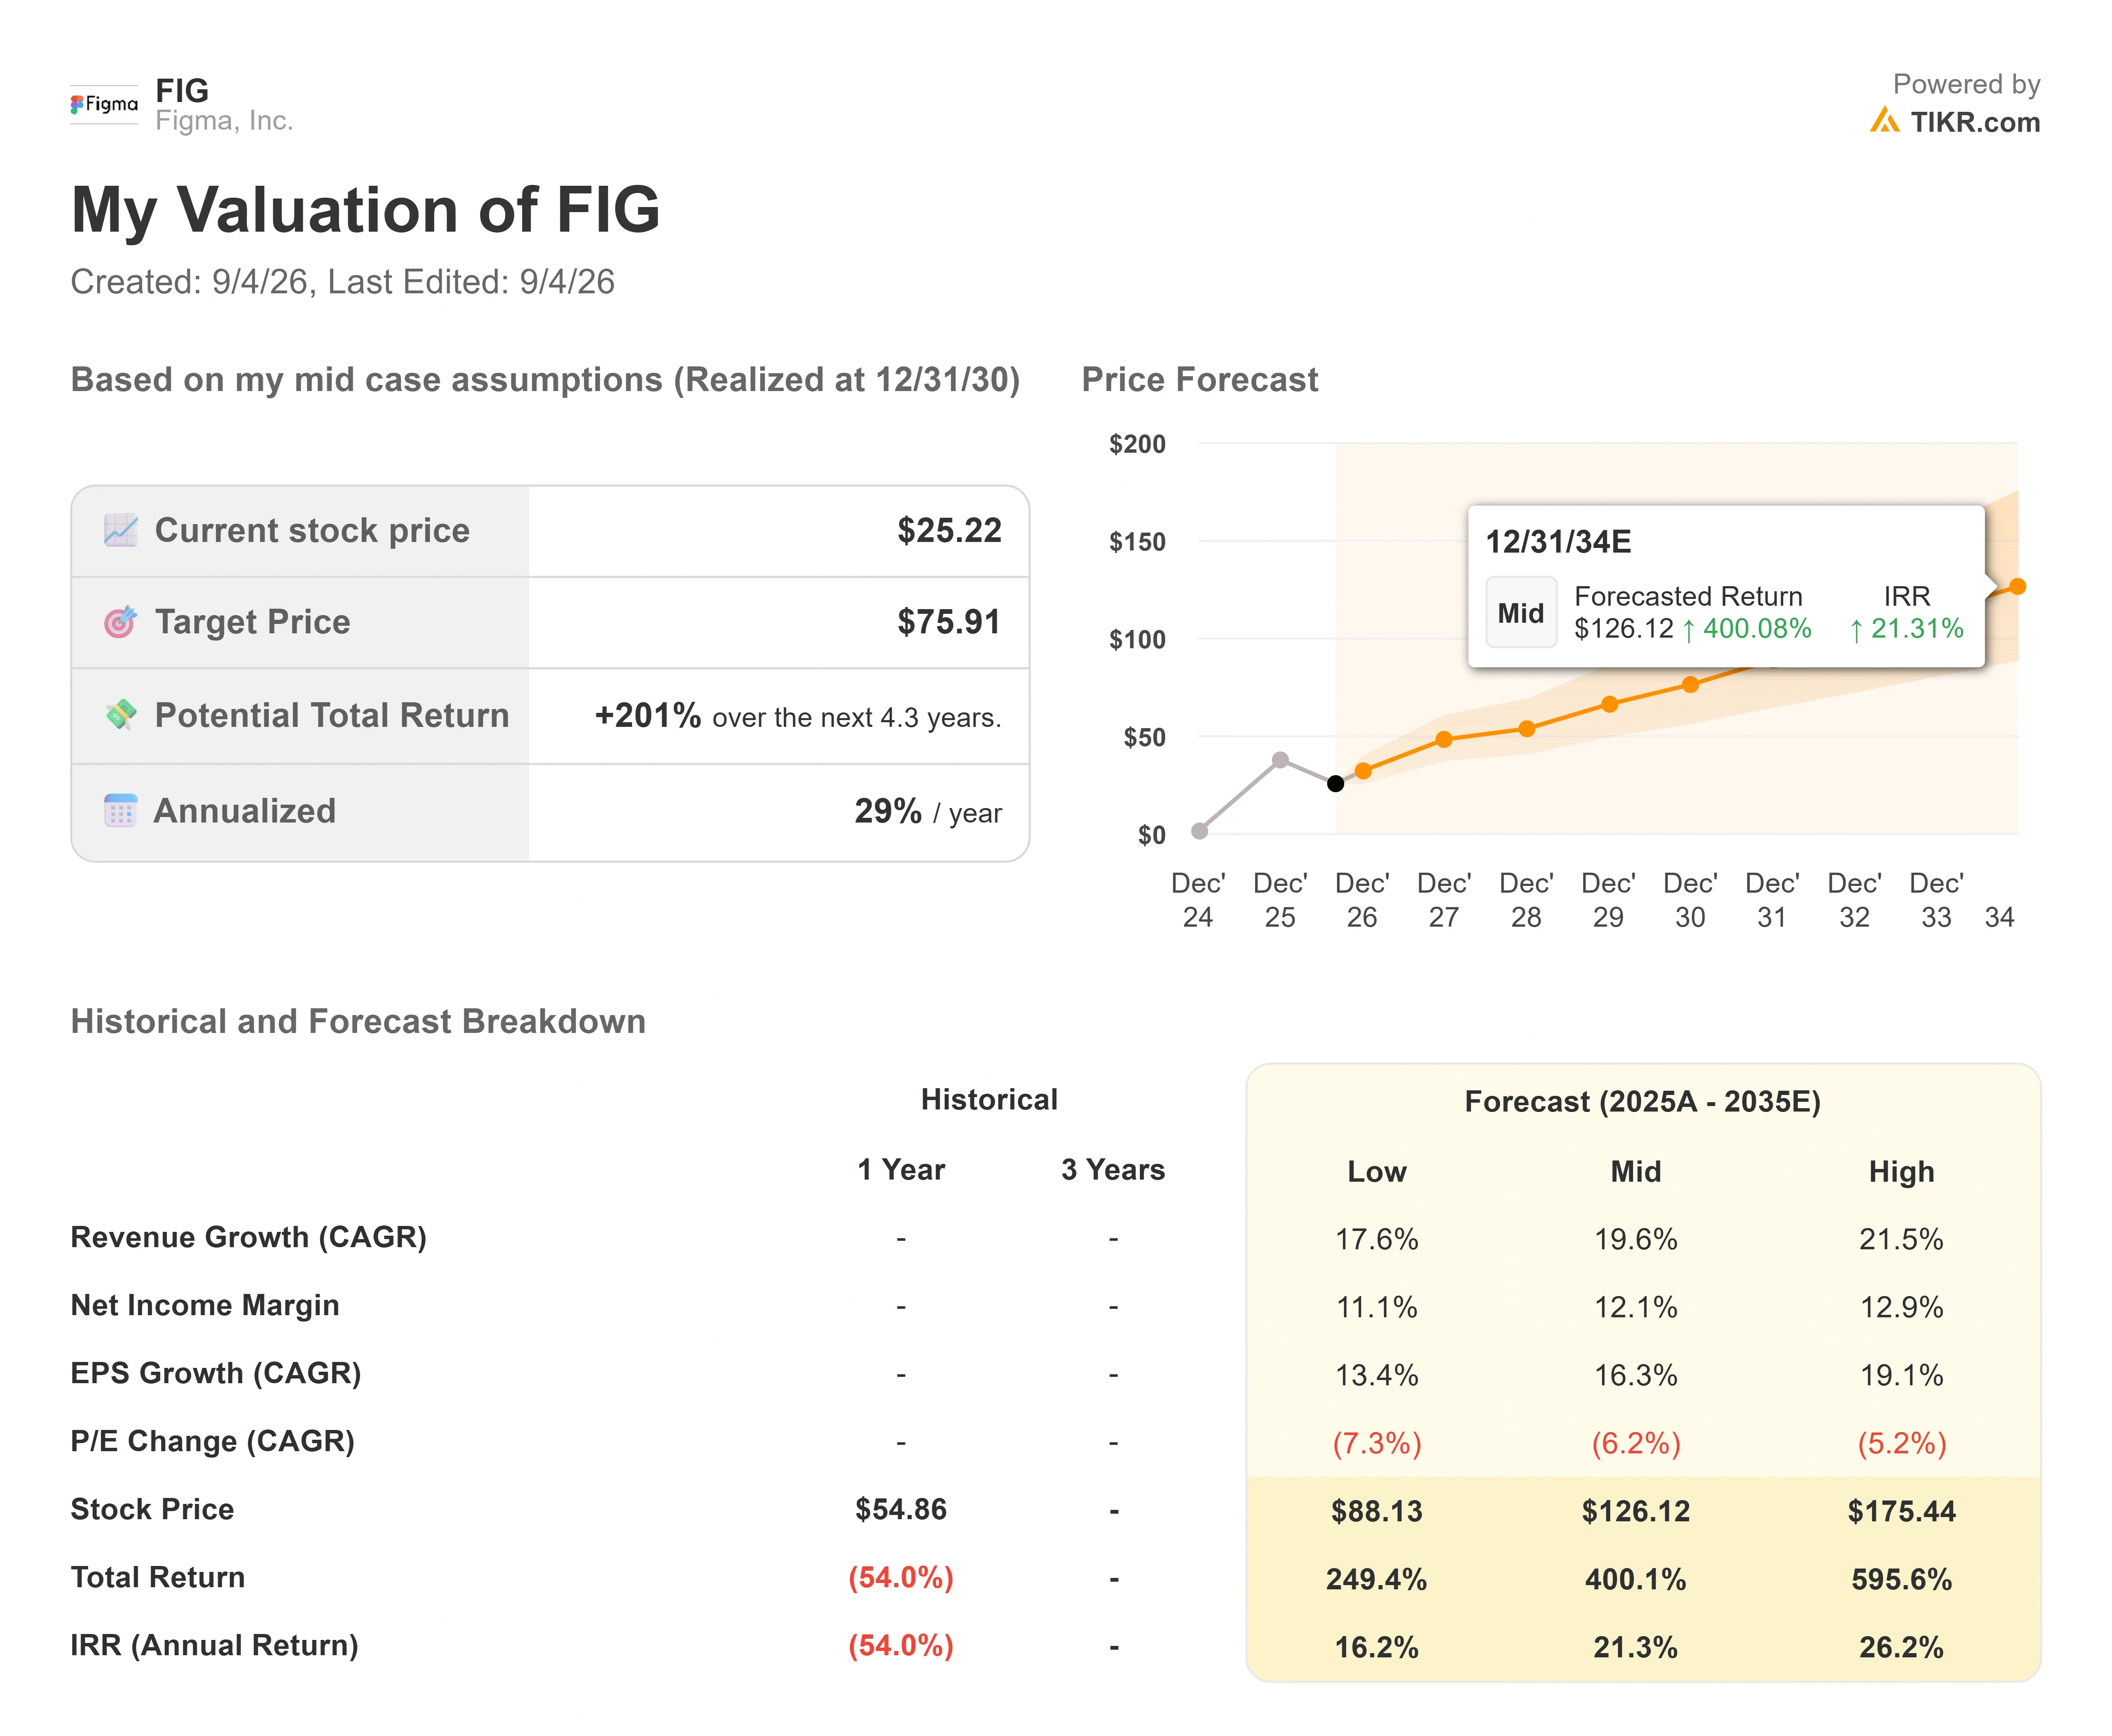
- Current Price: $25.22
- Target Price (Mid): ~$76
- Street Target: ~$31
- Potential Total Return: ~201%
- Annualized IRR: ~29% / year
Now Live: Discover how much upside your favorite stocks could have using TIKR’s new Valuation Model (It’s free) >>>
What Happened?
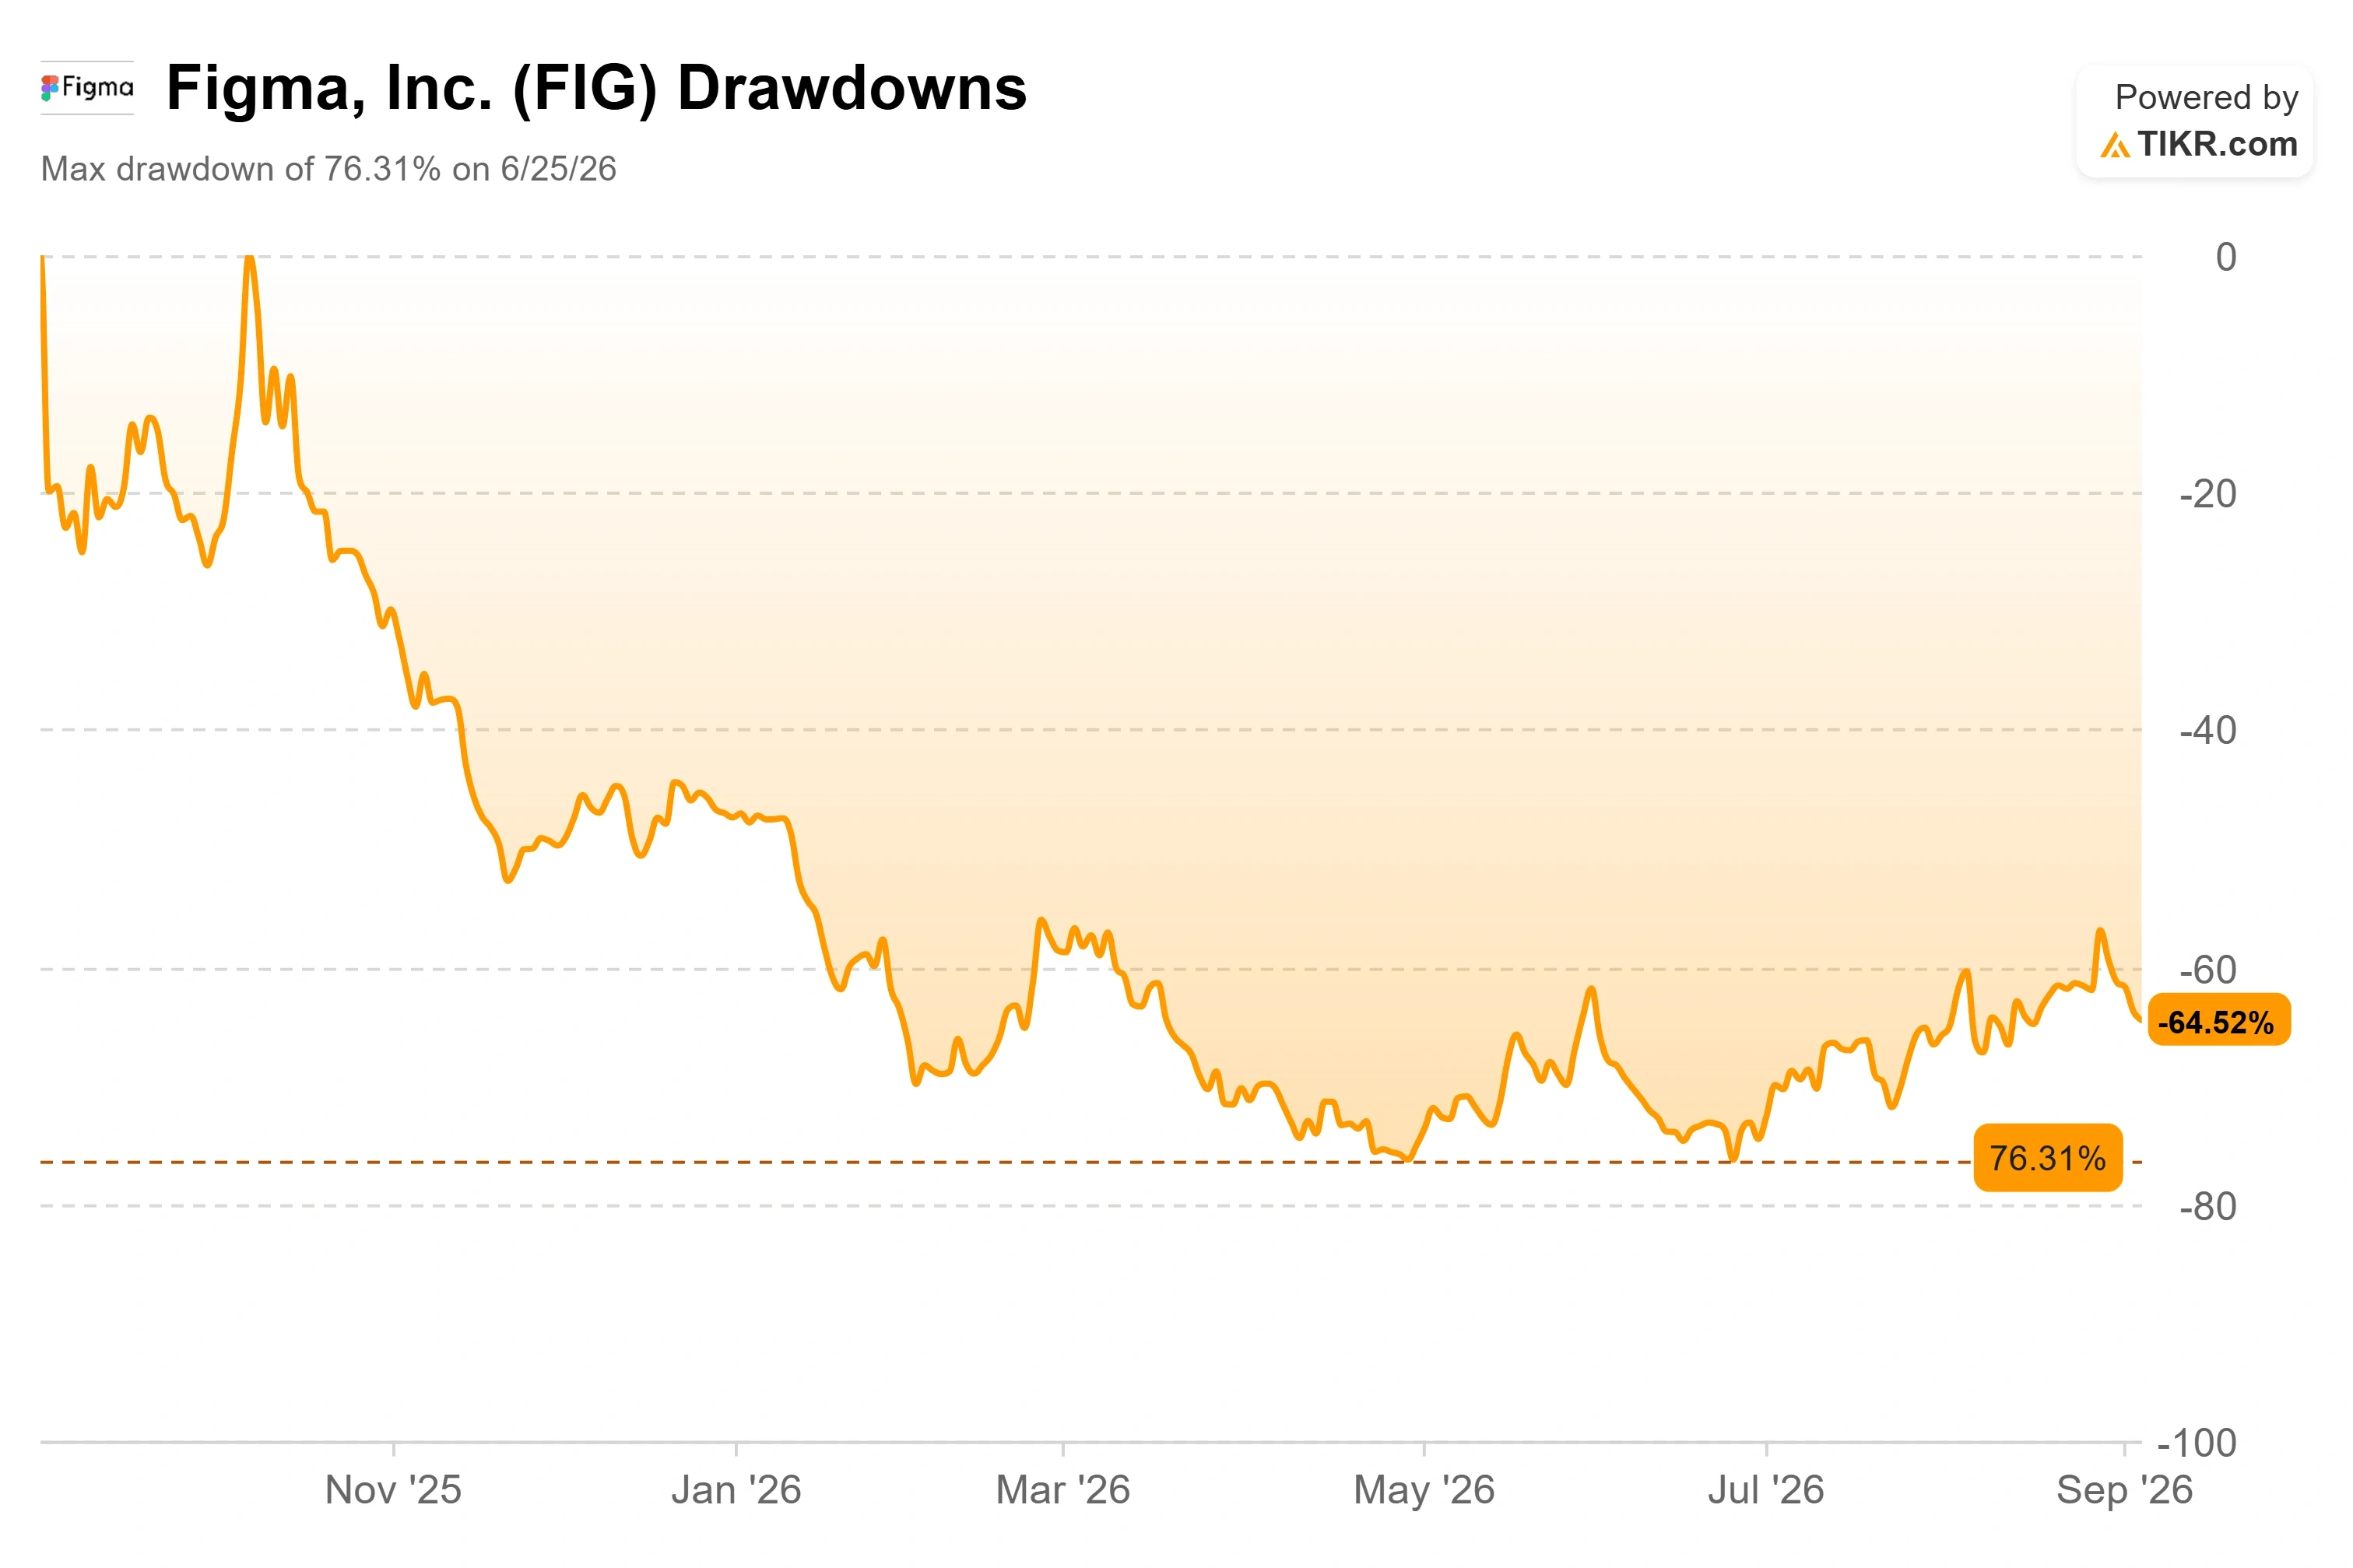
Figma (FIG) beat on revenue, raised its full-year outlook, and still trades 65% below the high it set less than a year ago. At $25.22, the stock has round-tripped from a post-IPO peak of $71.48 down to the teens and back, and the two forces that suppressed it all year have now cleared. The final post-IPO lock-up came off in early August, and the brutal post-earnings reaction that followed the Q2 print is a month behind the stock.
What is left is a cleaner valuation question than FIG has faced since it went public: with the supply overhang gone, is a company still growing revenue 48% actually cheap here, or is the market pricing the losses correctly?
Why the Beat Did Not Save the Stock
Figma’s Q2 was strong where it mattered on the top line. Revenue hit $370.08 million, up 48% year-over-year and more than 5% past the $351.52 million the Street modeled, a third straight quarter of accelerating growth. Net dollar retention, a measure of how much more existing customers spend over time, held at 136%, and management raised full-year guidance by $40 million to a range of $1.463 billion to $1.467 billion.
Two lines below the revenue beat did the damage. Non-GAAP gross margin came under pressure as Figma paid for inference on AI products still in beta that do not yet charge customers. Non-GAAP operating margin landed at 10%, weighed down further by the cost of Config, the company’s annual user conference held in the quarter. CFO Praveer Melwani was blunt about the spending: “This is the right moment to lean into investment given the strong signals we see.” He framed the deeper spend as a deliberate bet that near-term margin is worth a durable long-term edge. Investors, already wary of a high-multiple stock, sold first.
See historical and forward estimates for Figma stock (It’s free!) >>>
The Overhang That Just Cleared, and the One That Did Not
For most of the year, supply capped the stock. Figma’s extended lock-up released roughly 77.7 million Class A shares, worth close to $1.9 billion at the time, in early August. That was the last major tranche from the post-IPO structure, and it landed right as the stock was already reeling from earnings. The overhang analysts had flagged since spring is now behind the stock rather than ahead of it.
In May, Findell Capital pressed Figma to cut costs and simplify its product line, flagging 2026 stock-based compensation near $375 million, about 27% of revenue, against roughly 8% at Adobe. For a company still posting GAAP losses, that dilution is a real drag on per-share value, and it is the clearest thing management could still address.
What the Cheapness Actually Rests On
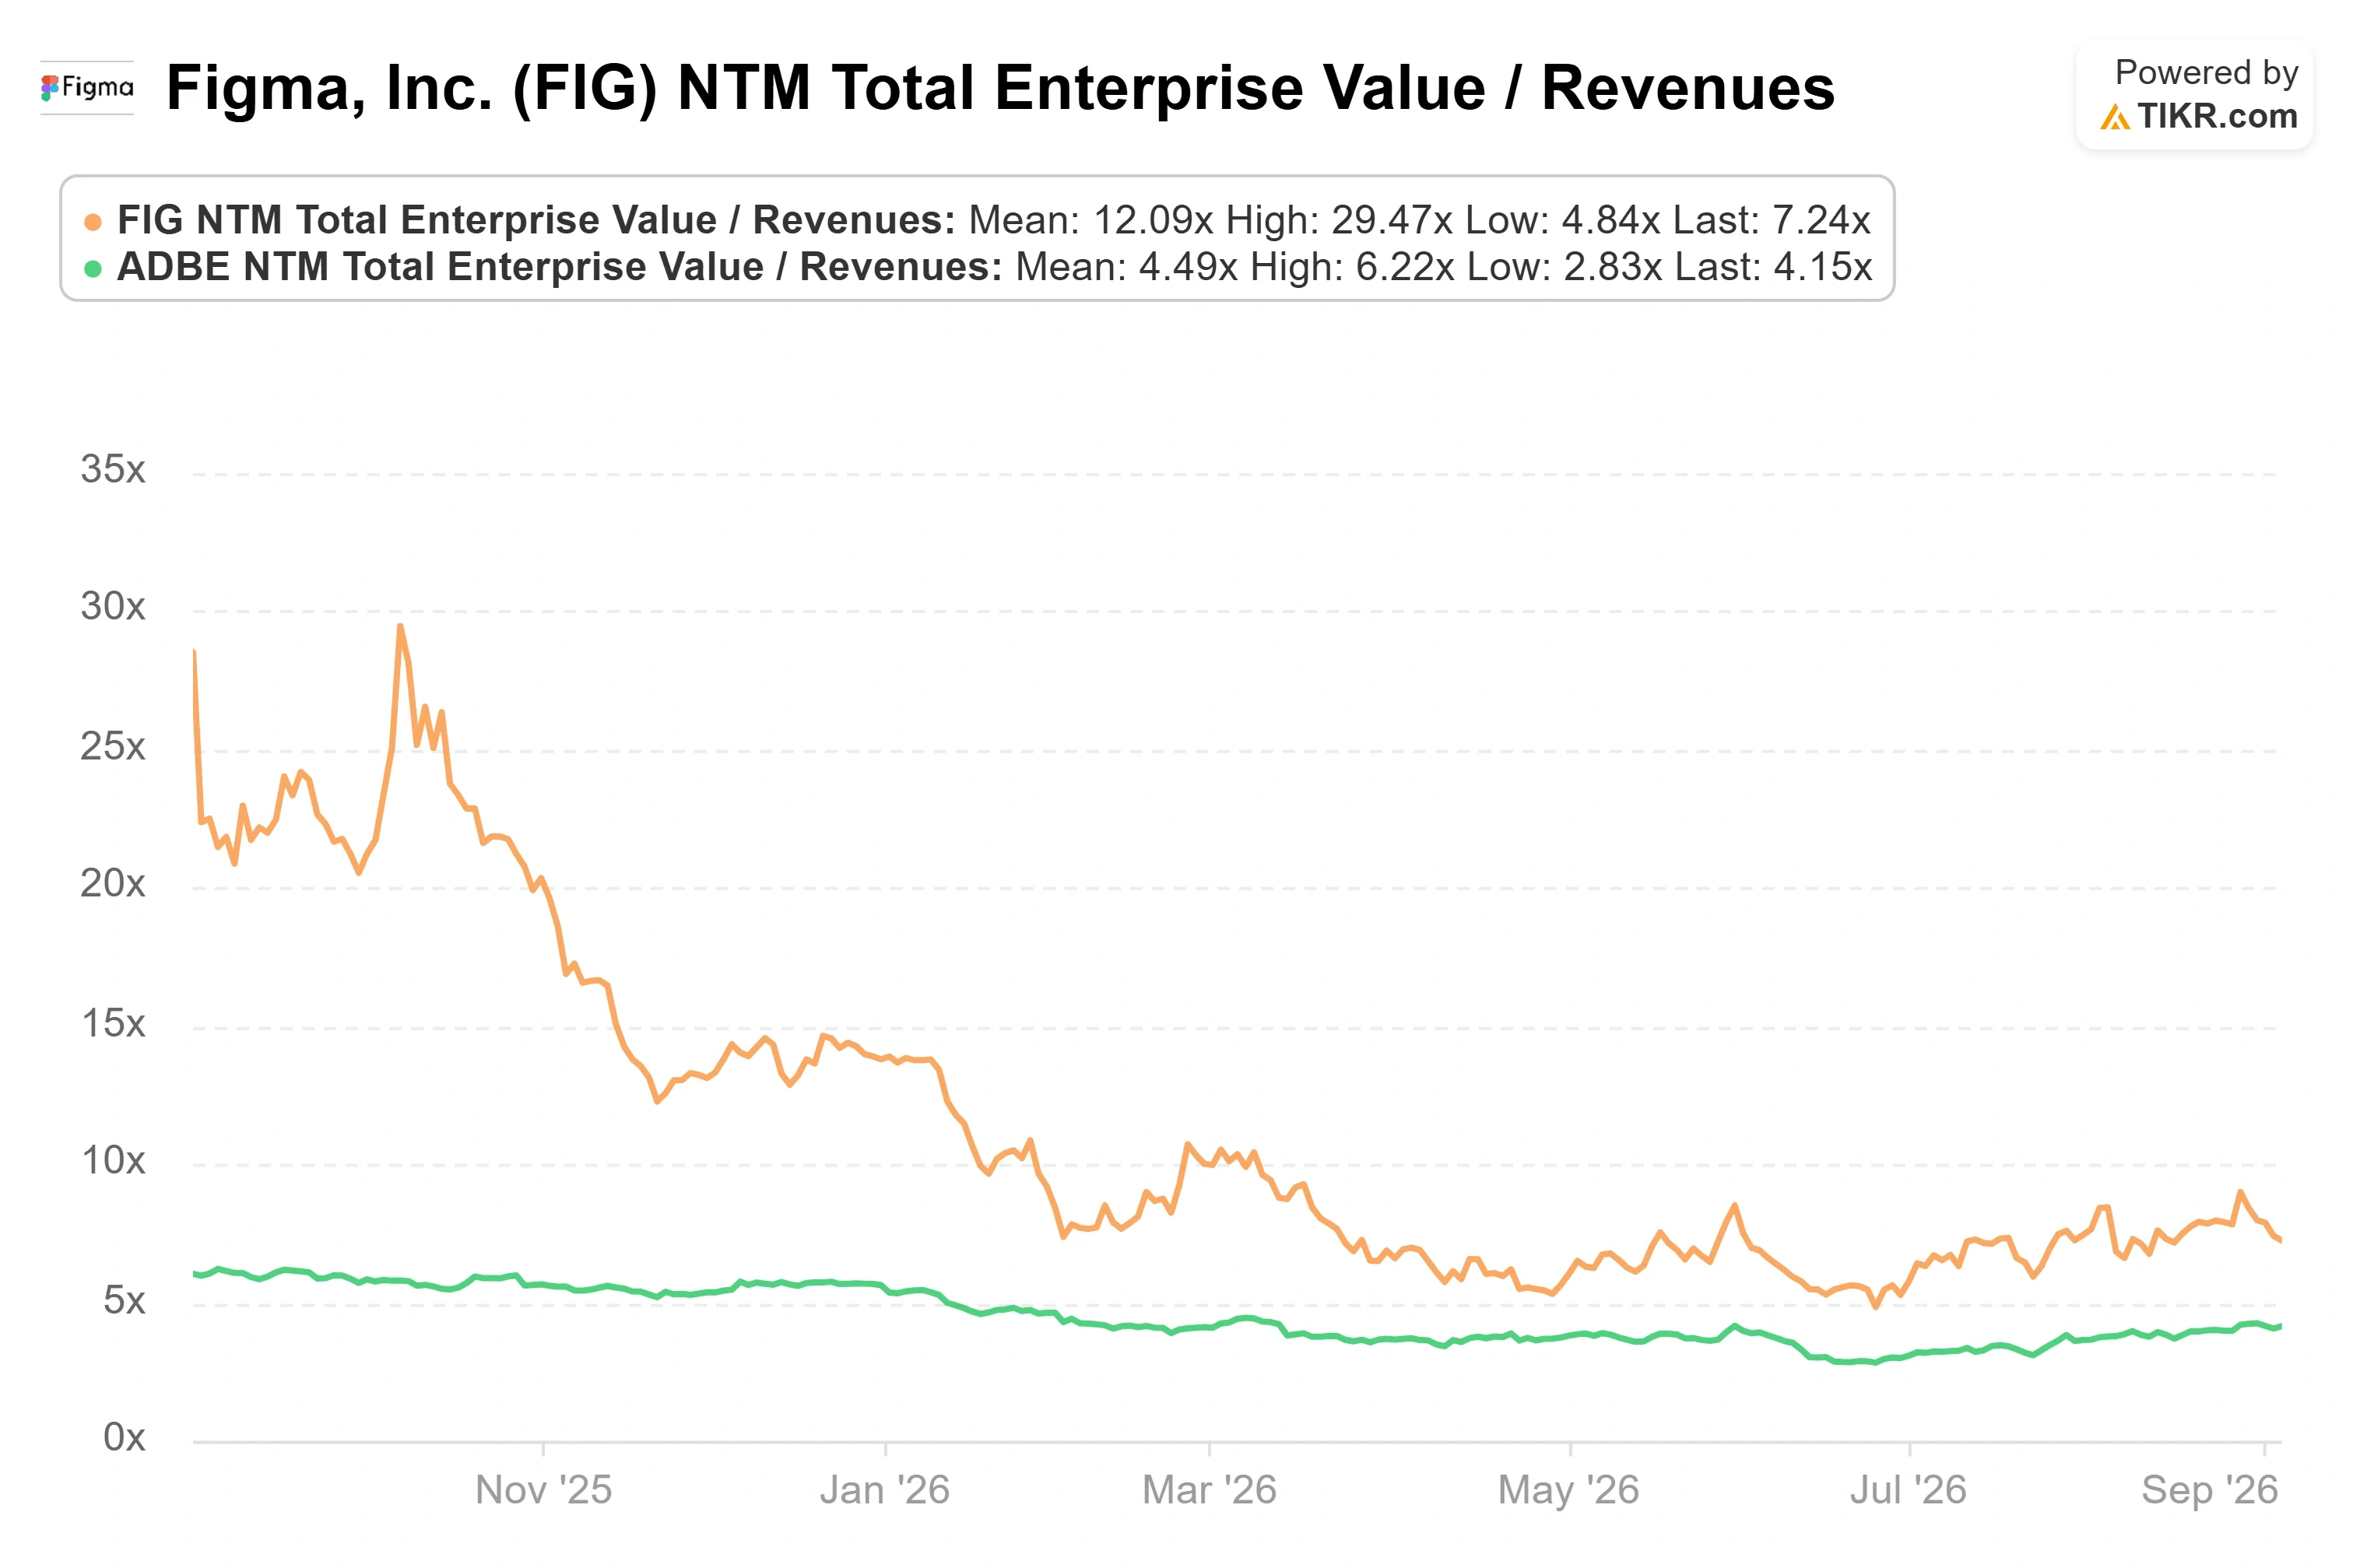
On a GAAP basis, Figma loses money, so the trailing P/E is negative and useless. On sales, the stock trades at 9.24x trailing revenue and 7.24x forward revenue, rich against software peers but well below the 27x enterprise-value-to-sales multiple it carried a year ago. Against Adobe, the gap is stark: Adobe sits near 4.15x forward revenue and 11x forward earnings, versus Figma’s 7.24x and a forward earnings multiple in the 90s. That premium only holds if Figma’s growth stays more than double Adobe’s and the AI spend turns into profit instead of burning it.
Figma’s roughly 80% gross margin lets revenue reach profitability fast once the beta products it subsidizes today start charging. The company routes AI tasks across models, leans on outside providers, and is moving first-party models trained on its own design corpus into the agent to hold inference costs down. If that works, margins inflect, and the multiple is defensible. If AI-native rivals like Anthropic’s Claude Design commoditize design generation faster than Figma can monetize it, pricing power erodes, and the growth story breaks. That single fork, not the lock-up or the activist, is what decides the stock from here.
See how Figma performs against its peers in TIKR (It’s free!) >>>
TIKR Advanced Model Analysis
- Current Price: $25.22
- Target Price (Mid): ~$76
- Potential Total Return: ~201%
- Annualized IRR: ~29% / year
See analysts’ growth forecasts and price targets for Figma stock (It’s free!) >>>
TIKR’s mid-case scenario values Figma near $76 per share by the end of 2030, roughly 201% upside and about a 29% annualized return from today. Two revenue drivers carry it: AI credit monetization, now in its first full quarter and spreading across enterprise accounts, and seat growth, where about two-thirds of Figma’s largest customers added full seats at their latest renewal. The margin driver is operating leverage on that 80% gross margin as revenue outpaces spending once beta products convert to paid. The primary risk is AI commoditization: if Claude Design and its kind erode pricing power, the mid-case revenue CAGR near 20% does not hold.
Upside: AI flips from threat to tailwind, credit consumption compounds inside accounts already using it weekly, and the market realizes it mispriced a durable platform in a panic. Downside: growth decelerates toward 30%, GAAP losses persist, and the stock drifts back toward the Street’s roughly $31 mean target or lower.
Conclusion
The next real test is the Q3 report, expected in November. Figma guided Q3 revenue to $373 million to $375 million, about 36% growth, so the bar management set is the number to judge against. Clearing that guide with net dollar retention holding above 135% would confirm AI monetization is compounding and the discount is real. Coming in at or below the guide with retention slipping toward 130% would tell that the beat-and-fade pattern is now the trend, and the bears keep the stock. The supply overhang is gone. What decides the next leg is execution against a bar the company has already set.
See what stocks billionaire investors are buying so you can follow the smart money with TIKR.
Should You Invest in Figma?
The only way to really know is to look at the numbers yourself. TIKR gives you free access to the same institutional-quality financial data that professional analysts use to answer exactly that question.
Pull up Figma, and you’ll see years of historical financials, what Wall Street analysts expect for revenue and earnings in the quarters ahead, how valuation multiples have moved over time, and whether price targets are trending up or down.
You can build a free watchlist to track Figma alongside every other stock on your radar. No credit card required. Just the data you need to decide for yourself.
Looking for New Opportunities?
- See what stocks billionaire investors are buying so you can follow the smart money.
- Analyze stocks in as little as 5 minutes with TIKR’s all-in-one, easy-to-use platform.
- The more rocks you overturn… the more opportunities you’ll uncover. Search 100K+ global stocks, global top investor holdings, and more with TIKR.
Disclaimer:
Please note that the articles on TIKR are not intended to serve as investment or financial advice from TIKR or our content team, nor are they recommendations to buy or sell any stocks. We create our content based on TIKR Terminal’s investment data and analysts’ estimates. Our analysis might not include recent company news or important updates. TIKR has no position in any stocks mentioned. Thank you for reading, and happy investing!